Article
Machining Performance Analysis in End Milling:
Predicting Using ANN and a Comparative
Optimisation Study of ANN/BB-BC and ANN/PSO
Desmond Eseoghene Ighravwe
1,2,aand Sunday Ayoola Oke
1,b,*
1 Department of Mechanical Engineering, Room 10, Mezzanine Complex, Faculty of Engineering,
University of Lagos, Akoka-Yaba, Lagos, Nigeria
2 Department of Mechanical Engineering, Faculty of Engineering and Technology, Ladoke Akintola
University of Technology, Ogbomoso, Nigeria
E-mail: a[email protected], b[email protected] (Corresponding author)
Abstract. In engineering practice, it is interesting to find top-performing and
newly-developed optimisers to solve particular engineering optimisation problems efficiently. However, until new optimisers are extensively used on problems, their potentials may be least known. This paper presents applications of a multi-objective surrogate-based optimisation of end milling machine performance. Back-propagation neural networks are trained in generating objective functions for surface roughness and tool wear. The optimisers are the big-bang big-crunch (BB-BC) and particle swarm optimisation (PSO). The novelty of the paper lies in the application of the newly developed BB-BC in the machining field and the novel combination of the artificial neural network (ANN) with BB-BC. The results obtained from the two case studies presented indicate that the proposed approach is capable of selecting optimal solutions.
Keywords: Meta-heuristics, fuzzy programming, end milling parameters, artificial neural
network, machining, surface finish, tool wear.
ENGINEERING JOURNAL Volume 19 Issue 5
1.
Introduction
Surface roughness and tool wear have been recognised as two chief drawbacks in the milling process, if not well-managed. They offer great restrictions on competitiveness and impacts on productivity, costs and the goodwill of the machine tool industry [1–6]. For example, it is well known that in the machining industry, a slight miss of tolerance limits invokes a price disadvantage on the product in the stiff competition in the industry. Thus, surface integrity plays an important role in maintaining competitive machining operations. The explanatory variables for machining performance, usually termed the process parameters are diverse. For surface roughness in end milling the explanatory variables may include feed rate, spindle speed, cutting speed, immersion angle and depth-of-cut (radial and axial) and nose radius. In machining science and technology, machining performance in end milling has been a long-standing research conversation,
spanning from the seminal article of Xu et al. [1] through Armarego et al.’s work [2], and a number of
others, to the most recent contribution by Cai et al. [6]. This is indicative of the fact that machining
performance analysis is an important subject and further discussions in view of capacity enhancement needs of the milling industry for heightened competitiveness should be pursued rigorously. This implies that enhanced predictive models and optimisation approaches found to be successful in other areas of engineering could be applied to the benefit of the milling process and the research community.
For example, the big-bang big-crunch (BB-BC) optimisation, a newly evolving efficient and powerful tool with successful applications in electrical engineering and facility layout modelling has not been reported in any paper on machining performance analysis to the best of our knowledge. Therefore, the aim of this paper was to develop an effective approach to predict as well as optimise a number of machining performance indicators as a general approach to suitably adapt to specific process needs in end milling operation. A new approach that considers the marriage of artificial neural network (ANN) with each of the BB-BC as well as the particle swarm optimisation (PSO) algorithms was initiated as a research direction in this paper.
By following the arguments in the preceding paragraph, precise predictions and optimisation of machining performance attracts the critical attention of the machine tool operators and researchers. Prediction and optimisation are the principal pillars of the current investigation and have emerged for years with an expansive mass of knowledge in the general engineering literature. In the area of machining science and technology, the application of artificial intelligence and non-traditional optimisation have been known but in the sub-area of end milling, information concerning these tools is just growing.
Accordingly, monitoring machining performance in end milling has been a topic of interest to end milling investigators the world over [7, 8] due to the possibility of enhancing outputs, improving delivery and projecting the goodwill of the industry through it. In the past years, a growing number of investigations have attempted to replicate studies on surface integrity and tool wear in the general area of milling to end milling specific area. A number of examples include the works by Prajina [9] and Lakshmi and Subbaiah [10]. These have provided good foundation on the necessity to further enhance the surface integrity and tool wear in end milling. Despite this, some important areas of prediction and optimisation are still very poorly understood. Such as the prediction and the use of non-conventional optimisation tools in end milling process.
Little information is available regarding the effectiveness of the blending of ANN with BB-BC on one hand, and the union of ANN with PSO on the other hand, and previous work attempting this blending is not available. Previous works where end milling has been considered seem to scarcely discuss the issue currently focused on here and knowledge about the prediction power of ANN as well as the optimisation merits of BB-BC and PSO in union are not well known. In this context, the BB-BC and the PSO have considerable potential in the optimisation of the end milling process. The ANN is characteristically useful for modelling complex relationships in end milling due to its excellent information processing behaviours and capability for learning tolerance for noise and generalized capacity for predictive analysis. The BB-BC algorithm is capable of generating optimal solutions for non-linear and linear optimisation models and is a population-based meta-heuristic. The PSO algorithm is a population-oriented meta-heuristic algorithm dependent on the principle of exploration and exploitation of search space in general optimal solutions in models.
In the past years, the end milling literature has experienced several works [22] that tend to improve predictions and optimisation. Instances are the use of ANN, Taguchi method, principal component analysis, desirability function, response surface method, genetic algorithm, differential evolution, grey-relational analysis and PSO in end milling operations [11–18]. In addition, researchers have noted the significant advantages in combining models. These advantages have been explored in developing integrated models, including desirability function and response surface method [9], Taguchi and principal component analysis [19], ANN and genetic algorithm [20], utility concept and Taguchi method [21]. However, previous works have not explored the potentials of combining ANN and BB-BC. Also, the union of ANN and PSO has not been fully understood and there is need to compare results of these outcomes.
The remaining sections of this study are arranged as follows: In section 2, review of end milling process is presented while the methodology describes the sequence and the coupled algorithm mechanism for the different integration models of ANN/BB-BC and ANN/PSO in section 3. In section 4, the treatment of data, which include includes training, testing and optimisation of surface roughness and tool wear are presented. Furthermore, case study applications and discussion of results are presented in this section. Section 5 contains conclusions of this study.
2.
Literature Review
Milling has received considerable attention [11, 18, 20, 22] in literature due to the unique problems it solves in view of the limitations of other machining approaches such as cutting, grinding and drilling. For example, steel and super-alloys are difficult-to-cut materials [10, 12, 20] that cannot be processed through the cutting process. The cutting process is also limited in its inability to process complex geometries of workpieces, but end milling could be successfully used for this machining process [21]. Worse still, cutting could not be used for materials with narrow tolerances. Thus, the inability of the cutting process to achieve these critical tasks and more, including similar limitations of other machining processes (i.e. drilling and grinding) place milling at advantage over other machining approaches. Drilling and grinding are also limited. Milling has therefore experienced unprecedented research interests in recent times [9, 17, 23, 24].
In the milling process, the face and end milling are the two commonly used variants worldwide. End milling as a study interest in this paper is guided by the high frequency of geometrically-complex materials to be processed [9] requiring specialised attention. End milling is widely used in the machining industry, including automobile and aerospace sectors [15, 17] for economic and productivity benefits. It guarantees good surface finishing ability, high product integrity and has been of much practical and academic interest [10, 15, 19]. With a strong demand for smaller tolerance limits, the need for optimisation of process parameters with respect to surface finishing of materials in end milling becomes confirmed.
In this work, the interest is to predict and optimise the machining performance indicators in end milling process based on process parameters. The literature approach to reducing manufacturing time has been through the minimisation of product reworks while cost and product quality improvements have been
tackled with the use of surface quality parameters. Literature sources, including Para et al. [14], Chen et al.
[18], Kadirgama et al. [20], Parmar and Makwara [25] and Kalidass et al. [26] largely promote these ideas of
time and cost minimisation as well as surface finishing optimisation with the control of specified process parameters.
Although, an increase in the applications of ANN has been observed in the modelling of milling operations, applications of ANN to end milling process is still poor; more investigations are need in this regard, especially on the integration of ANN models and optimisation models [17]. The attraction to the use of ANN for end milling process prediction is based on the excellent literature documented performance of ANN, ANN has been found to have its ability to perform well in complex production situations, it has a superior information processing behaviour, a non-linear nature substantial parallelism tendency, capacity for learning, tolerance for noise and generalised [27]. A strong limitation of the existing literature on surface finish and tool wear is the paucity of studies that emphasis predictability of processes parameters during the end milling process. While this work advocates the need to optimise the process
parameters of end milling as pointed out by Theja et al. [17], it is argued that process controllers in end
Although attempts were made by Prajina [9] and Lakshmi and Subbaiah [10], the current work extends the literature and contributes in a unique way by deviating from the literature and utilising a new algorithm (BB-BC) to expand the continually swelling literature on machining, particularly end milling. The contribution of this paper, besides optimisation, converts the crisp values of surface finishing and tool wear into linguistic terms that could be used in optimisation in easily understandable manner to the process controllers. A main contribution of the current work is the novel application of BB-BC algorithm, an optimiser of proven utility in good solution quality and convergence characteristics. Thus, the objective of the current study is to develop mathematical models which consider the issue of cost (tool wear) and product quality (surface roughness) prediction and optimisation using fuzzy goal programming, BB-BC and PSO as modelling tools.
In end milling literature, several authors have explored the use of predictive and optimisation models in studying the characteristics of machine parameters on the quality of end-product from milling operation. The current study recognised the contributions of these studies to end milling knowledge, yet extending the state-of-the-art on milling operation to ANN as well as BB-BC and PSO is an investigation that will further end milling study.
Bernards and Vosniakos [22] report a study that classified criteria which can be used in surface roughness study as workpiece (diameter, length and hardness), cutting tool properties (material, run out errors, noise radius, and shape), machining parameters (process kinematics, cooling fluid, step over, depth of cut, tool angle, feed rate and cutting speed) and cutting phenomena (cutting force, vibration, friction in the cutting zone, chip formation and acceleration). Parmar and Makwara [24] consider spindle speed, depth-of-cut and feed rate in proposing an ANN model for mild steel surface roughness prediction during end milling operation and it is reported that their proposed prediction approach generates acceptable prediction errors.
3.
Research Methodology
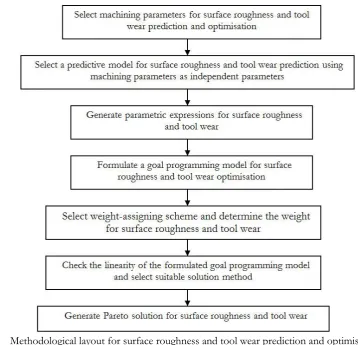
The procedure that are utilised in generating various mathematical expressions for surface roughness and tool wear prediction and optimisation is presented in Fig. 1. The nomenclature used in the current study is listed as follows. However, additional nomenclature is introduced in the body with the meanings specified at the points of introduction.
1
f Predicted value of tool wear (mm)
2
f Predicted value of surface roughness (μm)
f1 Optimal value of tool wear (mm)
f2 Optimal value of surface roughness (μm)
Fig. 1. Methodological layout for surface roughness and tool wear prediction and optimisation.
3.1. ANN Model for End Milling Process Parameter Prediction
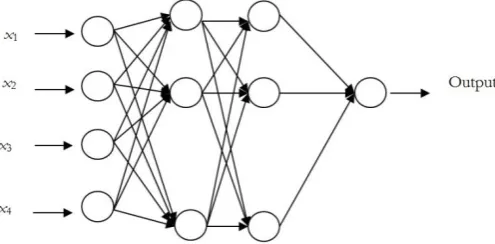
In this study, ANN is selected as a predictive model for surface roughness and tool wear during end milling operation starting from the input layers to the output layers. The implementation of ANN model may involve the following steps: determination of input and output parameters, selection of ANN architecture, selection of training algorithm, dividing of the datasets, training of the ANN model, testing of a developed ANN model and drawing of inference. The training of an ANN model involves adjusting the connecting weights between two adjacent layers. One common ways of weight adjustments is through the propagation of prediction error(s) back into a network (i.e. back propagation). This can be achieved using algorithms like gradient descent and Levenberg Maquardt during the training of ANN architectures. In this study, gradient descent is used as the training algorithm. After training the ANN architecture, the next process involves testing the trained ANN architecture. A two-hidden layer ANN architecture is selected (See Fig. 2) in carrying out the current investigations on ANN suitability for surface roughness and tool wear during end milling operations. The process of drawing of inferences from the performance of a developed ANN model is often based on statistical measures which compare actual and predicted values. Among the
commonly used statistical measures in ANN literature are mean square error (MSE), absolute fraction of
variance (R2) and mean absolute percentage error (MAPE). The mathematical definitions for MSE, R2 and
MAPE are given as Eq. (1) to (3), respectively [27].
2 1
1
( )
P
i i i
MSE E f
p
2 1
1
( )
1
P
i i i
P i i
E f
R
f
(2)1
1 1
P
i i i
P i i
E f
MAPE P
E
(3) [image:6.595.183.431.238.360.2]where Eiand fi are experimental and predicted values of pattern i.
Fig. 2. A 2-hidden layer ANN architecture for machining parameter predictions.
The decision on selecting a two-hidden layer ANN model is to reduce the problem of too many free parameters in the model. This will help in the reduction of poor generalisation of the trained model [28, 29]. Furthermore, ANN model may suffer the problem of learning during training process when there are few hidden. This problem may be experienced when using a single hidden layer network [30].
3.2. Optimisation Model
We deviate from the literature approach of using crisp value in formulating optimisation model for end milling parameters optimisation by introducing a fuzzy logic approach. The membership function for surface roughness and tool wear are obtained using logistic membership function (Eq. (4)). One reason for selecting logistic membership function over other membership functions (e.g. trapezoidal and triangular) is the problem of determining boundaries for membership functions.
( ) 1
1 j
j f x
e
(4)
where, f xi( ) is optimal value of objective i and i is membership function of objective i and is a
constant factor which is taken as 1 in this study.
The values for the various f xi( ) are estimated using Eq. (5). It may be noted that since the output
from an ANN model is usually normalised, it is possible to use predicted values from a trained ANN model
directly as f xi( ). The current study uses the outputs from the ANN model as normalised values for the
various objectives.
min,
max, min,
( )
( ) i i
i
i i
p x f
f x
f f
(5)
where, fmin,i and fmax,i are the minimum and maximum values of objective i, p xi( )is the expression for
objective function i.
1
n j j j
Max Z w
(6)min,
j j
(7)
where, min,iis minimum membership function for objective function i
The optimal value for surface roughness and tool wear are restrained using minimum and maximum values for spindle speed, feed rate, depth of cut and silicon carbide as given in Eq. (8)
min,i i max,i
x x x ,i (8)
The summary of the proposed fuzzy goal programming optimisation model is expressed as follows:
1
N j j j
Max Z w
( ) 1
1 j
j f x
e
, j
min,i i max,i
x x x , i
min,
j j
, j
0
i
x , i
where,
1 1
N j j
w
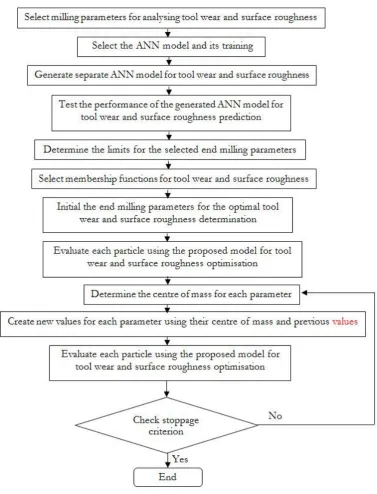
The proposed optimisation model for the optimal surface roughness and tool wear rate determination is solved using the PSO and BB-BC algorithms as solution methods. BB-BC algorithm was developed by Kripka and Kripka [31] and satisfactorily employed in different reported studies [31–35]. The implementation of BB-BC algorithm is in two phases. The first phase, the big-crunch phase, involves the centre of mass of each decision variable in an optimisation model, determined via the current value of
decision variables (xi) and their associated fitness function (fi) as given using Eq. (9). The second phase
involves the generation of new values for each decision variable using t c,
i
x and the differences between
bounds of each decision variable. The quality of each new particle is controlled by using a constant value
(α), an iteration step (t) and random variables (R) with values between (-1, 1). The formula for creating the
new t c,
i
x is given by Eq. (10). Also, consideration is given to the limit of parameters. The flowchart for the
Fig. 3. Flowchart for ANN-cum-BB-BC integration for end milling parameters prediction and optimisation.
, 1 , 1
, 1
, 1 1
1
P
i g i t t c i
i P
i t i
x f
x
f
(9)
,max ,min
, ,
i i
t c i t i
x x
x x R
t
(10)
where, t c,
i
x is the centre of mass for parameter i at iteration step t, fi t, is the quality of particle i at iteration
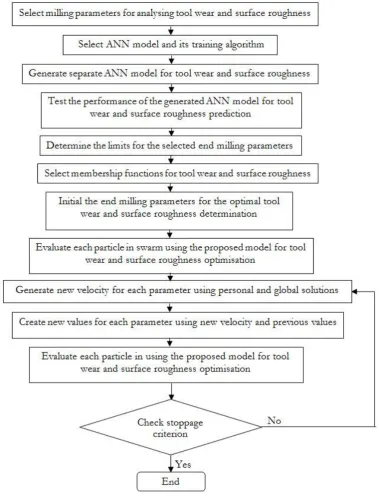
[image:8.595.118.496.85.580.2]In PSO algorithm, the values of decision variables are tuned using personal best solution ( lbest ij
x ), global
best solution ( gbest
ij
x ), current value of decision variable (xtij) and updated value of each particle velocity (vtij
). The formula for updating velocity and position of each particle in a swarm are given by Eq. (11) and (12), respectively [38]. The flowchart for PSO is presented in Fig. 3.
1 1 1
1 1 ( ) 2 2 ( )
t t lbest t gbest t
ij ij j ij ij j ij ij
v v c r x x c r x x (11)
1
t t t ij ij ij
x v x (12)
where, α is known as the weight, c1 and c2 are constants, and r1 and r2 are uniform random numbers
[image:9.595.123.503.231.731.2]between (0,1). The integrated structure for ANN [36, 37]and PSO [38, 39] is in Fig. 4.
Fig. 4. Flowchart for ANN-cum-PSO integration for end milling parameters prediction and
4.
Model Application and Discussion of Results
To demonstrate the applicability of the proposed predictive and optimisation models two examples, are presented using literature data. We consider the case of two objectives (i.e. surface roughness and tool wear), where these objectives are optimised concurrently. In this study, the procedure used in assigning of weight to each objective is based on dynamic weighted aggregation approach, as presented in Eq. (13) and (14). This weight scheme involves the adjustment of weights at each iteration step [38]. This approach of weights assignment addressed the problem of mixing solutions in concave areas in a Pareto front which is associated with conventional weight aggregation approach [40]. During the implementation of the HSA, the
values of harmony memory accepting and pitch adjusting rate are taken as 0.75 and 0.3, respectively [41].
1( ) sin 2
w t t a (13)
2( ) 1 1( )
w t w t (14)
where, w1 and w2 are the weight for objective 1(surface roughness) and objective 2 (tool wear),
respectively. a is known as adaptation frequency, it is user defined and t is iteration step.
The maximum epoch of the ANN architectures is used as stoppage criterion. We do not conduct an extensive investigation on the optimal number of hidden layers nodes, but take cognizance of the number of nodes in each hidden layer that will generate acceptable prediction error limits. The aim of developing the ANN architectures is to generate equations for determining surface roughness and tool wear. The training algorithm for the ANN models is back propagation, while sigmoid function is used a transfer function. During training of the ANN models, the growing of number of nodes in each of the hidden
layers and varying the total number of epoch methods are used in the selection of a suitable ANN model.
The determination of the solution boundaries (B), that is the minimum and maximum bounds is made, statistically. The solutions for each of the examples presented were monitored for 30 times using each of the solution methods considered. In this paper, a comparative analysis of the optimisers is made as meta-heuristics for solving the end milling problem. Scientifically speaking, meta-meta-heuristics cannot find the same solution when performing many runs due to the fact that randomisation is used in their procedures. As such, it makes sense to run the programmes for the computational problems for a large population. With this, reliable conclusions could be made. In statistics, large samples start from when sample number is at least 30. This information is used to guide our decision making on the comparison study embarked.
Equation (15) is utilised in computing the minimum and maximum bounds for the solutions using the
different optimisers [38]. In this study, taken as 1 % for the examples considered.
,n1
B t (15)
2
1 1
n i i
V V
n n
(16)
where, and are average and standard deviations of solutions generated from using an optimiser,
confidence interval.
Example 1: This example consider surface roughness and tool wear prediction and optimisation using
spindle speed, depth-of-cut, feed rate and silicon carbide as input parameters. Datasets from Arokiadass et
al. [16] is used to demonstrate the applicability of the proposed model. The parametric settings for the
predictive model and the solution methods (BB-BC and PSO) for the optimisation model are presented in
Table 1. Based on the datasets obtained from Arokiadass et al. [16] study, the minimum and maximum
Table 1. Parametric settings for predictive and optimisation models.
Predictive model Optimisation model
Parameter roughness Surface Tool wear Parameter BB-BC PSO
No. of inputs 4 4 No. of generations 100 100
No. of output 1 1 No. of particles 30 30
Performance (Mean square error) 1 x 10⁻³ 1 x 10⁻³ Α 0.01 -
No. of hidden layers 2 2 C1 - 1.5
No. of epochs 2000 2000 C2 - 1.5
No. of neurons in hidden layer 8-7 8-7
[image:11.595.72.499.258.515.2]The training results using the selected ANN architecture (4-8-7-1) at the maximum epoch are presented in Figs. 5 and 6, while the plot during testing of the developed ANN model are depicted in Figs. 7 and 8.
Fig. 5. Plot for surface roughness using normalised
[image:11.595.60.499.405.490.2]training datasets. Fig. 6. Plot for tool wear using normalised training datasets.
Fig. 7. Plot for surface roughness using normalised
testing datasets. Fig. 8. Plot for tool wear using normalised testing datasets.
From Table 2, the value of R2 during the training of the selected ANN architecture is high. Using the
developed ANN model expressions for surface roughness and tool wear, we proceed to determine the optimal values for CNC HASS vertical milling machine using uncoated solid carbide as cutters and LM 25Al/SiCp metal matrix composite (100 x 50 x 40 mm) as workpiece based on the parametric settings in
Table 1. The minimum values for λ1 and λ2 are determined based on the membership functions (logistic
function) for the minimum experimental values for tool wear and surface roughness that are report by
Arokiadass et al. [16], respectively. The results obtained from the two solution methods are shown in Table
[image:11.595.63.533.661.738.2]3.
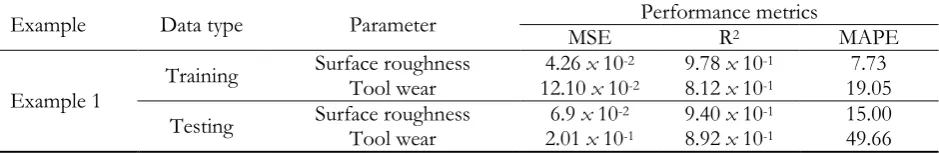
Table 2: Measure of prediction performance for example 1.
Example Data type Parameter MSE Performance metrics R2 MAPE
Example 1 Training
Surface roughness 4.26 x 10⁻² 9.78 x 10⁻¹ 7.73
Tool wear 12.10 x 10⁻² 8.12 x 10⁻¹ 19.05
Testing Surface roughness Tool wear 2.016.9 x x 10 10-2-1 9.40 8.92 x x 1010-1-1 15.00 49.66
0 0.1 0.2 0.3 0.4 0.5 0.6 0.7 0.8 0.9 1
1 2 3 4 5 6 7 8 9 10 11 12 13 14 15 16 17 18 19 20 21 22 23 24 25 Experiment number S urf ac e rou gh ne ss ( μm ) Experimental value
Predicted value 0 0.1 0.2 0.3 0.4 0.5 0.6 0.7 0.8 0.9 1
1 2 3 4 5 6 7 8 9 10 11 12 13 14 15 16 17 18 19 20 21 22 23 24 25
Experiment number To ol w e a r (m m ) Experimental value Predicted value 0 0.1 0.2 0.3 0.4 0.5 0.6 0.7 0.8 0.9
1 2 3 4 5 6
Experiment number S urf ac e rou gh ne ss ( μm ) Experimental value Predicted value 0 0.1 0.2 0.3 0.4 0.5 0.6 0.7 0.8 0.9
1 2 3 4 5 6
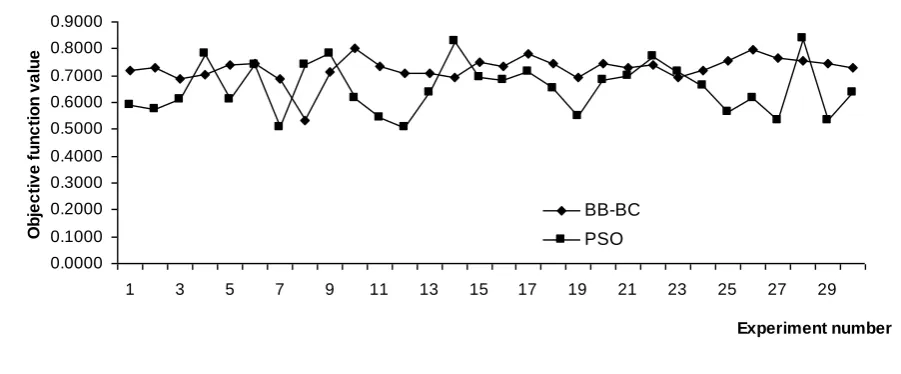
By using the developed ANN model as a surrogate for generating the expressions for example 1 surface roughness and tool wear, we solved the formulated model for 30 different runs and the trend of the solutions obtained for the objective function is presented in Fig. 9.
Fig. 9. Values of the objective function for example 1 at different runs.
The summary of the BB-BC and PSO performance as solution methods for the proposed model are presented in Table 3. At a Pareto value of 0.45 for example 1 objective function, the parametric setting of the decision variables are shown in Table 4.
Table 3. Summary of optimisers performance for example 2.
Methods BB-BC PSO
Best 0.7996 0.8384
Worst 0.5335 0.5067
Average 0.7264 0.6536
Limits 0.6671 - 0.7856 0.5907 - 0.7165
Table 4. Optimal values for end milling parameters for example 1
Parameter BB-BC results
Surface roughness (μm) 0.38
Tool wear (mm) 6.00
Spindle speed (rev/min) 3357
Feed rate (mm/min) 0.06
Depth-of-cut (mm) 1.91
Silicon carbide (% wt) 19.00
λ1 0.7314
λ2 0.7923
Example 2: The performance of the proposed model is verified using three input parameters (cutting tool hardness, cutting speed and feed rate) in predicting and optimising surface roughness and tool flank wear are considered. Table 4 presents the parametric settings for the ANN and the optimisation models, while data used from Kivak [42] work is used in studying example 2. In this example, 15 and 3 data are used in training and testing of the ANN models. The small size of the data necessitated the need to training the ANN models for longer periods. During the training of the ANN models used in this example, 15 and 3 are used as the training and the testing datasets, respectively. The parametric settings for the ANN models and solution methods are presented in Table 5.
0.0000 0.1000 0.2000 0.3000 0.4000 0.5000 0.6000 0.7000 0.8000 0.9000
1 3 5 7 9 11 13 15 17 19 21 23 25 27 29
Experiment number
O
b
je
c
ti
v
e
fu
n
c
ti
o
n
v
a
lu
e
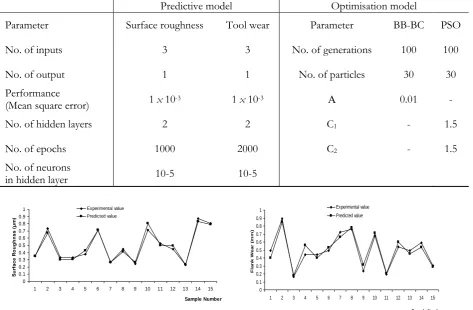
Table 5. Parametric settings for predictive and optimisation models.
Predictive model Optimisation model
Parameter Surface roughness Tool wear Parameter BB-BC PSO
No. of inputs 3 3 No. of generations 100 100
No. of output 1 1 No. of particles 30 30
Performance
(Mean square error) 1 x 10⁻³ 1 x 10⁻³ Α 0.01 -
No. of hidden layers 2 2 C1 - 1.5
No. of epochs 1000 2000 C2 - 1.5
No. of neurons
[image:13.595.65.536.93.405.2]in hidden layer 10-5 10-5
Fig. 10. Plot for surface roughness using normalised
training datasets. Fig. 11. Plot for flank wear using normalised training datasets.
Fig. 12. Plot for surface roughness using
normalised training datasets. Fig. 13. Plot for flank wear using normalised training datasets.
[image:13.595.75.507.453.589.2]From Table 5, the results from the selected ANN architectures showed that the ANN models performed satisfactorily. Using these developed ANN models, the determination of optimal surface roughness and tool flank wear during milling of Hadfield steel block (100 x 50 x 14 mm) at a constant depth-of-cut (0.5 mm) is carried out and the results obtained are reported in Table 6.
Table 6. Measure of prediction performance for example 2.
Parameter MSE Performance metrics R MAPE
Training Surface roughness Tool wear 3.91 5.60 xx 10 10-2-2 9.83 9.63 xx 10 10-1-1 1.09 6.06 xx 10 10-2-1
Testing Surface roughness Flank wear 8.041.02 x x 10 10-2-1 9.48 9.94 x x 1010-1-1 1.89 1.43 xx 10 10-1-1
0 0.1 0.2 0.3 0.4 0.5 0.6 0.7 0.8 0.9 1
1 2 3 4 5 6 7 8 9 10 11 12 13 14 15 Sample Number S u rf a c e R o u g h n s s ( μ m ) Experimental value Predicted value 0 0.1 0.2 0.3 0.4 0.5 0.6 0.7 0.8 0.9 1
1 2 3 4 5 6 7 8 9 10 11 12 13 14 15 Sample Number Fl a nk W e a r ( m m ) Experimental value Predicted value 0 0.1 0.2 0.3 0.4 0.5 0.6 0.7 0.8
1 2 3
Sample Number S urf a c e R ou gh ne s s ( μm ) Experimental value Predicted value 0 0.1 0.2 0.3 0.4 0.5 0.6 0.7 0.8
1 2 3
[image:13.595.72.518.680.755.2]Fig. 14. Values of the objective function for example 2 at different runs.
[image:14.595.183.395.348.414.2]Based on the information presented in the figure, the performances of the optimisers are summarised statistical in Table 7.
Table 7. Summary of optimisers performance for example 2.
Methods BB-BC PSO
Best 0.8870 0.8637
Worst 0.7041 0.5022
Average 0.7491 0.6217
Limits 0.7259 - 0.7724 0.5449 - 0.6986
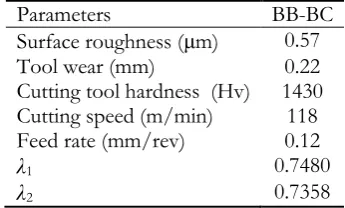
Using the BB-BC algorithm, at Pareto value of 0.7474 for the objective function for example 2, the following parametric settings in Table 8 was obtained.
Table 8. Optimal values for end milling parameters for example 2.
Parameters BB-BC
Surface roughness (μm) 0.57
Tool wear (mm) 0.22
Cutting tool hardness (Hv) 1430
Cutting speed (m/min) 118
Feed rate (mm/rev) 0.12
λ1 0.7480
λ2 0.7358
5.
Conclusions
This study has presented a novel approach of determining optimal values of machining performance by implementing ANN as a surrogate model for generating expressions for surface roughness and tool wear. BB-BC and PSO algorithms are considered as solution methods for solving the non-linear optimisation model presented. Based on the results obtained, the BB-BB has good convergence characteristics when compared with the PSO performance. As a departure from literature, a blend of ANN and the BB-BC on one side, and of the PSO on the other side produced stronger predictive and optimisation models. The results obtained from the ANN models that are trained with gradient method shows that surface roughness and tool wear for LM 25Al/SiCp metal matrix composite can be predicted with the proposed ANN. Based on the prediction results, it can be conclude that the proposed ANN models perform satisfactorily, this conclusion is arrived at when we compared the performance of our proposed ANN models with the ANN
models developed for material removal rate and tool wear by Theja et al. [17] and Kivak [42]. The results
obtained from BB-BC and PSO showed that these algorithms have the capacity to generate optimal values
0 0.1 0.2 0.3 0.4 0.5 0.6 0.7 0.8 0.9 1
1 3 5 7 9 11 13 15 17 19 21 23 25 27 29
Experiment number
O
b
je
c
ti
v
e
f
u
n
c
ti
o
n
v
a
lu
e
[image:14.595.210.383.475.579.2]for end milling process parameters. However, the BB-BC algorithm performs better than the PSO algorithm considers in the current study, this conclusion is based on the current dataset used in this study.
The use of BB-BC algorithm as optimisation algorithm for optimal material removal rate and tool wear can be considered as an area of further study. The use of other training algorithms like Levenberg Maquardt can replace gradient descent used in the current paper and results compared. This will help in the selection of training algorithm that will generate a minimum error between predicted values. Also, the issue of outliners should be taken care of before using the expression generated for surface roughness and tool wear. Furthermore, the proposed bi-objective model can be applied in optimising other end milling parameters like material removal rates and tool wear. Future work could consider the application of the proposed approach using information in [43–45]. During application of the proposed, we recommend that more dataset should be used in training a selected predictive model in generating the equations for the surface roughness and tool wear objective functions. This will improve the generalisation power of a trained ANN model. Also, we encourage the use of different number of hidden layers ANN. This will minimise the problem of poor fitting of input-output patterns [30]. Finally an application can be developed that will selection the best predictive model for a particular material surface roughness and tool wear. Model like ANN, support vector machine, polynomial function, radial-basis function, Kriging model can be considered. The selection of the best model should be based on at least 30 different runs for each of the predictive model that will be considered. The input parameters for the two examples in this study were obtained directly from machining literature. However, when applying the proposed model, principal component analysis can be used in reducing the number of input parameters to be used in study machining outputs.
Acknowledgements
The authors would like to thank the editor and anonymous reviewers for their helpful comments and suggestions in improving the quality and clarity of this article.
References
[1] L. Xu, J. K. Schueller, and J. Tlusty, “End milling system compliance and machining error,” Machining
Science and Technology, vol. 2, no. 1, pp. 41–56, 1998.
[2] E. J. A. Armarego, D. C. Kang, S. Verezub, and D. L. Wang, “The geometry, specification and
predictive force models for plane faced ball-end milling cutters and operations,” Machining Science and
Technology, vol. 6, no. 3, pp. 437–466, 2002.
[3] E. Ozturk and E. Budak, “Modelling of 5-axis milling process,” Machining Science and Technology, vol. 11,
no. 3, pp. 287–311, 2007
[4] A. M. Zain, H. Haron, and S. Sharif, “Simulated annealing to estimate the optimal cutting conditions
for minimizing surface roughness in end milling Ti-6Al-4V,” Machining Science and Technology, vol. 14,
no. 1, pp. 43–62, 2010.
[5] B. Li, Y. Hu, X. Wang, C. Li, and X. Li. “An analytical model for oblique cutting with application to
end milling.” Machining Science and Technology, vol. 15, no. 4, pp. 453–484, 2011.
[6] X. Cai, S. Qin, J. Li, Q. An, and M. Chen. “Experimental investigation on surface integrity of end
milling nickel-based alloy-inconel 78,” Machining Science and Technology, vol. 18, no. 1, pp. 31–46, 2014.
[7] X. Fan and M. Loftus, “A simplified cutting force model light-cut ball-end milling applications,”
Machining Science and Technology, vol. 13, no. 1, pp. 52–75, 2009.
[8] J. Dhupia and I. Girsang, “Correlation-based estimation of cutting force coefficients for ball-end
milling,” Machining Science and Technology, vol. 16, no. 2, pp. 287–303, 2012.
[9] N. V. Prajina, “Multi-response optimisation of CNC end milling using response surface methodology
and desirability function,” International Journal of Engineering Research and Technology, vol. 6, no. 6, pp.
739–746, 2013.
[10] V. V. K. Lakshmi and K. V. Subbaiah, “Modelling and optimisation of process parameters during end
milling of hardened steel,” International Journal of Engineering Research and Applications, vol. 2, no. 2, pp.
674–679, 2012.
[11] F. Cus, U. Zuperi, and V. Gecevska, “High speed end-milling optimisation using particle swarm
intelligence,” Journal of Achievement in Materials and Manufacturing Engineering, vol. 22, no. 2, pp. 75–78,
[12] T. L. Ginta, A. K. M. N. Amin, H. C. D. M. Radzi, and M. A. Lajis, “Development of surface roughness models in end milling Titanium alloy Ti-6AL-4V using uncoated Tungsten carbide inserts,”
European Journal of Scientific Research, vol. 28, no. 4, pp. 542–551, 2009.
[13] A. R. Yusoff and N. D. Sims, “Optimisation of variable helix end milling tools by minimising
self-excited vibration,” in 7th International Conference on Modern Practice in Stress and Vibration Analysis, 2009.
[14] V. Para, G. Agnihotri, and C. M. Krishna, “Optimisation of cutting in end milling process with the
approach of particle swarm optimisation,” International Journal of Mechanical and Industrial Engineering, vol.
1, no. 2, pp. 21–25, 2011.
[15] B. S. Reddy, J. S. Kumar, and K. V. K. Reddy, “Optimisation of surface roughness in CNC end
milling using response surface methodology and genetic algorithm,” International Journal of Engineering,
Science and Technology, vol. 3, no. 8, pp. 102–109, 2011.
[16] R. Arokiadass, K. Palaniradja, and N. Alagumoorthi, “Bi-performance optimisation of end milling
characteristics of Al/SiC composites using NSGA-II,” International Journal of Applied Science and
Engineering, vol. 11, no. 3, pp. 251–266, 2013.
[17] K. D. Theja, G. H. Gowd, and S. Kareemulla, “Prediction and optimisation of end milling process
parameters using artificial neural network,” International Journal of Emerging Technology and Advanced
Engineering, vol. 3, no. 9, pp. 117–122, 2013.
[18] C.-H. Chen, Y.-C. Wang, and B. Y. Lee, “The effect of surface roughness of end-mills on optimal
cutting performance for high-speed machining,” Journal of Mechanical Engineering, vol. 59, no. 2, pp.
124–134, 2013.
[19] S. Moshat, S. Datta, A. Bandyopadhyay, and P. K. Pal, “Optimisation of CNC end milling process
parameters using PCA-based Taguchi method,” International Journal of Engineering, Science and Technology,
vol. 2, no. 1, pp. 92–102, 2010.
[20] K. Kadirgama, M. M. Noor, N. M. Zuki, M. M. Rahman, M. R. M. Rejab, K. A. Daud, and K. A.
Abou-El-Hossein, “Optimisation of surface roughness in end milling on mould aluminum alloys (AA
6061-T6) using response surface method and radial basis function network,” Jordan Journal of Mechanical
and Industrial Engineering, vol. 2, no. 4, pp. 209–214, 2008.
[21] B. C. Routara, S. D. Mohanty, S. Datta, A. Bandyopadhyay, and S. S. Mahapatra, “Optimisation of
CNC end milling of UNS C34000 medium leaded brass with multiple surface roughness
characteristics,” Sadhana, vol. 35, no. 5, pp. 619–629, 2010.
[22] P. G. Bernards and G. C. Vosniakos, “Predicting surface roughness in machining: A review,”
International Journal of Machine Tool Manufacturing, vol. 43, pp. 833–844, 2003.
[23] B. C. Routara, A. Bandyopadhyay, and P. Sahoo, “Roughness modelling and optimisation in CNC end
milling using response surface method: effect of workforce material variation,” International Journal of
Manufacturing Technology, vol. 40, pp. 1166–1180, 2009.
[24] R. Arokiadass, K. Palaniradja, and N. Alagumoorthi. “A study on tool wear and surface roughness in
end milling of particulate aluminum metal matrix composite: Application of response surface
methodology.” Journal of Computational and Applied Research in Mechanical Engineering, vol. 2, no. 1, pp. 1–
12, 2012.
[25] G. Parmer and A. Makwana. “Prediction of surface roughness of end milling process using artificial
neural network.” International Journal of Modern Engineering Research, vol. 2, no. 3, pp. 1006–1013, 2012.
[26] S. Kalidass, P. Palanisamy, and V. Muthukumaran, “Prediction an optimisation of tool wear for end
milling operation using artificial neural network and simulated annealing algorithm,” International
Journal of Machining and Machinability of Materials, vol. 14, no. 2, pp. 142–164, 2013.
[27] M. Madic and M. Radovanovi, “Methodology of developing optimal BP-ANN model for the
prediction of cutting force in turning using early stopping method,” Facta Universitatis Series: Mechanical
Engineering, vol. 9, no. 1, pp. 21–32, 2011.
[28] H. H. Thodberg, “Improving generalisation of neural networks through pruning,” International Journal
of Neural Systems, vol. 1, no. 4, pp. 317–326, 1991.
[29] J. Sietsma and R. J. F. Dow, “Artificial neural networks that generalise,” Neural Networks, vol. 4, pp.
67–79, 1991.
[30] G. Zhang, B. E. Patuwo, and M. Y. Hu. “Forecasting with artificial neural networks: The
state-of-the-art,” International Journal of Forecasting, vol. 14, pp. 35–62, 1998.
[31] M. Kripka and R. M. L. Kripka, “Big crunch optimisation method,” in Proceedings of the International
[32] T. Kumbasar, , E. Yesil, and I. Eksin, “Inverse fuzzy model control with online adaptation via
big-bang big-crunch optimisation,” in Proceedings of the Third International Symposium on Communication, Control
and Signal Processing, Malta, January, 2008.
[33] H. Tang, J. Zhou, S. Xue, and L. Xie, “Big-bang big-crunch optimisation for parameter estimation in
structural systems,” Mechanical Systems and Signal Processing, vol. 24, pp. 2888–2897, 2010.
[34] H. K. Verma and Y. Manekar, “Big-bang big-crunch optimisation for determination of worst case
loading margin,” International Journal of Engineering Research and Applications, vol. 2, no. 4, pp. 421–426,
2012.
[35] S. Sakthivel, S. A. Pandiyan, S. Marikani, and S. K. Selvi, “Application of big-bang big-crunch
algorithm for optimal power flow problems,” The International Journal of Engineering and Science, vol. 2,
no. 4, pp. 41–47, 2013.
[36] I. Kaastra and M. Boyd, “Designing a neural network for forecasting financial and economic time
series,” Neurocomputing, vol. 10, pp. 215–236, 2006.
[37] A. Krenker, J. Bester, and A. Kos, “Introduction to the artificial neural networks,” in Artificial Neural
Networks: Methodological Advances and Biomedical Applications, K. Suzuki, Ed. Croatia: InTech, pp. 3–18, 2011.
[38] A.P. Engelbrecht. Artificial Intelligence: An Introduction, John Wiley, England.
[39] J. Kennedy and R. Eberhart, “Particle swarm optimisation,” in Proceedings of the Fourth IEEE
International Conference on Neural Networks, Perth, Australia. IEEE Service Center, 1995, pp. 1942–1948.
[40] Y. Jin, M. Olhofer, and B. Sendhoff, “Evolutionary dynamic weighted aggregation for multi-objective
optimisation: Why does it work and how?” in Proceedings of the GECCO 2001 Conference, San Francisco,
CA, 2001, pp. 1042–1049.
[41] X.-S. Yang, “Harmony search as a metaheuristic algorithm,” in Music-Inspired Harmony Search Algorithm: Theory and
Applications, Z. W. Geem, Ed. Berlin: Springer, vol. 191, pp. 1–14, 2009.
[42] T. Kivak, Optimisation of surface roughness and flank wear using the Taguchi method in milling of
Hadfield steel with PVD and CVD coated inserts. Measurement, vol. 50, pp. 19–28, 2014.
[43] M. Sayuti, A. A. D. Sarhan, and F. Salem. “Novel uses of SiO2 nano-lubrication system in hard turning
process of hardened steel AISI4140 for less tool wear, surface roughness and oil consumption,”
Journal of Cleaner Production, vol. 67, pp. 265–276, 2014.
[44] R. Sreenivasulu and C.S. Rao. “Application of gray relational analysis for surface roughness and
roundness error in drilling of Al 6061 alloy,” International Journal of Lean Thinking, vol. 3, no. 2, pp. 66–
78, 2012.