White Rose Research Online URL for this paper:
http://eprints.whiterose.ac.uk/85515/
Version: Accepted Version
Article:
Al-Sunna, R., Pilakoutas, K., Hajirasouliha, I. et al. (1 more author) (2012) Deflection
behaviour of FRP reinforced concrete beams and slabs: An experimental investigation.
Composites Part B: Engineering, 43 (5). 2125 - 2134. ISSN 1359-8368
https://doi.org/10.1016/j.compositesb.2012.03.007
eprints@whiterose.ac.uk https://eprints.whiterose.ac.uk/ Reuse
Unless indicated otherwise, fulltext items are protected by copyright with all rights reserved. The copyright exception in section 29 of the Copyright, Designs and Patents Act 1988 allows the making of a single copy solely for the purpose of non-commercial research or private study within the limits of fair dealing. The publisher or other rights-holder may allow further reproduction and re-use of this version - refer to the White Rose Research Online record for this item. Where records identify the publisher as the copyright holder, users can verify any specific terms of use on the publisher’s website.
Takedown
If you consider content in White Rose Research Online to be in breach of UK law, please notify us by
Deflection Behaviour of FRP Reinforced Concrete Beams and Slabs:
An Experimental Investigation
Raed Al-Sunna
a, Kypros Pilakoutas
a, Iman Hajirasouliha
b*,
Maurizio Guadagnini
aa
Department of Civil & Structural Engineering, The University of Sheffield, Sheffield, UK
b
Department of Civil Engineering, The University of Nottingham, Nottingham, UK
*
Corresponding author, e-mail: i.hajirasouliha@nottingham.ac.uk
ABSTRACT
The flexural response of FRP RC elements is investigated through load-deflection tests on 24 RC beams
and slabs with glass FRP (GFRP) and carbon FRP (CFRP) reinforcement covering a wide range of
reinforcement ratios. Rebar and concrete strains around a crack inducer are used to establish
moment-curvature relationships and evaluate the shear and flexural components of mid-span deflections. It is
concluded that the contribution of shear and bond induced deformations can be of major significance in
FRP RC elements having moderate to high reinforcement ratios. Existing equations to calculate
short-term deflection of FRP RC elements are discussed and compared to experimental values.
Keywords: A. Carbon fibre; A. Glass fibre; C. Analytical modelling; D. Mechanical testing; Deformation behaviour.
1- Introduction
FRP reinforcement for concrete has been developed to replace steel in special applications,
particularly in corrosion-prone RC structures. Under similar conditions, in terms of concrete strength,
applied loading, member dimensions and area of reinforcement, FRP RC members are expected to
develop larger deformations than steel reinforced members [1]. This can be mainly attributed to the lower
modulus of elasticity of the FRP rebars, but also to their unique bond characteristics. As a result, the
design of FRP RC elements is often governed by the serviceability limit state [2]. Accurate calculation of
service deflections can be done through integration of curvatures [3, 4] and making allowance for shear
and bond deformations. However, such calculations are time consuming and not suitable for design. It is
therefore important to develop simplified design methods to evaluate the deflection of RC elements with
effective moment of inertia to describe the reduced stiffness of a cracked element, has proven effective in
determining service deflections of steel reinforced concrete elements and has also been adopted for FRP
reinforced concrete elements. ACI 440.1R-06 [5], for example, has adopted a modified form of the
effective moment of inertia equation included in ACI 318 [6] and originally developed by Branson [7].
Although a similar model is also discussed in the design manual published by ISIS Canada [8], the use of
an equation derived by implementing the tension stiffening effect included in Model Code 90 [3] is
proposed as a more reliable model for concrete elements reinforced with different types of FRP
reinforcements. The tension stiffening model of Model Code 90 also underlies the method recommended
in Eurocode 2 [9] to estimate service deflections for steel RC elements, and was shown to lead to
acceptable results also for FRP RC elements [4]. CAN/CSA-S806 [10] recommends determining
deflections by integration of curvatures along the span, but ignores the tension stiffening effect provided
by the FRP reinforcement. Instead it proposes the use of a gross and cracked moment of inertia to
represent the stiffness of un-cracked and cracked portions of the element, respectively.
Although the code approaches for the prediction of short-term deflection account for a reduced
flexural stiffness of the element due to cracking [11], this effective stiffness is treated as a global
parameter and cannot capture the effect of localised cracking. As a result, the deflection derived using
only cracked moment of inertia is expected to provide an upper bound limit for short-term deflections.
However, tests on beams and slabs [12, 13, 14] show that deflections tend to exceed this upper bound
even at relatively low load levels, when shear deformation or de-bonding are not expected to be of
significance.
Shrinkage can also contribute to deformations [14, 15] due to the restrain provided by the flexural bars
in the bottom of the beams and the consequent development of a shrinkage-induced curvature. Since the
stiffness of FRP bars is considerably lower than that of steel, this restrain is not as high as for an
equivalent steel reinforced section. Nonetheless, any restraint can cause the development of micro cracks
in the concrete and, as such, will have an impact on the apparent tensile strength of the concrete in the
structural element. However, beyond the initial impact around the cracking load, shrinkage strains cannot
justify deflections larger than predicted by the fully cracked section.
The plane sections remain plain assumption of section analysis is considered true for flexural elements
at the macro scale, but it does not necessarily apply in the regions around the crack. This may be
lightly steel reinforced concrete elements show that there are no significant additional deformations at
least up to the point of yielding [16].
Mota et al [17] and Rafai and Nadjai [18] examined several existing deflection models for FRP RC
beams and slabs and concluded that their performance is highly dependent on the accuracy of the
calculated cracking moment. The results of their study indicate that there is a critical need for reliability
analysis of FRP code equations to develop more accurate load-deflection formulas for FRP RC members.
Despite extensive research on the behaviour of FRP RC members, less research has been conducted
on deflection prediction of FRP RC elements considering the effects of different stress levels and
reinforcement ratio (for example [19] and [20]). To examine these, an experimental study was undertaken
to investigate the deflection behaviour of FRP RC concrete beams and slabs at service ability and ultimate
load levels. The experimental programme comprised twelve beams and twelve slabs with glass FRP
(GFRP) and carbon FRP (CFRP) with a wide range of reinforcement ratios. The experimentally
determined deflections are used to examine the accuracy of the predictive models discussed above and
presented in detail in the following sections.
2- Deflection prediction of FRP RC elements
To calculate short-term deflections of FRP RC beams, ACI 440.1R-03 [21] adopts the following
expression for effective moment of inertia (Ie), which accounts for the lower FRP modulus of elasticity
(Ef) and different FRP bond characteristics.
(
)
ga cr cr g d cr
e
I
M
M
I
I
I
I
≤
−
+
=
3
β
(1)
+
=
1
s f b d
E
E
α
β
(2)where Ig and Icr are the gross and cracked moment of inertia; Mcr and Ma are the cracking and applied
moment; Ef and Es are the FRP and steel modulus of elasticity respectively; and αb is a bond dependent
coefficient, which equals 0.5 for steel rebars. In the absence of more research data, a value of 0.5 has been
recommended for all FRP rebar types. ACI 440.1R-06 [5] abandons the reliance of
β
d on bond, and
=
fb f dρ
ρ
β
5
1
(3)Using the balanced reinforcement ratio (ρfb) in this equation implies that deflection depends on the
ultimate tensile stress of the FRP reinforcement.
After cracking, the composite action between the concrete and FRP rebars may not be as perfect as it
is usually assumed [7, 12]. In addition, shrinkage and the non-linear behaviour of concrete in the
compression zone can affect the stiffness of an RC element [15]. To address this issue, a possible
approach is to provide a transition between Ig and a certain fraction of Icr in the calculation of Ie. Such an
equation was proposed by Benmokrane et al [12], but was calibrated using a limited number of tests
(Equation 4).
3
0 0
0
(
)
−
+
=
a cr r c g r c eM
M
I
I
I
I
α
β
α
(4)where α0 and β0 are equal to 0.84 and 7, respectively. Naturally, this equation offers more flexibility
compared to the current ACI 440.1R-06 [5] equation. The factor α0 can reflect the reduced composite action between the concrete and FRP rebars. The factor β0 was introduced in the equation to enable a faster transition from Ig to Icr, since the degradation in stiffness due to the 3
rd
power component was
considered to be too low.
Bischoff [7] and Bischoff and Scanlon [22] analyzed extensively the ACI 318 [6] expression for Ie
from a tension-stiffening standpoint. The results of their studies indicate that the ACI 318 [6] proposed
method is not suitable for GFRP RC. The following equation was proposed for Ie, which is analogous to
the equation that can be deduced by implementing the provisions of CEB-FIP Model Code 90 [3] to
determine instantaneous curvatures or deflections. This equation is claimed to be equally applicable for
FRP and steel RC beams.
g a cr cr e
I
M
M
I
I
≤
−
=
21
η
, and g crI
I
−
=
1
η
(5)To predict the deformation of RC beam elements, Eurocode 2 [9] tries to account for the tension
stiffening effect based on the CEB-FIP Model Code 90 [3] approach. Based on Eurocode 2 [8], the
cr a cr g
a cr
M
M
M
M
∆
+
−
∆
=
∆
β
(
)
2(
1
β
(
)
2)
(6)where ∆g and ∆cr are the uncracked-state and cracked-state deflections, respectively. The coefficient β is a duration or repetition of load factor (1.0 for short-term loading and 0.5 for sustained or cyclic loading).
Equation (5) can be derived directly from equation (6) by using the β value for short-term loading.
3- Experimental programme
The experiments consisted of three series of GFRP and three series of CFRP tests on RC beams and
slabs. To ensure repeatability, each series comprised two identical elements (i.e. in total 24 tests). One
series of steel RC beams and slabs was also tested for comparison purposes.
3.1. Materials
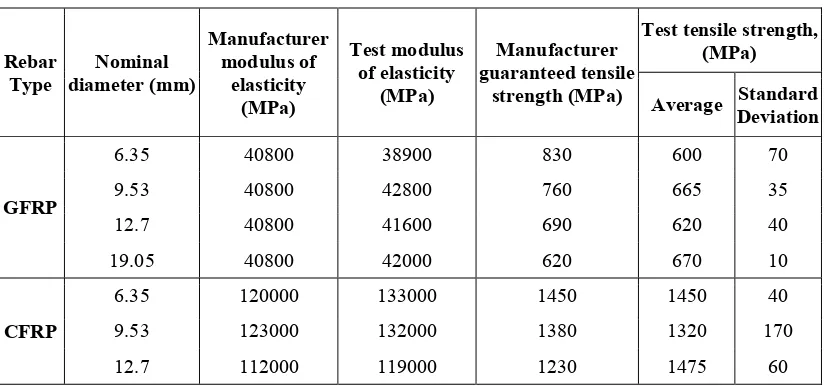
Aslan 100 CFRP and GFRP rebars were used for the main flexural reinforcement of the beams and
slabs. The surface treatment of these rebars is characterized by helically over-wound fibres and sand
coating. The tensile properties were obtained by testing a representative number of samples in uni-axial
tension, using resin filled steel tubes in the grips, and are shown in Table 1. Most of the bars failed away
from the grips, so the results reflect the tensile strength of the composite. It should be noted that the
strength of the larger diameter GRFP bars was similar to the strength of the smaller diameter bars,
contrary to the manufacturer's supplied data. The steel rebars had a nominal diameter of 12 mm and a
mean yield strength of 590 MPa and mean ultimate strength of 675 MPa.
In this study, concrete was produced using 25 mm maximum aggregate size, 0.48 water to cement
ratio and 380 kg/m3 cement content. The fresh concrete slump was about 75 mm, and the average 28-day
cube compressive strength and module of elasticity was found to be around 35 MPa and 29500 MPa,
respectively.
3.2. Details of beam and slab elements
The beam series were designated as BG#, BC#, BS# and slab series as SG#, SC#, SS#. B and S stand
for beam and slab, while G, C and S identify the type of reinforcement used, GFRP, CFRP or steel,
respectively. Notation # represents the series number, and the two identical elements within each series
The beam elements were 150 mm wide, 250 mm high, 2550 mm long, with the distance between the
end-supports being 2300 mm (see Figure 1). The shear span (767 mm) was reinforced with steel stirrups
to avoid shear failure, while no shear reinforcement was provided in the constant bending moment zone.
GFRP and CFRP rebars with nominal diameter of 6 mm were used as top reinforcement within the shear
span to hold the stirrups in place. The clear concrete cover to the main rebars was 25 mm in all cases.
Each beam series was designed to be under-reinforced, balanced or over-reinforced, with failure
occurring by rupture of bars or crushing of concrete. The geometric and reinforcement details of GFRP
and CFRP RC beams are given in Figure 1 and Table 2. The reinforcement ratio of the corresponding
beam and slab series is almost identical to enable comparison between the deflection behaviour of beam
and slab elements with similar reinforcement ratios.
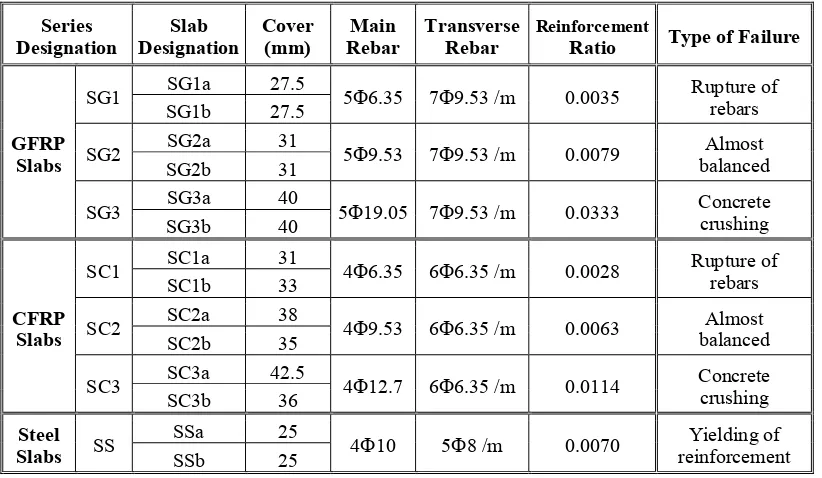
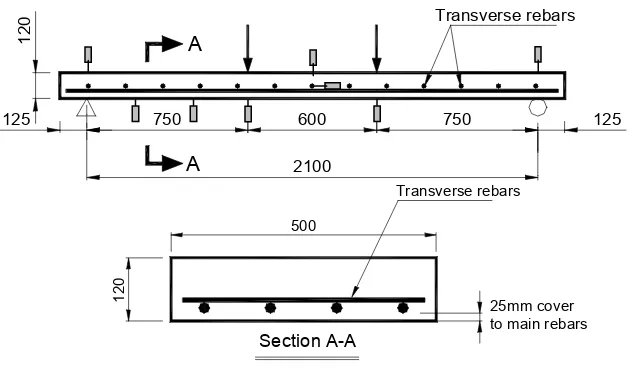
The slab elements were 500 mm wide, 120 mm high, 2350 mm long, whilst the distance between the
end-supports was 2100 mm. The geometric and reinforcement details of the GFRP and CFRP RC slabs
are shown in Figure 2 and Table 3. The clear concrete cover to the main rebars was specified at 25 mm.
However, the flotation of the FRP mesh reinforcement during casting resulted in slightly different cover
values as reported in Table 3. Similar to the beam elements, each slab series had a different reinforcement
ratio (under-reinforced, balanced and over-reinforced).
3.3. Instrumentation and Test Procedure
The two elements in each beam and slab series, along with eight control cubes and eight control
cylinders were constructed from the same batch of concrete. All the specimens in each series, including
the control cubes and cylinders, were cured under similar conditions and tested on the same day. The
cubes were used to determine the compressive strength, while the cylinders were used to determine the
tensile strength of the concrete according to ASTM C496-96 [23]. Table 4 shows the compressive and
tensile strength of concrete for different beam and slab series.
As shown in Figures 1 and 2, the elements were tested under four-point loading. The total load was
applied by means of a 600 kN hydraulic actuator and a loading beam was used to subject both beams and
slabs to two equal concentrated loads symmetrically placed about mid-span. One rebar of every beam and
slab was instrumented with a total of fourteen strain gauges. Four strain gauges were used to evaluate
strain development and average bond stresses within the shear span. The other ten strain gauges were
concentrated around a crack inducer at mid-span to investigate tension stiffening and bond profiles. Two
transducers (LVDT) were used to measure deflections (Figures 1 and 2). One strain gauge was also used
to measure the top surface concrete strain at mid-span. The testing was carried out in displacement control
and the load was paused at about 5 kN intervals to mark and measure the cracks and to take notes. Two
load cycles were performed for each specimen. In the first cycle, the load was increased to a service load
level corresponding to a stress of about 45% of the estimated concrete compressive strength in the top
concrete fibre at mid-span. In the second cycle, the load was increased until failure occurred, either by
rupture of bars or by crushing of concrete. All data (load, strains and deflections) were collected by a data
acquisition system at a sampling frequency of 1Hz.
4- Test results and discussion
Figure 3 shows the experimental load-deflection response at mid-span for all tested beams and slabs.
It is clear from this figure that the results of the two replicate elements within each series are very similar.
The only exception is in the SC3 series (Figure 3-d), where the clear cover is significantly different for
SC3a and SC3b slabs. Therefore, it can be confirmed that in general the materials used, the production of
the elements and the test procedure were all well controlled. Due to limitations of space, only some of the
results are discussed in this paper in detail. Similar behaviour was observed for all of the tested specimens.
4.1. Modes of failure
The three series of FRP RC beams and slabs were designed to investigate different flexural failure
modes including rupture of the rebars (under-reinforced), compressive failure of the concrete (over
reinforced) and balanced failure (compressive concrete failure followed immediately by rupture of the
rebars). The modes of failure for all tested beam and slab elements are given in Tables 2 and 3. It should
be mentioned that under-reinforced FRP RC sections are not usually of interest for design purposes, since
the failure is brittle and drastically catastrophic; however, they result in much higher stress levels in the
FRP bars which is of interest in terms of deflection behaviour.
4.2. Strain in the concrete and rebars
A cracked-section analysis was performed to estimate the load deflection response of each of the
tested specimens. The assumption of plane sections remain plane was implemented in this analysis. A
linear elastic behaviour for the FRP reinforcement was considered, while the stress-strain relationship for
the concrete in compression was based on the Eurocode 2 model [9]. The concrete was assumed to resist
results show that cracked-section analysis predicts reasonably well the maximum rebar strain at the
location of the pre-formed crack. Beyond cracking, the rebar strains around the crack inducer follow
almost a linear relationship with load up to failure. From the analysis of Figure 4.a it can be seen that
cracking at the location of the crack inducer takes place at 13 kN, as captured by gauge No. 10. However,
the first natural crack takes place at 18 kN and its development was captured by gauge No. 14. At higher
load levels, the natural crack developed wider than the induced crack and hence the rebar undergoes
additional strain when moving away from mid-span induced crack.
The load-concrete strain relationships shown in Figure 4-b indicate that the concrete strain at the
extreme top fibre (above the location of the crack) considerably exceeds that predicted by cracked-section
analysis. This can be attributed to the fact that cracked-section analysis assumes a linear strain
distribution in the section that may not be accurate enough for FRP RC beams, as the low modulus of
elasticity of FRP rebars leads to wider cracks, and therefore, more localized effects compared to steel RC
beams.
4.3. Curvature
FRP rebars have high tensile strength and their stress-strain behaviour is linear up to failure. Using the
experimental top-fibre concrete strain (εc), an average of the rebar strains around the crack inducer (εfave),
and the effective reinforcement depth (d), the curvature (φ) at every load level was evaluated from the test results according to the general approach of CEB, as follows.
d
fave
c
ε
ε
ϕ
=
+
(7)The experimentally derived load-curvature relationships, in general, compare well to those derived by
cracked-section analysis (Figure 5-a). In this study, the experimentally derived moment-curvature
relationships were used to calculate the mid-span deflections that are associated with the flexure
behaviour as shown in Figure 5-b. It can be seen that for SG2 (balanced reinforced slab) the measured
deflections are larger than the predicted flexural deflections, and they start to deviate shortly after shear
cracking (14.8 kN). The difference between the measured and flexural deflections can be investigated
further by examining the strain profiles along the rebar at different load levels. The small difference in the
cracking loads observed in Figures 5-a and 5-b is attributable to the fact that deflections are affected by
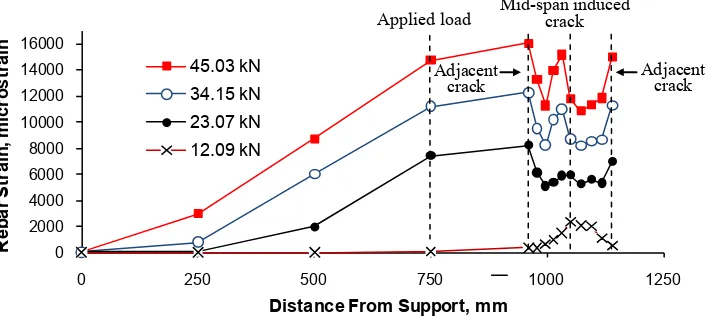
localised effects to a lesser extent than section curvatures. Figure 6 shows the experimental profile of
development of a nearby crack (i.e. mid-span induced crack and adjacent cracks). The strain profiles
along the rebar in the shear span indicate that the rebar undergoes additional strains, in excess of the
strains due to flexure, since the strains at the centre span are lower than in the region near the loading
points. This behaviour is not observed in steel RC since the considerably higher steel stiffness controls
crack widths and restricts the spread of additional deformations. In other words, due to the low modulus
of elasticity of the FRP rebars (especially GFRP rebars), the contribution of shear and bond-slip induced
deformations could be of major significance for FRP RC elements. For example, this additional deflection
for beam BG2 was estimated to be 20% of the measured deflection at failure [16].
4.4. Deflection
Calculated load-mid-span flexural deflections of beams BG1a (low reinforcement ratio) and BG3a
(high reinforcement ratio) are compared to the measured deflections in Figure 7. Figure 8 shows the
calculated flexural deflections and experimental measured deflections of their corresponding slab
elements SG1a (low reinforcement ratio) and SG3a (high reinforcement ratio).
As shown in Figures 7-a and 8-a, the effect of the additional component of the mid-span deflection is
not prominent for series BG1 and SG1 (low reinforcement ratio elements) because premature failure
occurred by rupture of the rebars, when the load level was relatively low. For BG3 and SG3 (Figures 7-b
and 8-b) the high amount of reinforcement could provide better control over the additional deformations
(shear or bond-slip induced deformations) at the lower load levels. As a result, the additional deflections
were observed at the higher load level. It is therefore suspected that the additional deformations are more
important in beams and slabs with a moderate reinforcement ratio (see Figure 5-b). Based on the above
discussion, for GFRP RC elements with moderate to high reinforcement ratios, it would be important to
evaluate the additional deformations [16].
5. Prediction of deflection
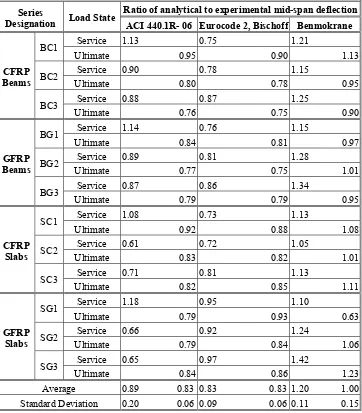
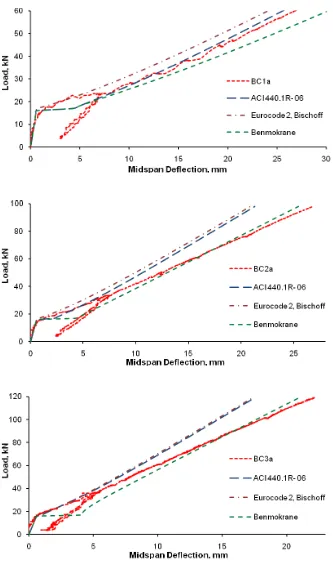
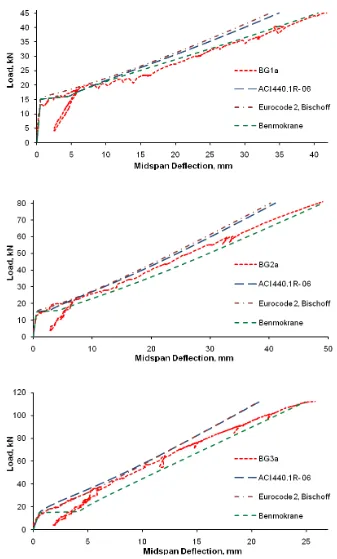
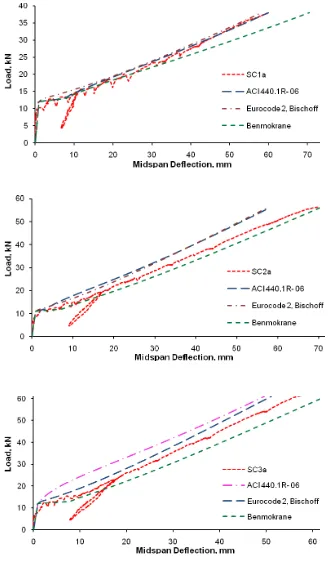
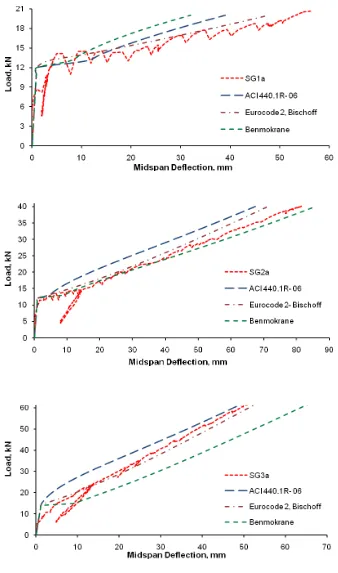
Figures 9 to 12 compare experimental mid-span deflections for all tested beams and slabs to the
deflections predicted using different simple prediction equations. It should be noted, the results of this
study showed that, in general, the accuracy of the predicted deflection is highly dependent on the
accuracy of the calculated cracking moment. Accurate estimation of concrete cover is also important for
thin RC slabs where a small variation in the concrete cover would result in a considerable variation in the
analytical to the experimental mid-span deflection was calculated for all FRP RC elements at both service
and ultimate limit states (Table 5). In the present study, the service load is that corresponding to a stress
level in the top concrete fibre of about 40% of the concrete compressive strength.
5.1. Service limit state
The results show that ACI 440.1R-06 [5] approach, in general, overestimates deflections (up to 18%)
for FRP RC elements with low reinforcement ratio (beams: BG1 and BC1; slabs: SG1 and SC1) at
service limit state. However, for FRP RC beams and slabs with moderate to high reinforced ratio this
method always underestimates the service level deflections (on average by 11% and 34% for FRP
reinforced beams and slabs, respectively).
As mentioned before, the effective moment of inertia (Ie) proposed by Bischoff [7] and Eurocode 2 [9]
are both based on the tension stiffening provisions of CEB-FIP Model Code 1990 [3]; and therefore, lead
to identical deflection predictions. Figures 9 to 12 show that the deflections predicted according to
Eurocode2 [9] and Bischoff [7] approach in general compare well with the measured deflections at low
load levels. However, the predicted deflections for the FRP RC elements were on average 17% less than
the measured deflections.
Benmokrane et al [12] equation is found to considerably overestimate (up to 42%) the deflection of
FRP RC beams and slabs at service load level (see Table 5). The reason could be attributed to the use of
β0 factor in this equation that leads to a high degradation in stiffness at service load level as shown in
Figures 9 to 12.
5.2. Ultimate limit state
The results of this study indicate that both ACI 440.1R-06 [5] and Eurocode 2 [9] (and Bischoff [7])
equations underestimate the measured deflections of FRP RC elements by up to 25% at high levels of
load. Table 5 indicates that predicted mid-span deflections are on average 12% and 20% less than the
measured deflections of low and moderate to high reinforced ratio FRP RC elements, respectively. As
discussed in previous sections, the difference between the calculated and measured deflections in
moderate to high reinforced ratio FRP RC elements may be mainly attributed to the additional
deformations induced by shear and bond-slip. It is shown in Figures 9 to 12 that, except for two GFRP
RC slabs (SG1and SG3), Benmokrane et al [12] proposed method was fairly accurate in predicting the
ultimate mid-span deflection of FRP RC elements. Table 5 shows that this method underestimates the
The results of this study indicate that additional deformations other than those induced by pure flexure
could be significant particularly in FRP RC beams and slabs with moderate to high reinforced ratio.
However, it seems that most of the existing simplified methods to predict deflections of FRP RC elements
do not adequately take into account these additional deformations. This usually leads to un-conservative
predictions especially at higher load levels. It should be mentioned that additional deformations may not
always be significant at the serviceability load. Nevertheless, it is still important to predict deformation of
FRP RC elements over the entire loading range with good accuracy. This requires developing more
fundamental methods to evaluate shear and bond-slip induced deflections [24, 25]. Further analytical
investigations will be published by the authors in a separate, forthcoming paper.
6- Conclusions
This study experimentally investigated the deflection behaviour of 24 GFRP and CFRP RC beams and
slabs covering a wide range of reinforcement ratios. Based on the results, the following conclusions can
be drawn:
• For FRP RC beams and slabs, the plain section remains plain assumption across the entire section
may not be valid for high levels of loading.
• Existing approaches to estimate deflections of RC elements by considering solely their flexural
behaviour tend to underestimate overall deformations. The contribution to overall deflections of
other possible stiffness-reducing mechanisms (e.g. shear cracking, shrinkage and loss of bond) can
be significant, particularly in FRP RC elements having moderate to high reinforcement ratios and
should be further investigated. The accuracy of the predicted deflection for FRP RC elements
(particularly in thin slabs) is highly dependent on the accuracy of the calculated cracking moment
and concrete cover.
• The ACI 440.1R-06 [5] equation leads to overestimated service level deflections at low reinforced
ratios, and underestimated deflections at moderate to high reinforced ratio FRP RC beams and slabs.
This method underestimates the measured ultimate deflections especially for moderate to high
reinforced ratio FRP RC elements.
• The faster transition to a fully cracked response assumed in the model proposed by Benmokrane et
• The performance of the approach recommended in Eurocode 2 [9] and the analogous model
proposed by Bishoff [7] offer more consistent predictions throughout the range of reinforcement
ratios explored in this experimental programme. These methods, however, tend to underestimate
deflections at service load (on average by 17%) and to a larger extent at ultimate limit states,
especially for moderate to high reinforced ratio (up to 25%).
References
[1] Gdoutos A, Pilakoutas K, Rodopoulos C (Eds), Failure Analysis of Industrial Composite Materials,
McGraw-Hill Professional Engineering, New York, 2000. p.51-108.
[2] Pilakoutas K, Neocleous K, Guadagnini M. Design philosophy issues of fiber reinforced polymer reinforced
concrete structures. Journal of Composites for Construction 2002; 6(3): 154-161.
[3] CEB. CEB-FIP Model Code 1990. Comite Euro-International du Beton, Thomas Telford Ltd, 1993.
[4] fib Bulletin No. 40, FRP Reinforcement in RC Structures, International Federation for Structural Concrete,
Lausanne, Switzerland, 2007.
[5] ACI Committee 440. Guide for the Design and Construction of Concrete Reinforced with FRP Bars (ACI
440.1R-06). American Concrete Institute, Farmington Hills, 2006.
[6] ACI Committee 318. Building Code Requirements for Structural Concrete (ACI 318-08) and Commentary
(ACI 318R-08). American Concrete Institute, Farmington Hills, Mich, 2008.
[7] Bischoff PH. Deflection Calculation of FRP Reinforced Concrete Beams Based on Modifications to the
Existing Branson Equation. Journal of Composites for Construction 2007; 11(1): 4-14.
[8] ISIS Canada. Reinforcing Concrete Structures with Fibre Reinforced Polymers-Design Manual No. 3. ISIS
Canada Corporation, University of Manitoba, Winnipeg, Manitoba, Canada, 2001.
[9] CEN. Eurocode 2: Design of concrete structures - Part 1-1: General rules and rules for buildings (EN
1992-1-1:2004). European Committee for Standardisation, 2004.
[10] CAN/CSA-S806. Design and Construction of Building Components with Fibre-Reinforced Polymers.
Canadian Standards Association, Mississauga, Ontario, Canada, 2002.
[11] Achillides Z, Pilakoutas K.. Bond behaviour of fiber reinforced polymer bars under direct pullout
conditions, Journal of Composites for Construction 2004; 8 (2): 173-181.
[12] Benmokrane B, Chaallal O, Masmoudi R. 1996, Flexural Response of Concrete Beams Reinforced with
FRP Reinforcing Bars, ACI Structural Journal 1996; 93(1): 46-55.
University of Sheffield, Sheffield, UK, 1999.
[14] Al-Sunna R., Pilakoutas K, Waldron P, Al-Hadeed T. Deflection of FRP reinforced concrete beams, In:
4th Middle East Symp. on Structural Composites for Infrastructure Applications (MESC-4), Alexandria,
Egypt, 2005.
[15] Bischoff PH, Johnson RD. Effect of shrinkage on short-term deflections of reinforced concrete beams and
slabs. ACI Structural Journal 2008, 105 (4): 516 – 518.
[16] Al-Sunna R. Deflection Behaviour of FRP Reinforced Concrete Flexural Members, PhD thesis, the
University of Sheffield, Sheffield, UK, 2006.
[17] Mota C, Alminar S, Svecova D, Critical Review of Deflection Formulas for FRP-RC Members. Journal of
Composites for Construction, ASCE 2006; 10 (3): 183-194.
[18] Rafi MM, Nadjai A, Evaluation of ACI 440 deflection model for fiber-reinforced polymer reinforced
concrete beams and suggested modification, ACI Structural Journal 2009; 106 (6): 762-771.
[19] Masmoudi, R., Theriault, M., and Benmokrane, B. Flexural behavior of concrete beams reinforced with
deformed fiber reinforced plastic reinforcing rods, ACI Structural Journal 1998; 95(6): 665 – 675.
[20] Yost, J. R., Gross, S. P., and Dinehart, D. W. Effective moment of inertia for glass fiber-reinforced
polymer-reinforced concrete beams. ACI Structural Journal 2003; 100(6): 732 – 739.
[21] ACI Committee 440. Guide for the Design and Construction of Concrete Reinforced with FRP Bars, (ACI
440.1R-03). American Concrete Institute, Farmington Hills, 2003.
[22] Bischoff PH, Scanlon A. Effective moment of inertia for calculating deflections of concrete members
containing steel reinforcement and fiber-reinforced polymer reinforcement. ACI Structural Journal 2007;
104(1): 68-76.
[23] ASTM C496-96 Standard Test Method for Splitting Tensile Strength of Cylindrical Concrete Specimens,
ASTM Committee, Philadelphia, 1996.
[24] Guadagnini M, Pilakoutas K, Waldron P. Shear resistance of FRP RC beams: Experimental study. Journal
of Composites for Construction 2006; 10 (6): 464-473.
[25] Imjai, T., Guadagnini, M. and Pilakoutas K. Estimation of Shear Crack Induced Deformations of FRP RC
Beams, 9th International Symposium on Fiber Reinforced Polymer Reinforcement for Concrete Structures,
Table 1. Tensile properties of GFRP and CFRP rebars.
Rebar Type
Nominal diameter (mm)
Manufacturer modulus of
elasticity (MPa)
Test modulus of elasticity
(MPa)
Manufacturer guaranteed tensile
strength (MPa)
Test tensile strength, (MPa) Average Standard
Deviation
GFRP
6.35 40800 38900 830 600 70
9.53 40800 42800 760 665 35
12.7 40800 41600 690 620 40
19.05 40800 42000 620 670 10
CFRP
6.35 120000 133000 1450 1450 40
9.53 123000 132000 1380 1320 170
[image:15.595.96.499.357.612.2]12.7 112000 119000 1230 1475 60
Table 2. Reinforcement details of the test beams
(1)
Two layers, with 25 mm clear spacing between them.
Series Designation
Beam
Designation Rebar Details
Reinforcement
Ratio Type of Failure
GFRP Beams
BG1 BG1a 2Φ9.53 0.0043 Rupture of rebars
BG1b
BG2 BG2a 2Φ12.7 0.0077 Almost balanced
BG2b
BG3 BG3a 4Φ19.05 (1) 0.0391 Concrete
crushing BG3b
CFRP Beams
BC1 BC1a 3Φ6.35 0.0029 Rupture of rebars
BC1b
BC2 BC2a 3Φ9.53 0.0065 Almost balanced
BC2b
BC3 BC3a 3Φ12.7 0.0116 Concrete
crushing BC3b
Steel
Beams BS
BSa
2Φ12 0.0069 Yielding of
Table 3. Reinforcement details of the test slabs
Table 4. Mechanical properties of the concrete
Series Designation Slab Designation Cover (mm) Main Rebar Transverse Rebar Reinforcement
Ratio Type of Failure
GFRP Slabs
SG1 SG1a 27.5 5Φ6.35 7Φ9.53 /m 0.0035 Rupture of rebars
SG1b 27.5
SG2 SG2a 31 5Φ9.53 7Φ9.53 /m 0.0079 Almost
balanced
SG2b 31
SG3 SG3a 40 5Φ19.05 7Φ9.53 /m 0.0333 Concrete
crushing
SG3b 40
CFRP Slabs
SC1 SC1a 31 4Φ6.35 6Φ6.35 /m 0.0028 Rupture of
rebars
SC1b 33
SC2 SC2a 38 4Φ9.53 6Φ6.35 /m 0.0063 Almost
balanced
SC2b 35
SC3 SC3a 42.5 4Φ12.7 6Φ6.35 /m 0.0114 Concrete
crushing
SC3b 36
Steel Slabs SS
SSa 25
4Φ10 5Φ8 /m 0.0070 Yielding of reinforcement
SSb 25
Series Designation
Cube Compressive Strength (MPa) Split Cylindrical Tensile Strength (MPa) Average Standard Deviation Average Standard Deviation GFRP
Beams
BG1 47.7 3.56 4.1 0.29
BG2 47.7 3.56 3.8 0.15
BG3 46.5 0.92 3.6 0.08
CFRP Beams
BC1 55.4 2.86 3.9 0.20
BC2 52.6 2.38 3.6 0.05
BC3 51.8 2.59 3.6 0.19
Steel
Beams BS 52.0 1.40 4.1 0.28
GFRP Slabs
SG1 51.0 1.44 3.9 0.23
SG2 46.2 1.55 3.4 0.24
SG3 45.9 2.02 3.8 0.17
CFRP Slabs
SC1 50.1 2.50 3.9 0.21
SC2 51.0 2.41 3.4 0.11
SC3 49.8 3.95 3.8 0.24
Steel
[image:16.595.90.508.400.682.2]Table 5. Analytical to experimental mid-span deflection for FRP reinforced elements
Series
Designation Load State
Ratio of analytical to experimental mid-span deflection ACI 440.1R- 06 Eurocode 2, Bischoff Benmokrane
CFRP Beams
BC1 Service 1.13 0.75 1.21
Ultimate 0.95 0.90 1.13
BC2 Service 0.90 0.78 1.15
Ultimate 0.80 0.78 0.95
BC3 Service 0.88 0.87 1.25
Ultimate 0.76 0.75 0.90
GFRP Beams
BG1 Service 1.14 0.76 1.15
Ultimate 0.84 0.81 0.97
BG2 Service 0.89 0.81 1.28
Ultimate 0.77 0.75 1.01
BG3 Service 0.87 0.86 1.34
Ultimate 0.79 0.79 0.95
CFRP Slabs
SC1 Service 1.08 0.73 1.13
Ultimate 0.92 0.88 1.08
SC2 Service 0.61 0.72 1.05
Ultimate 0.83 0.82 1.01
SC3 Service 0.71 0.81 1.13
Ultimate 0.82 0.85 1.11
GFRP Slabs
SG1 Service 1.18 0.95 1.10
Ultimate 0.79 0.93 0.63
SG2 Service 0.66 0.92 1.24
Ultimate 0.79 0.84 1.06
SG3 Service 0.65 0.97 1.42
Ultimate 0.84 0.86 1.23
Figure 1. Geometric and reinforcement details of the test beams
Figure 2. Geometric and reinforcement details of the test slabs Transverse rebars
500
25mm cover to main rebars
1
2
0
Section A-A
750
600 125
125
1
2
0
2100 750
A A
Transverse rebars
2
5
0 steel stirrups,
Ø8mm/75mm 2Ø6mm
25mm clear main rebars 150
Section A-A
main rebars
767
2300
2
5
0
125 2Ø6mm
125
766 767
steel stirrups, Ø8mm/75mm
A
[image:18.595.145.459.479.663.2]Figure 3. Experimental load vs. mid-span deflection; series (a): BG, (b): BC, (c): SG, (d): SC
Figure 4. Typical experimental load vs. strain relationships for beam BG2; (a): Rebar strain; (b): Concrete strain
Figure 5. Typicalexperimental load vs. (a): curvature, and (b): mid-span deflection, slab SG2a
Beam series BC and BS
0 20 40 60 80 100 120 140
0 10 20 30
Midspan Deflection, mm
L oa d, kN BC1a, BC1b BC2a, BC2b BC3a, BC3b BSa, BSb 0 10 20 30 40 50 60 70
0 20 40 60 80
Midspan Deflection, mm
L oa d, kN SC1a, SC1b SC2a, SC2b SC3a, SC3b SSa, SSb
Note: different covers of the slabs within the same series.
0 10 20 30 40 50 60
0 25 50 75 100
Midspan Deflection, mm
L oa d, kN SG1a, SG1b SG2a, SG2b SG3a, SG3b SSa, SSb 0 20 40 60 80 100 120
0 10 20 30 40 50
Midspan Deflection, mm
L oa d, kN BG1a, BG1b BG2a, BG2b BG3a, BG3b BSa, BSb
(a)
(b)
(c)
(d)
0 5 10 15 20 25 30 35 40 45
0 20 40 60 80 100
L o a d , k N
Midspan Deflection, mm LVDT 6
Derived from curvatures
Cracked-section analysis 0 5 10 15 20 25 30 35 40 45
0 0.05 0.1 0.15 0.2
L o a d , k N
Curvature, m-1
Curvature derived from experimental strains Cracked-section analysis
(a)
(b)
(Mid-span) Beam BG2b 0 10 20 30 40 50 60 70 80 90
500 -3000 -2500 -2000 -1500 -1000 -500 0 Concrete Strain, microstrain
L
oa
d, kN
Strain gauge 15
Cracked-section analysis Beam BG2b 0 10 20 30 40 50 60 70 80 90
0 2000 4000 6000 8000 10000 12000 14000 16 Rebar Strain, microstrain
L
oa
d, kN
Strain gauge 10 Strain gauge 11 Strain gauge 12 Strain gauge 13 Strain gauge 14 Cracked-section analysis
14 13 12
10 11
(a)
(b)
14 13 12 11 10
[image:19.595.94.502.595.748.2]0 2000 4000 6000 8000 10000 12000 14000 16000
0 250 500 750 1000 1250
R e b a r S tr a in , m ic ro s tr a in
Distance From Support, mm
[image:20.595.124.478.90.250.2]45.03 kN 34.15 kN 23.07 kN 12.09 kN
[image:20.595.97.498.328.483.2]Figure 6. Typical experimental profile of strains along a rebar, SG2
Figure 7. Experimental load vs. mid-span deflection for (a): BG1, and (b): BG3
Figure 8. Experimental load vs. mid-span deflection for (a): SG1, and (b): SG3 0 10 20 30 40 50 60 70
0 20 40 60 80
L o a d , k N
Midspan Deflection, mm
LVDT L6
Flexural deflections derived from experimental curvatures 0 4 8 12 16 20
0 10 20 30 40
L o a d , k N
Midspan Deflection, mm
LVDT 6
Flexural deflections derived from experimental curvatures
(a)
(b)
0 10 20 30 40 50
0 10 20 30 40 50
L o a d , k N
Midspan Deflection, mm
LVDT 6
Flexural deflections derived from experimental curvatures
0 30 60 90 120
0 5 10 15 20 25 30
L o a d , k N
Midspan Deflection, mm
LVDT 6
Flexural deflections derived from experimental curvatures
(a)
(b)
(Mid-span) (Mid-span)
(Mid-span)
(Mid-span)
Applied load Mid-span induced crack
Adjacent crack Adjacent
[image:20.595.97.502.551.709.2]