Desert
.
White Rose Research Online URL for this paper:
http://eprints.whiterose.ac.uk/96000/
Version: Accepted Version
Article:
Bateman, M.D., Bryant, R.G., Foster, I.D.L. et al. (2 more authors) (2012) On the formation
of sand ramps: A case study from the Mojave Desert. Geomorphology, 161-16. pp. 93-109.
ISSN 0169-555X
https://doi.org/10.1016/j.geomorph.2012.04.004
Article available under the terms of the CC-BY-NC-ND licence
(https://creativecommons.org/licenses/by-nc-nd/4.0/)
eprints@whiterose.ac.uk
https://eprints.whiterose.ac.uk/
Reuse
Unless indicated otherwise, fulltext items are protected by copyright with all rights reserved. The copyright
exception in section 29 of the Copyright, Designs and Patents Act 1988 allows the making of a single copy
solely for the purpose of non-commercial research or private study within the limits of fair dealing. The
publisher or other rights-holder may allow further reproduction and re-use of this version - refer to the White
Rose Research Online record for this item. Where records identify the publisher as the copyright holder,
users can verify any specific terms of use on the publisher’s website.
Takedown
If you consider content in White Rose Research Online to be in breach of UK law, please notify us by
On the formation of sand ramps: A case study from the Mojave Desert
Mark D. Bateman1, Robert G. Bryant1, Ian D.L. Foster2 3, Ian Livingstone2, Anthony Parsons1
1 Geography Department, University of Sheffield, Winter St., Sheffield S10 2TN, UK.
2School of Science and Technology, The University of Northampton, Northampton NN2 6JD, UK.
3 Geography Department, Rhodes University, Grahamstown 6140, Eastern Cape, South Africa
*Corresponding author
This is an author produced version of a paper which was subsequently published in Geomorphology. This paper has been peer-reviewed but does not contain final published proof-corrections or journal pagination.
Abstract
Sand ramps are dune-scale sedimentary accumulations found at mountain fronts and consist of a combination of aeolian sands and the deposits of other geomorphological processes associated with hillslope and fluvial activity. Their complexity and their construction by wind, water and mass movement means that sand ramps potentially hold a very rich store of palaeoenvironmental information. However, before this potential can be realised a full understanding of their formation is necessary. This paper aims to provide a better understanding of the principal factors influencing the development of sand ramps. It reviews the stratigraphic, chronometric and sedimentological evidence relating to the past development of sand ramps, focussing particularly on Soldier Mountain sand ramp in the Mojave Desert, as well as using observations of the modern movement of slope material to elucidate the formation of stone horizons within sand ramps.
Findings show that sand ramps cannot easily be interpreted in terms of a simple model of fluctuating palaeoenvironmental phases from aeolian dominated to soil/fluvial dominated episodes. They accumulate quickly (perhaps in b5 ka), probably in a single phase before becoming relict. Based on the evidence from Soldier Mountain, they appear strongly controlled by a ‘window of opportunity’ when sediment supply is plentiful and cease to develop when this sediment supply diminishes and/or the accommodation space is filled up. Contemporary observations of stone movement both on rock and sandy sloping surfaces in the Mojave region indicate movement rates in the order of 0.6 and 11mm yr−1, which is insufficiently fast to explain how stone horizons could have been moved across and been incorporated into sand ramps on multiple occasions. Stone horizons found within the aeolian sediments lack evidence for soil development and are interpreted as very short-term events in which small streams moved and splayed discontinuous stone horizons across the sand ramp surface before aeolian deposition resumed. Surface stone horizons may formby creep from mountain slope sources across sand ramps but require enhanced speed compared to measured rates of runoff creep. We propose the mechanism of fluvio-aeolian creep. Our study suggests that current models of alternating Aeolian and colluvial deposition within sand ramps, their palaeoenvironmental significance and indeed how sand ramps are distinguished from other dune forms require amendment.
Keywords: Sand ramp, Talus, Aeolian, Dune, Luminescence, Mojave Desert
1. Introduction
Sand ramps are dune-scale sedimentary accumulations found at mountain fronts and consist of a combination of aeolian sands (from multiple or single sources) and the deposits of other geomorphological processes associated with hillslope and fluvial activity. The Aeolian material is trapped by the topography in the same manner as obstacle dunes fixed by topography (either ‘climbing’ or ‘falling’). However, contrary to the suggestion of Livingstone and Warren (1996) that sand ramps may be seen as a sub-category of falling or climbing dune, they are actually far more complex. In addition to the input of Aeolian material, the mountain slopes above the ramp generate debris which is brought onto the ramp by either hydrological or gravitational processes. As a consequence, sand ramps are usually composed of a mix of Aeolian sand, talus deposits, debris flows, colluvium and fluvial deposits. Indeed, sand ramps might be viewed as lying on a continuum between endpoints created, respectively, solely by aeolian
processes or solely by hillslope processes. At the aeolian end of this continuum would be mountain-front climbing or falling dunes. At the alluvial end of the spectrum would be a variety of features including talus cones and alluvial fans. Between these end points, sand ramps display a variety of Aeolian and hillslope sediments, and the relative importance of these inputs may vary over time. This complexity and their construction by wind, water and mass movement means that sand ramps potentially hold a very rich store of palaeoenvironmental information. However, before this potential can be realised a fuller understanding of their formation is necessary.
aims to review and investigate further: [1] stratigraphic, chronological and sedimentological evidence relating to the past development and accumulation rates of sand ramps; [2] how observations of the modern movement of slope material elucidate the formation of stone horizons within sand ramps. (In this paper we use the term ‘stone horizon’ as equivalent to the ‘stone band’ or ‘talus band’ of others.)
2. Previous work
Sand ramps have been recognised in remarkably few desert environments. However, given that their surface may be either sandy or stony it is quite possible that they have gone unrecognised in many environments, being taken as either topographically-anchored dunes (with a sandy surface) or as alluvial fans or talus cones (with a stony surface). It is often only where exposures have been created, either by natural processes of incision or by human activity, particularly quarrying, that the true nature of these features has been recognised. While sand ramps have been widely studied in the Mojave, USA they also have been described from the central Sahara (Busche, 1998 cited by Bertram, 2003), the southern Namib (Bertram, 2003), Jordan (Turner and Makhlouf, 2002), Iran (Thomas et al., 1997), Mallorca (Clemmensen et al., 1997) and South Africa (Telfer et al., 2012).
The main focus for work on sand ramps has been the Mojave Desert, California, USA. The term sand ramp appears to have first been used by Tchakerian in his 1989 thesis on aeolian features in the Mojave Desert and was used in his subsequent papers and those of others in the 1990s. Here, the ‘basin-and-range’ topography provides ample opportunity for sediment to accumulate on mountain fronts by combining active hillslopes with aeolian sand transport. The first published discussion of these features was in the work of
Tchakerian (1991) followed subsequently by a series of reports on the use of luminescence techniques to provide a chronology (Clarke, 1994; Rendell et al., 1994; Clarke et al., 1996a, 1996b; Rendell and Sheffer, 1996; Clarke and Rendell, 1998) as well as some broader discussions of the geomorphology of the sand ramps (Lancaster and Tchakerian, 1996, 2003; Tchakerian and Lancaster, 2002).
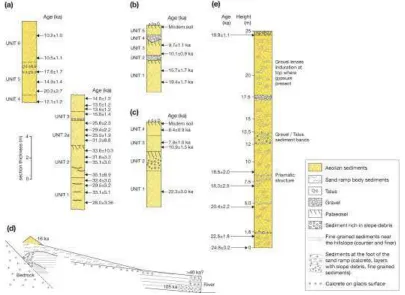
[image:3.612.111.516.411.706.2]Given the difficulty of recognising these features in the field and the paucity of previous work, it is not surprising that there are very considerable uncertainties associated with the formation of sand ramps. Although previous studies have invoked a combination of Aeolian and hillslope sediments, there does not appear to have been any systematic attempt to explain the mechanism(s) and speed by which horizons of stones moved by water and/or gravity can be moved into aeolian deposits. This lacuna is not helped by the lack of data on accumulation rates for sand ramps as aeolian geomorphologists have concentrated on dune forms where measurable (in the short-term) sediment accumulation rates have been observed (Wiggs, pers. comm.). Thus to gain insight into net accumulation rates it is necessary to turn to ‘palaeo’ records and the limited number of sites that have multiple ages from single sedimentary profiles/units (Fig. 1). Using this previous work to understand the aeolian– colluvial/fluvial interplay, however, is hampered by previously published chronologies having high age uncertainties (up to 30%, average around 12%), age reversals with depth and within units (e.g. Fig. 1a), as well as sampling strategies which do not always date upper and lower parts of stratigraphic units (e.g. Fig. 1e). To illustrate this point, Table 1 shows calculated minimum and maximum accumulation rates for the Dale Lake and Ardekan sand
Table 1. Published accumulation rates for sand ramps
Unit Sediment Thickness (m)
Max Age (ka) Min Age (ka) Min Accumulation Rate (m/ka)
Max accumulation Rate2
(m/ka)
Dale Lake Sand Ramp, Mojave (Rendell et al. 1994)
Unit 1 2.0 33.1 ± 5.11 28.0 ± 3.361 0.15 2.0
Unit 2 2.3 35.1 ± 8.91 31.6 ± 3.31 0.13 2.3
Unit 2a 1.6 31.8 ± 8.81 25.5 ± 1.91 0.09 1.6
Unit 3 - - - - -
Unit 4 1.0 14.8 ± 1.31 12.1 ± 1.21 0.20 5.0
Unit 5 1.85 20.2 ± 2.71 14.9 ± 1.41 0.20 1.5
Unit 6 2.05 10.5 ± 1.11 10.2 ± 1.01 0.85 2.1
Ardakan Sand Ramp, Iran (Thomas et al. 1997)
Shfd95008-Shfd95009 1.25 24.8 ± 3.21 22.5 ± 1.8 0.17 1.25
Shfd95009-Shfd95011 3.50 22.5 ± 1.8 20.4 ± 2.2 0.57 3.50
Shfd95011-Shfd95012 2.50 20.4 ± 2.2 18.3 ± 2.5 0.37 2.50
Shfd95013-Shfd95014 15.75 19.1 ± 1.11 18.5 ± 2.01 4.63 15.75
1 age reversals and ages within error of each other present in units so calculations based on minimum and maximum ages wherever they occurred in unit. 2 Where ages are within errors maximum accumulation rate assumed to be that the total unit thickness was deposited within 1 ka.
ramps. Overall the chronologies show that individual sand ramp units can accumulate very rapidly (maybe as fast as ~2 m/ka) and that sand ramps form over the course of up to 20 ka (but often much less) before becoming relict features. However, while all the studied sand ramps have clear stratigraphical breaks between aeolian- and fluvial/colluvial derived sediments, suggesting phased accumulation, there is disagreement as to whether stone horizons represent significant temporal breaks in aeolian sedimentation or not and whether sufficient time has elapsed in order for proto-‘soils’ to start forming. While sufficient time would appear to be available for the Dale Lake, Iron Mountain and Big Maria sand ramps (Rendell et al., 1994; Lancaster and Tchakerian, 2003; Fig. 1a–c), this does not appear to be the case for the Ardekan sand ramp (Fig. 1e).
Although the presence of discontinuous horizons of rock fragments at most a few fragments thick has been used as evidence of the interplay of fluvial, aeolian and hillslope processes in the formation of sand ramps, interpreting this interplay is problematic in two respects. First, there is the question of what processes are responsible for the presence of the coarse fragments, and secondly the issue is what they might indicate about the temporal relationships among the processes. There is some difference of opinion in the literature as to what these deposits represent. Whereas Lancaster and Tchakerian (1996) call them ‘talus deposits’ (sometimes associated with palaeosols) and use the same term to refer to the layer of coarse fragments that typically mantle sand ramps in the Mojave Desert, similar deposits on sand ramps in Namibia are referred to as ‘desert pavement’ (on the surface) and ‘slopewash deposits’ (within the body of the sand ramp) by Bertram (2003). Turner and Makhlouf (2002) attribute ‘stringers of boulders’ on sand ramps in Jordan to the process of rockfall. The difference in attribution of these horizons of coarse particles is crucial for interpretation of the chronology of sand ramps. Rockfalls, like debris-flow deposits and (in the context of dryland environments) probably also fluvial deposits, may be characterised as event-based deposits. They are created in response to an individual storm event (in the case of debris flows and stream-channel deposits) or sudden failure of part of the headwall against which the sand ramp is accumulating (in the case of rockfall deposits). Thus, they provide no information about the chronology of sand-ramp formation, other than to indicate occasional high-magnitude events delivering coarse particles into an otherwise aeolian system. There is (also) some difficulty in interpreting these coarse particles as talus as they do not evidently accumulate close to their source and may be size sorted in places. Those in Jordan that have been interpreted as rockfall deposits are reported to fine in the downslope direction, which is contrary to the norm for rockfall deposits where the greater
momentum of the larger particles and their lower susceptibility to trapping typically carries them further (Selby, 1993: 353).More likely, the particles owe their origin to rockfall from the backing rock slope, but they owe their current location to subsequent transportation across the ramp surface, as suggested by Bertram (2003).
3. Study area
The field evidence in this investigation concentrates on a single sand ramp in the Mojave Desert at Soldier Mountain in the Cady Range, California, USA (grid ref: 34° 56 21 N, 116° 34 , 50 W, quarry elevation c. 550 masl) where quarrying has exposed the internal in situ sand ramp stratigraphy. This extensive access to the stratigraphy of a sand ramp is to the authors' knowledge without equal therefore providing a unique opportunity to understand better the processes associated with sand ramp formation. The site has been studied previously (e.g. Rendell and Sheffer, 1996; Lancaster and Tchakerian, 1996; Clarke and Rendell, 1998) and shown to be of considerable regional significance (e.g. Lancaster and Tchakerian, 2003), but these studies have not explicitly linked the sand ramp stratigraphy to the luminescence chronology. In addition, inferred aspects of the stratigraphy (e.g. the presence of palaeosols and horizons of talus bounding aeolian units; Lancaster and Tchakerian, 1996), and the general relationship of the sand ramp to the basin history in which it resides are somewhat ambiguous. Using this site as a type-example, therefore, the present study presents a new chronostratigraphy for the sand ramp to look at its accumulation history. Sediment particle size and magnetic characterisation are used to look for evidence of past soil development within the sand ramp, while luminescence dating is employed to bracket the stone horizons (the ‘talus layers’ of Lancaster and Tchakerian, 1996) to establish how quickly they formed. In addition, new data from a stone movement experiment allied to an understanding of regional slope processes are examined in order to improve understanding of any possible relationships between periods of stone horizon formation and periods of aeolian sediment deposition.
3.1. Setting
south of the current Mojave River channel which is assumed to be the single main source of aeolian derived material to the sand ramp. Dominant present-day sand-transporting winds in this region are consistently from a westerly direction (Zimbelman et al., 1995).
In the context of the regional palaeoenvironment, the sand ramp sits on the eastern edge of the Lake Manix Basin upon which a range of studies have been undertaken (e.g. Meek, 1989; 1999; Jefferson, 2003; Reheis and Redwine, 2008; Fig. 2). This basin was the effective sump for the Mojave River system until the Late Pleistocene (Reheis and Redwine, 2008). High-stands for Lake Manix have been recorded up until 27–25 ka after which the Mojave system drained eastwards to the Lake Mojave Basin (Reheis et al., 2007). The draining of Lake Manix led to the eventual cutting of Afton Canyon, the drying of Lake Manix, and the periodic filling of Lake Mojave, which itself eventually completely dried by 8.5 ka (Reheis and Redwine, 2008 and references therein). Past regional chronological assessments of aeolian systems in these basins (e.g. Lancaster and Tchakerian, 1996; Rendell and Sheffer, 1996; Clarke and Rendell, 1998; Kocurek and Lancaster, 1999) have linked aeolian sand transport and deposition in this region (including the emplacement of sand ramps) to the draining of Lakes Manix and Mojave, and the subsequent increased availability of sediment from the lake shorelines, exposed deltas and the ephemeral Mojave River (Enzel et al., 2003; Wells et al., 2003; Miller et al., 2010).
Within the current Manix Basin there are two ephemeral lakes. Coyote Lake sits in a sub-basin approximately 20 km NW of Soldier Mountain, and Troy Lake sits approximately 10 km to the south (see Fig. 2). During the period directly after the draining of Lake Manix (24 ka to 14 ka; Reheis and Redwine, 2008), there is some evidence of periodic diversion of flow from the Mojave River both into Troy and Coyote Lake (e.g. Meek, 1989; 2004), with the latter matching periods in which Lake Mojave levels were known to fluctuate (e.g. Wells et al., 2003; Miller et al., 2010). It is also clear that the Mojave River changed course in this period (see Fig. 2 inset), and some evidence exists for the beginnings of stable channel emplacement at the current channel location to have occurred sometime between 15 and 12 ka (e.g. Reynolds and Reynolds, 1994; Reheis and Redwine, 2008; Miller and Dudash, 2009).
[image:5.612.68.546.347.698.2]The sand ramp itself, in common with other similar ramps and topographically anchored aeolian deposits in the region, is mantled by a veneer of angular clasts which we assume to have been derived from the adjacent mountain front. The contact between the ramp's top surface and the mountain front displays sediments lapping directly onto the rock slope at angles between 5° and 11°. The sand ramp is cut by river channels emanating from the adjacent mountain front
Fig. 3. A. 3D rendering of the location of stratigraphic/topographic sections and experimental sites at the SoldierMountain sand ramp (general aspect towards the East). Quarry sections A, B and C (cross-hatched) are flagged. Area D (horizontal hatching) represents the approximate extent of unit Ia. Line E represents the location of a surface DGPS profile over the top of the sand ramp. Line F–Frepresents the approximate location and orientation of the terrace at the base of the sand ramp. Points 1 to 8 represent the locations of experimental stonemovement measurement stations on the surface of the neighbouring sand ramp. Image courtesy of Google Earth.
.
which flow the short distance NW towards the Mojave River (see Figs. 2, 3). The ramp is also truncated at its western end by a terrace (Line F in Fig. 3; possibly the 543 m Lake Manix shoreline of Meek, 1989). The Soldier Mountain sand ramp has been worked as a quarry thereby revealing internal stratigraphy. On the opposite (eastern) side of Soldier Mountain to the sand ramp there is an active falling dune consisting of well-sorted coarse sands which represents contemporary transport of material from the nearby Mojave River.
4. Stratigraphy
To elucidate the stratigraphy, a number of sections were logged in the Soldier Mountain quarry (see cross-hatched area in Fig. 3), The locations of these sections along with other key features of the site are recorded in Fig. 3. Sections A and B were obtained from vertical faces in the northern part of the quarry. Section C has been derived from vertical faces in the southern part of the quarry. Summary stratigraphic logs are presented in Fig. 4. The elevations of the top and bottom of each section, as well as a number of intermediate ledges, were derived using digital GPS, and all measurements were tied to USGS datum. A number of cross-sections of the top surface of the sand ramp were also surveyed, and one of these (E to E in Fig. 3) is used here as an example. Details of the main stratigraphic units described in these sections are outlined below, and compared directly to previous work. Photographs outlining some of the sedimentological characteristics of each unit are provided in Fig. 5.
4.1. Basal units Ia and Ib
In the base of the quarry two principal units were observed. The first (Ia) is a red brecciated igneous deposit that was exposed at the entrance to the quarry (Fig. 3 point D). Unit Ia is assumed to be at least of Tertiary age. The second unit (Ib) formed the quarry floor, with limited exposures in the northern
and central parts of the quarry (sections A and B; Fig. 4). This unit comprises a weakly bedded grey/ blue fine-grained deposit, the top of which rarely exceeds 546 masl. Unit Ib is interpreted as being former Lake Manix sediment, which conforms to Reheis and Redwine (2008) who noted local Lake Manix high-stands (indicated by beach ridges) at 543 and 557 masl (using the same elevation datum as this paper).
4.2. Unit II
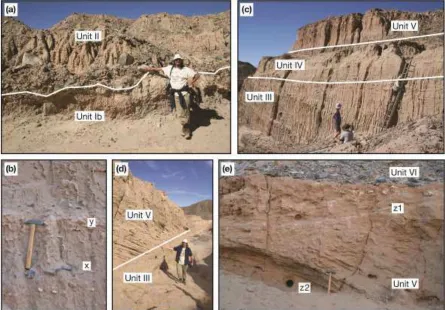
Lying directly above these basal units is a heterogeneous but pervasive 2–3 m-thick unit (II) which includes locally-derived coarse angular boulders and pebbles in a sandy matrix, varying from clast-supported to matrix-supported in section. This unit is interpreted as a debris flow unit as within it could be seen occasional, exposed cross-sections through channelised/confined debris flow events (see Fig. 5a) which varied in size from 1 to 5 m in width. These cross-sections display typical levée and channel deposits indicative of multiple phases of transport. The unit was exposed clearly in both the northern and southern parts of the quarry (sections A, B and C), and is equivalent to unit 1 of Lancaster and Tchakerian (1996) (Fig. 4). The contact between this unit and units Ia/b (Fig. 5a) is normally quite sharp, and the contact surface often undulose in cross-section. In terms of process, this unit suggests the existence of high runoff on steep slopes with substantial debris available for mobilisation.
4.3. Unit III
Fig. 4. Summary stratigraphy for the Soldier Mountain sand ramp, outlining the major units exposed. Sections A and B are a summary of stratigraphic logs taken from the vertical faces exposed the northern part of the quarry. In section A, the square boxes represent sample locations for grain size analysis. Section C is a summary of logs taken fromthe southern part of the quarry. A summary stratigraphy for the central part of the SoldierMountain deposit is also provided, as well as (for reference) a comparison section from Lancaster and Tchakerian (1996). Figures next to the sections are the DGPS altitudes in masl relative to local Ordnance Datum for exposed ledges and stratigraphic boundaries. Locations of grain size samples (G/S) and luminescence samples (OSL) are also noted.
rhizocretions) which are inferred to have formed at the near-surface (Nash, 2011). Some of these angular stone horizons provide a semi-continuous (over 8–12 m in section on some occasions) stratigraphic markers with a thickness of 1–2 clasts within the sequence of Aeolian sands (e.g. section A; Fig. 5c). If these stone horizons were of true talus origin then it would be assumed that they formed through rockfall or avalanching of material to the surface of the sand ramp from the adjacent mountain front. In some instances these stone horizons with angular clasts are associated with poorly developed nodular calcrete layers which often display evidence of root traces (see Fig. 5b).However, more often than not the angular stone horizons were seen to be discontinuous in section. In addition, calcrete layers were also commonly observed in the absence of angular clastic material; especially in the upper part of the unit on the southern side of the quarry. Thus, based on initial stratigraphic observations alone, the direct association between the stone horizons and the aeolian sediments and calcrete deposits immediately in their vicinity was not easy to infer; nor was the mechanism whereby the clasts have been emplaced. On occasion, small (b1 m wide) constrained alluvial/fluvial channel deposits of sand and pebbles were observed in this sequence, suggesting that some surface flow of larger clasts was possible. However, these channel deposits were often found in apparent isolation within the aeolian sequences, seemed to cross cut them, and were rarely seen to be directly stratigraphically linked to the stone horizon units which often bracketed them. In summary, our assessment of the non-aeolian
sediments within unit III suggested that significant further work was required in order to understand the processes leading to their emplacement. This unit is broadly equivalent to units 2–5 of Lancaster and Tchakerian (1996) (see Fig. 4).
4.4. Unit IV
This is a 2–3 m-thick unit of thinly bedded and generally well sorted medium sands largely devoid of angular stone clasts or horizons (Fig. 5c). The lower part of this unit is light pink, while the upper part bleached/white. This unit was most clearly observed in the northern part of the quarry (sections A and B; Fig. 4). In the southern part of the quarry (section C) the unit is not apparent, which could indicate pinching out to the south, perhaps indicative of a more northerly influence of the source. The upper part of this unit contains abraded ostracods (identified as Limnocythere ceriotuberosa, a species which dominates the Lake Manix core; Reheis and Redwine pers. comm.). This unit is interpreted as an aeolian unit which includes material re-worked from Lake Manix deposits. Generally, it is equivalent to unit 6 of Lancaster and Tchakerian (1996) (see Fig. 4).
4.5. Unit V
Fig. 5. Sedimentological characteristics of units within the Soldier Mountain Sand Ramp showing: (a) the contact between units Ib and II; (b) the presence of angular clasts (x) and calcrete nodules/rhizocretions (y) within unit III; (c) the location of unit IV in section A and its stratigraphic relationship with unit III and unit V; (d) the sharp contact between unit III and unit V in the southern part of the quarry highlighting the well exposed tabular foresets in the upper unit; (e) a close up of a portion of unit V showing the presence of calcrete associated with some of the bedding planes (z1), the overlying coarse material on the surface of the sand ramp (unit VI) and the location of luminescence sample points (z2)..
in particular, is cross-bedded (see Fig. 5d) with nodular calcrete layers on the surfaces of some of the foresets (see Fig. 5e). The foresets indicate an approximate south or south easterly sand transport direction with free bedform migration over the surface of the sand ramp. The presence of free dunes on the surface of sand ramps has been observed as a component of the top surface stratigraphy of sand ramps by Bertram (2003), and can also be observed on the surface of the sand ramp in the East Cronese Basin, Mojave, USA (35° 08 03 N, 116° 17 , 30 W; see Clarke et al., 1996a, 1996b). In the southern part of the quarry, the cross-bedded unit is mantled directly at the surface by coarse locally-derived angular clasts. In the northern part of the quarry it is overlain by a more massive unit of similar hue that was less obviously cross-bedded and then a top surface of locally-derived angular clasts. These units are equivalent to units 7 and 8 of Lancaster and Tchakerian (1996) (see Fig. 4).
4.6. Unit VI
Directly on top of unit V there is a continuous unit of course, angular and often tightly packed clasts (thickness 1–2 clasts) which mantle the entire sand ramp. Generally, the clast size decreases down-slope from the mountain front (with mean clast size in the range 40–60 mm), and in some places in this unit we see some evidence of soil and desert pavement development directly below this. This unit is cut by the incised channels which dissect the sand ramp. Similar units have been described on the surface of all sand ramps in the Mojave (Lancaster and Tchakerian, 2003; see Fig. 1a), and Bertram(2003) describes consistent debris cover and rock
fragments associated with desert pavements on the top of Namibian sand ramps. Similarly, Thomas et al. (1997) also describe ‘talus gravels’ of a similar nature on the top surface of sand ramps in Iran (see Fig. 1e).
4.7. The significance of stratigraphical interpretations of the development of the Soldier Mountain Sand Ramp
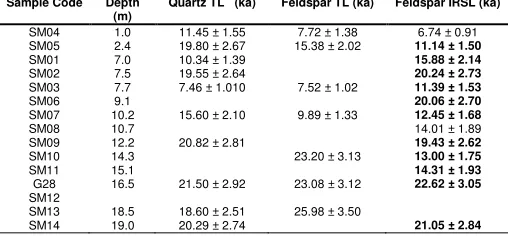
Table 2. Luminescence ages from Soldier Mountain sand ramp (Rendell and Sheffer, 1996). Note ages are ranked by depth and those emphasised in bold are those selected for the palaeoenvironmental reconstruction of Clarke and Rendell (1998).
Sample Code Depth (m)
Quartz TL (ka) Feldspar TL (ka) Feldspar IRSL (ka)
SM04 1.0 11.45 ± 1.55 7.72 ± 1.38 6.74 ± 0.91 SM05 2.4 19.80 ± 2.67 15.38 ± 2.02 11.14 ± 1.50
SM01 7.0 10.34 ± 1.39 15.88 ± 2.14
SM02 7.5 19.55 ± 2.64 20.24 ± 2.73
SM03 7.7 7.46 ± 1.010 7.52 ± 1.02 11.39 ± 1.53
SM06 9.1 20.06 ± 2.70
SM07 10.2 15.60 ± 2.10 9.89 ± 1.33 12.45 ± 1.68
SM08 10.7 14.01 ± 1.89
SM09 12.2 20.82 ± 2.81 19.43 ± 2.62
SM10 14.3 23.20 ± 3.13 13.00 ± 1.75
SM11 15.1 14.31 ± 1.93
G28 SM12
16.5 21.50 ± 2.92 23.08 ± 3.12 22.62 ± 3.05
SM13 18.5 18.60 ± 2.51 25.98 ± 3.50
SM14 19.0 20.29 ± 2.74 21.05 ± 2.84
interpret, are: (i) the presence of a large number of discontinuous stone horizons made up of locally-sourced angular clasts which are mostly found within the intermediate aeolian unit (III), and (ii) the absence of any real evidence for palaeosols that can be directly associated with them (in units III, IV or V).
5. Sand ramp chronology
Previous age determinations for the Soldier Mountain site (Rendell and Sheffer, 1996) were undertaken to provide a chronology for the sand ramp rather than to understand the temporal component of the stone horizons (Table 2). For the present study new samples were collected for OSL targeting just above and below stone horizons, to see, in addition to checking the site chronology, if it was possible to establishwhether the stone horizons represented a significant temporal hiatus in sedimentation or not.
5.1. OSL methodology
Quartz was extracted and cleaned from the new Soldier Mountain samples under low-intensity red lighting at the Sheffield Centre for International Drylands Research Luminescence Laboratory. To achieve this extraction, organics and carbonates were removed with HCl and H2O2, and quartz was separated from heavy minerals with a density separation using sodium polytungstate (S.G. 2.7 g cm−3). A 45-minute 40% HF etch and sieving was used to remove heavily etched lighter minerals. No significant contamination was observed when prepared samples were tested using infrared stimulated luminescence. OSL measurements were carried out with a TL-DA-15 Risø automated luminescence reader with stimulation via blue diodes and signal detected through a 7.5 mm Hoya U340 filter. De values were derived using the single aliquot regeneration (SAR) protocol (Murray and Wintle, 2003) with four regeneration points and a recycling dose and an experimentally determined preheat
temperatures of 180 °C for 10 s. Multiple replicates of each sample were measured (minimum of 24 aliquots) to give an indication of De reproducibility. All samples exhibited OSL decay curves dominated by the fast component and therefore rapidly bleachable, low thermal transfer and good recycling. The replicate De distributions of all samples are normal with an additional few(1–3) aliquots with larger De values. The latter were regarded as outliers and excluded from further analysis. Based on these distributions and low over-dispersion (OD) values (average OD=15%) the samples are considered to have been reset prior to burial. The central agemodel (Galbraith et al., 1999) was used to generate mean De values for the final age calculations.
Dose rates were determined from in situ field measurements made with an EG&G Micronomad field gamma-spectrometer and attenuated for sediment size and palaeo-moisture contents (based on present day values with a 2% absolute error to incorporate any past changes; Table 3). Gamma-spectrometer results were compared to those obtained with ICP-MS. Comparison between these two techniques returned ratios within errors of unity for K (0.95±0.07) and Th (1.03±0.3) validating the assumption that the dose rate is in secular equilibrium for these two elements. While Uwas a little low (0.9±0.3) it is thought this small discrepancy may reflect the fact that ICP measured the sediment sampled while the gamma-spectrometer measured sediment in a wide sphere around the sample, which is more likely to incorporate any heterogeneity within the sediment. Cosmic dose rates were determined following published algorithms (Prescott and Hutton, 1994).
5.2. Chronological interpretations of the development of the SoldierMountain sand ramp
[image:9.612.43.297.99.217.2]As shown in Table 3, ages are presented with one sigma uncertainties in ka from the year of measurement (2009). Results, with one exception, show an increase in age with depth. The age from the debris-flow derived sediment underlying the sand ramp (unit II; Shfd09023; 15.0±1.0 ka) indicates that this deposit is significantly older than the overlying sand ramp sediments (Fig. 4) forming at a time after the demise of Lake Manix but while significant overland flow was occurring. The ages from unit III (the main body of the sand ramp) have a maximum range of 11.6±0.8 ka to 8.3±0.6 ka (although the stratigraphically highest sample from unit III returned an age of 10.3±0.7 ka). The cross-bedded sand unit (unit IV) has an age of 9.5±0.6 ka. These new OSL results are consistently younger than those reported by Rendell and Sheffer (1996; Table 2). Whereas the chronology of Rendell and Sheffer (1996; Table 2) indicated that Soldier Mountain developed over a 10 ka period between ~10 and 22 ka. The newOSL chronology implies a much younger and more rapidly accreting chronology
Table 3. OSL related data and ages.
Unit Lab. Code Depth (m) Water
content (%) K (%)U (ppm)Th (ppm)
Total dose ratea
(Gy ka1) N b De (Gy) OD c (%) Age (ka)
IV Shfd09027 5.0 0.5±2 2.61 1.52 7.93 3.26±0.18 19(20) 31.24±0.78 11 9.5±0.6
III Shfd09025 6.5 0.6±2 2.64 1.66 7.79 3.26±0.18 17(20) 33.6±1.04 13 10.3±0.7
III Shfd09026 7.9 0.3±2 2.89 1.62 7.04 3.43±0.20 15(18) 28.51±1.06 14 8.3±0.6
III Shfd09029 15.9 0.2±2 3.03 1.58 7.90 3.61±0.21 20(21) 41.1±1.90 21 11.4±0.8
III Shfd09028 16.3 0.2±2 3.01 1.38 7.23 3.55±0.21 18(21) 41.21±1.51 15 11.6±0.8
III Shfd09024 19.6 0.6±2 2.77 1.70 8.59 3.39±0.19 17(20) 48.16±1.4 15 11.3±0.8
II Shfd09023 18.5 0.6±2 2.74 2.67 6.5 3.26±0.18 20(20) 49.31±1.72 15 15.0 ±1.0
aDose rate based on analysis of sediment by in situ gamma-spectroscopy and verified with ICP-MS.
bnumber of replicates upon which D
for the sand ramp forming in the period between ~11.6–8.3 ka and probably 11.6–10.3 ka. It is hard to correlate exactly the new results with those of Rendell and Sheffer (1996) due to the lack of stratigraphical information provided by the latter. However, it is noted that the chronology of Rendell and Sheffer (1996) has high age uncertainties and age reversals, probably in part reflecting the older luminescence methods employed (multiple aliquot thermoluminescence (TL) and to a lesser extent, infra-red stimulated luminescence (IRSL)) which have greater potential to incorporate within them any antecedent signal unrelated to burial age (Lian and Roberts, 2006). This is of concern given some sand ramp sediment is of colluvial/fluvial origin and full exposure to sunlight prior to burial cannot be assumed. IRSL is now known to suffer from sensitivity changes and anomalous fading problems lead to age underestimation problems (Lian and Roberts, 2006; Lamothe and Auclair, 1999). The new ages, through use of the more light sensitive quartz and the OSL and through basing the ages on multiple single aliquot replicates (minimum 24) from which outliers were excluded, we believe to have better mitigated any effects of antecedent signal unrelated to burial age. The new OSL data (when taking into account their associated error limits) also appear more stratigraphically consistent (with only one age reversal), have smaller uncertainties and fit well with independent palaeoenvironmental data from the region (see discussion below; Fig. 11), and thus have been adopted for following discussion purposes.
Overall the new chronology indicates rapid accumulation of the sand ramp over a maximum period (taking into consideration age uncertainties) of less than 5 ka and more probably less than 3.4 ka (based on age of uppermost sample). Sediments from 19.6 m to 15.9 m (Shfd09024, Shfd09028, Shfd09029) are within errors of each other and appear to have been deposited around 11.4±0.8 ka with a sedimentation rate between 1.74 and 3.3 m/ka. Sediments above this group are younger ranging in age from 8.3±0.6 to 10.3±0.7 ka. Unfortunately, the upper paired samples above and below stone horizons, show an age reversal. However, the lower pair (Shfd09028 and Shfd09029) are almost identical in age and are within one sigma errors of each other. If age uncertainties are taken into consideration, this result indicates that the stone horizons represent a maximum of 1.8
ka and probably a much shorter time period based on the number of other stone horizons, the lack of identifiable soils (see section 6.1 below) and the interpreted maximum time it took to accumulate the whole sand ramp.
6. Sedimentological characteristics
Lancaster and Tchakerian (1996) identified six “palaeosols” in the SoldierMountain sand ramp beneath the level of the cross-bedded sand of unit V, often beneath ‘talus’ (stone) horizons. They argued that the presence of palaeosols indicated periods of geomorphic stability of the sand ramp during the Late-glacial period. However, no direct supporting evidence was presented in order to confirm the interpretation and, as already seen, the chronology of Rendell and Sheffer (1996) fails to convincingly support (due to age reversals and large error certainties) Lancaster and Tchakerian's contention. As also discussed above, the uncertainties associated with the new OSL data bracketing stone horizons still leave potentially hundreds and perhaps more than a thousand years for soil development associated with the stone horizons if these do indeed represent palaeo-surfaces. To investigate whether palaeosurfaces are associated with the stone horizons, particle size and magnetic susceptibility were employed to characterise the sediments and establish the location and nature of any palaeosols.
6.1. Mineral-magnetic and particle size methods
[image:10.612.151.463.514.705.2]Many studies of Late Quaternary palaeosols have used mineral magnetic measurements in order to confirm their presence in loess deposits (e.g. Evans et al., 1997; Dearing et al., 2001; Evans and Heller, 2001; Maher et al., 2003; Feng et al., 2004; Avramov et al., 2006; Jordanova et al., 2007), and several studies have reported enhancement of magnetic susceptibility and frequency-dependent susceptibility in soils that are attributable to climate and pedogenesis (e.g. Maher, 1986; Maher et al., 1994; Dearing et al., 1996; Singer et al., 1996; Walden et al., 1998; Oldfield, 2007). To our knowledge no attempt has been made to make similar measurements on palaeosols in sand ramps and only a small number of studies (e.g. Sandgren and Thompson, 1990; Newsome and Walden, 2000) have attempted to
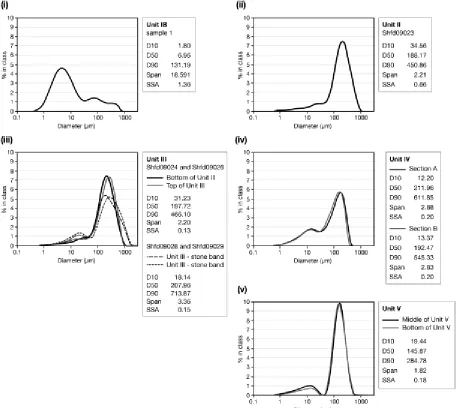
Fig. 7. (a) Particle size distributions outlining the grain size characteristics of the main sedimentary units at Soldier Mountain: (i) unit IB, (ii) the OSL samples taken from unit II, (iii) unit III, (iv) unit IV, and (v) unit V from sections A and B. Sample locations for the OSL samples used here can be found in Fig. 4. In each case, these samples represent particle size data for sediments that were not associated with stone horizons. Inset data refer to values for D10, D50 D90 (in mm), Span and SSA.(b) Particle size distributions for the samples taken from unit III that were subjected to an analysis of their environmental magnetism in order to establish the possibility that these were palaeosols; see Fig. 6 for sample locations. (i) sample location 5, (ii) sample location 4, (iii) sample location 3, and (iv) sample location 2. At each sample location c.10 sub-samples were collected at 5 cm intervals above, within and below stone horizons covering a total sample interval of 50 cm. In this case, sub-samples were averaged from 15 cm above, 20 cm within (middle), and 15 cm below the stone horizons to investigate particle size variability within the supposed ‘palaeosols’.
specifically characterise the mineral magnetic signatures of sandy soils. While the former study demonstrated that frequency dependent magnetic susceptibility was enhanced in topsoil and in the finer soil fractions, it was undertaken in a cool temperate environment totally unlike that of the Mojave. The latter study, undertaken in Western Australia, failed to measure frequency dependent susceptibility as the initial measurements of low frequency susceptibility were too low to have confidence in the calculation of the frequency dependent signature. More recently, Lyons et al. (2012) reported results from a study of the mineral magnetic properties of dusts and sands in Niger in areas where annual rainfall minima are b100 mm in the north of the country. Lyons et al. (2012), and papers reviewed therein, confirm that a frequency-dependent susceptibility significantly greater than 2% would be strongly suggestive of the presence of magnetic grains at the superparamagnetic/singe domain boundary commonly associated with weathering and pedogenesis and their measurements of fd% produced values significantly greater than 2%. They confirmed the presence of pedogenically
derived magnetic grains using a bivariate plot of arm/ fd against arm/ lf and compared this with a characteristic envelope curve of soils and palaeosols across Europe and Asia produced by Oldfield (2007) to confirm that most of their bulk and particle-size fractionated samples evidenced magnetic minerals produced by pedogenesis.
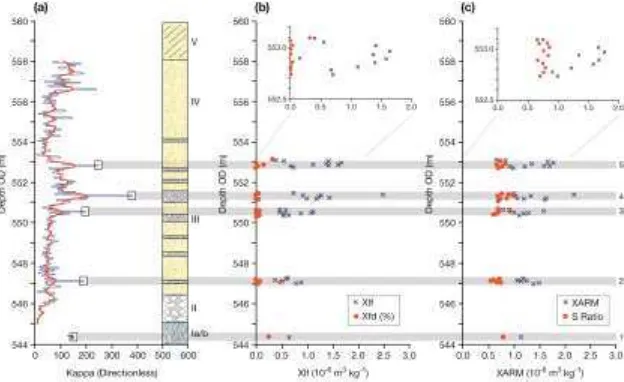
Field measurements of magnetic susceptibility ( ) were made at 5-cm intervals on one profile (Fig. 4, profile A; Fig. 6) in order to sample across four potential palaeosols within unit III. Measurements were made using a Bartington Instruments MS2 susceptibility and MS2E surface scanning probe on freshly cleaned faces. A range of samples was also collected from selected units for particle size and further mineral magnetic analysis in the laboratory (see Fig. 4 profile A for sample locations).
Fig. 7 (cont)
IRM−0.1T) and the S ratio and HIRM (mass-specific high field remanence; calculated as the difference between remanence at 0.88 and 0.1 T) were calculated. Details of the measurement and calculation methods are given by Walden et al. (1998), Foster et
al. (2008) and Lyons et al. (2012).
Particle size analysis was undertaken in triplicate on all samples using a Malvern Mastersizer particle size analyser following destruction of organic matter, in order to establish whether mineral magnetic signatures were controlled by changes in the particle size distribution of the sediments. Several parameters describing particle size were extracted from the analysis (D10, D50 and D90; respectively, the diameter of the 10th, 50th and 90th percentiles of the distribution in microns), Span (a dimensionless sorting index; (D90–D10)/D50) and the Specific Surface Area (calculated by assuming all particles in the particle size distribution are spherical (m2 g−1)) (Foster et al.,
1998).
6.2. Environmental magnetism results
Fig. 6a plots the down-profile signatures from profile A. This
profile suggests that those layers which might be interpreted as
‘palaeosols’ have enhanced values by factors between 3 and 7
above underlying and overlying sedimentary units. Selected mineral magnetic signatures of the four ‘palaeosols’ analysed in detail (Fig. 6: samples 2 to 5) are presented in Fig. 6b/c and show significant enhancement in all susceptibility and remanence characteristics. All samples within these ‘palaeosol’ horizons were also found to have a much softer S-ratio (>0.60), indicative of the presence of ferromagnetic minerals. However, unusually, fd% values are barely detectable in these sections, with values reaching only a maximum of ~0.5%, despite laboratory readings of volume susceptibility generally being well in excess of 30 and often exceeding 100. For comparative purposes, an analysis of the buried Lake Manix sediment measured a fd% value of only 0.25% (see Fig. 6; sample 1). Enhancement of fd% to values of
~8% was used by Dearing et al. (2001), for example, to suggest the presence of palaeosols in the loess deposits of the Matmata plateau of central Tunisia, while Lyons et al. (2012) report significantly enhanced fd% values in the dusts and sands of Niger to confirm the likely presence of pedogenicminerals and showthat a large proportion of their samples plot within the envelope curve of palaeosols based on the bi-variate plot of
arm/ fd against arm/ lf. Calculation of these ratios on samples taken from the Soldier Mountain sand ramp shows that none of them fall within this envelope curve. The presence of pedogenically-derived mineral magnetic grains is therefore not apparent in the supposed ‘palaeosols’ of the Soldier Mountain sand ramp.
The significant changes in both the kappa profiles of Fig. 6a and the laboratory measurements of Fig. 6b/c could be interpreted as indicative of possible changes in the sediment sources contributing material to the Soldier Mountain sand ramp. However, many studies have shown that mineral magnetic signatures can be controlled by the particle size distribution of the sediments (Foster et al., 1998; 2008) and this possible control on the mineral magnetic signatures is explored in the next section.
6.3. Particle size analysis
From the summary particle size data it is evident that the underlying Lake Manix sediment from unit IA (Fig. 7a (i)) is significantly finer than the samples from any other unit sampled in the sequence, and has a dominant mode at or around 6–8 m. It
has a small proportion of sediment coarser than 500 m which
may indicate that this location was close to a littoral zone as it contains sediments too coarse to be transported to deep water. This material does not appear as a
dominant component of the Soldier Mountain sand ramp, and is also magnetically distinctive from the overlying sand ramp sediments (see Fig. 6a). The fine sediments sampled within unit II
(Fig. 7a (ii)) are relatively well sorted, have a D50 and dominant
mode at around 190 m, and seem to be of predominantly aeolian origin. The sediments from the very top and bottom of unit III (Fig. 7a (iii)), are similar in nature and have a D50 and dominant mode
at or around 200 m, and a subordinate mode and D10 at
approximately 15–30 m. However, a marked increase in both
D50 (>200 m) and D90 (>700 m), was observed near the stone
horizon which suggests that there is an influx of coarse sand probably of non-aeolian origin associated with these horizons. Unit IV,which incorporates some lake-derived material,
nevertheless has a D50 of 212 m (section A) and 192 m
(section B); both of which are broadly comparable to the aeolian units directly below. The unit IV samples from both sections are not particularly well-sorted (Span>2.8), and while they do have an increase in the fine component (D10 12–13 m), they show no evidence of the dominant fine mode apparent in unit 1B.Moving up to unit V (Fig. 7a (iv)), itwas also observed that the particle size distribution becomes extremely well sorted (Span~1.8), with a
dominant mode and D50 at approximately 145 m. This is
consistent with interpretations of a uniform aeolian origin for this unit.
The particle size distributions of the samples from unit III
collected at 5 cm increments across supposed ‘palaeosol’
horizons (Fig. 7b) fall into two distinct groups. The upper two
‘palaeosols’ (Fig. 6: samples 4 and 5; Fig. 7b (i) and (ii)) are extremely variable (with Span values of >4). These samples display tri-modal distributions with two modes at approximately 15
m and 120 m, which we have seen previously. In addition, these samples also have a mode at 400 m, which signifies an
influx of sand that is unlikely to be of aeolian origin as noted earlier. Above and below the stone horizons at these locations (particularly in Fig. 7a (i) and (ii)) there is a transition in the
particle size data, such that the presence of the 400 m mode
diminishes as we go from samples between 15 cm below and
above the stone horizon. The lower two ‘palaeosols’ (Fig. 6: samples 2 and 3; Fig. 7b (iii and iv)) are more consistently
bimodal (Span valuesb3)with a dominant mode at ~300 m and ~130 m, respectively, and a common secondary mode at ~15– 30 m. Here there is less variability in particle size as we move
across the stone bands.
Overall, the high kappa, susceptibility and remanence
properties within the ‘palaeosols’ in unit III of the sand ramp (see
Fig. 6a) appear to be associated with sediments that have a
coarse third mode in the particle size distribution. This association suggests a different sediment source from that of those sediments deposited elsewhere in unit III (and other units sampled). The fact that the sediments are coarser also supports the argument for an absence of palaeosols as the particle size distributions in
‘palaeosols’ would likely be finer than the potential ‘parent’
material found below from which these units would have been derived as a result of weathering and pedogenesis (e.g. Ellis and
Mellor, 1995; Liu et al., 2004). Importantly, throughout these data
there was found to be no statistically significant correlation (pb0.05) between any of the magnetic signatures and the particle size characteristics of the deposited material at the sample sites.
6.4. The significance of the sedimentology to the development of the Soldier Mountain sand ramp
Overall the sedimentological characteristics, encompassing environmental magnetic and particle size data, suggest that the sediments within the sand ramp may have been derived from a range of different sources. The sedimentological evidence and the discussion provided above certainly indicate that sand ramps accumulate sediment from local sources (proximal mountain fronts) as well as sources upwind of the site. While detailed source tracing work has yet to be undertaken on these sediments, mineral magnetic signatures are indicative of changes in sediment source over the timescale in which the ramp was formed.
Laboratory analysis of the magnetic and particle size signatures of aeolian sands within unit V provides further evidence to suggest a reasonably high level of internal uniformity and a common source. However we can see some divergence between this and aeolian sands in underlying units (e.g. II III and IV) which suggests that sources of aeolian sediments may have changed in the timescale of sand ramp formation. Based on the presence of ostracods, we can assume that reworking of Lake Manix sediments did occur in unit IV. However, based on grain size and mineral magnetic signatures we can see no further evidence for the incorporation of Lake Manix sediments in other units.
The possible presence of six ‘palaeosols’ in the Soldier Mountain
sand ramp as suggested by Lancaster and Tchakerian (1996),
Clarke and Rendell (1998) and Rendell and Sheffer (1996) is not
confirmed by the mineral magnetic analysis of samples taken
across ‘palaeosol’ boundaries. There appears to be some
enhancement of several mineral magnetic signatures but these do not appear to be controlled by the presence of fine (0–0.03 m) superparamagnetic grains that would be expected to contribute to a high frequency dependent signature (Lyons et al., 2012). Rather, the trends in other parameters, such as the S-ratio,might indicate that these periods may have been associated with a change in sediment source rather than any period of protracted pedogenesis.
7. Stone movement within sand ramps
In the literature, the presence of discontinuous horizons of coarse rock fragments, at most a few fragments thick, has been attributed to four processes: (1) fluvial deposition, (2) debris-flow accumulations, (3) colluviation, and (4) stone horizon deposition.
Lancaster and Tchakerian (1996) identify fluvial, debris-flow and
stone horizon deposits within sand ramps in the Mojave Desert, of which the first is reported as being the most important, and occupying up to 42% of section thickness. For Soldier Mountain their figures are 8%, 3% and 5%, respectively. On Soldier Mountain, both fluvial and debris-flow deposits cut into pre-existing aeolian deposits, whereas the so-called stone horizon deposits clearly do not (Fig. 5c). Also the stone horizons at Soldier Mountain appear unsorted. Whether or not deflation contributes to the concentration of stones at the surface, the important issue is how they become redistributed in a layer of more-or-less uniform thickness over the surface of the sand ramp and, if similar layers of coarse particles within the aeolian deposits are also considered to be older desert pavements, how this redistribution might occur and how long it might take. To this end two approaches were undertaken. One uses regional data on downslope stone movement rates; the other employs monitoring contemporary stone movement on the Soldier Mountain sand ramp (Fig. 8).
7.1. Stone movement rates
Fig. 8. An example of the emplacement (experimental site 1; see Fig. 3) of painted lines on the surface of the sand ramp directly south of Soldier Mountain. At this site the slope is 6°, with a slope orientation of 244°. Over a two year period the movement of each clast down-slope from the line was undertaken using the methods of Abrahams et al. (1984)
Their fabric is consistent with that investigated by Abrahams et al.
(1990), which they attributed, in part at least, to runoff creep. On
the assumption that these particles are moving in an analogous way to those investigated by Abrahams et al. (1990), rates of movement obtained by Abrahams et al. (1984) might be applied to obtain a first estimate of how long such surface layers might take to develop. These authors obtained a 16-year record of particle movement on debris slopes in the Apple Valley-Barstow area, approximately 60 km to the southwest of Soldier Mountain. The particles had a mean diameter of 55.5 mm, with a range of 8 to 300mm, and are thus comparable in size to those at Soldier Mountain which ranged from 1.5 to 320 mm. For these particles,
Abrahams et al. (1984) derived two multiple regression equations
to predict the movement M of the particles over the 16-year record of observation:
M = 34:67 X 1.09D−0.92 and M = 9217 1:5D−1.01
In which D is particle diameter (mm), X is distance to the divide (m) and S is the slope (tangent), with an R2 of 0.44 and 0.32 respectively (and standard error of 0.46 and 0.54 log units). Applying Eq. (1) using a D of 55mm and X values between 10 and 50m (the general range observed by Abrahams et al., 1984), we
can generate values of M between 0.7 mmyr−1 (X=10) and
3.9mmyr−1 (X=50). Applying Eq. (2) using an S equivalent to the maximum and minimum observed sand ramp slope angles (cf.
Bertram, 2003; i.e. 4° and 25°), and a D of 55 mm allows us to
predict that M will be in the region of 0.2 mm yr−1 (4°) and 3.2 mm
yr−1 (25°). In either case, the maximum observable rate of
movement for a typical clast would be unlikely to exceed 4 mm
yr−1. Given that we have observed layers of angular clasts in our sections to be at least 50 m in horizontal distance from the mountain front from which they were derived, we could suggest that emplacement via runoff creep at this upper rate in a manner similar to that observed by Abrahams et al. (1984) could have taken as long as 12.5 ka. From Section 5 we can see that dates for the emplacement of the entire Soldier Mountain sand ramp would take considerably less time than this.Our dates suggest that the emplacement of unit III,with the highest concentration of layered coarse particles, took between 1.6 and 4.4 ka in total.
7.2. Contemporary stone movement monitoring
Given that the study by Abrahams et al. (1984) was undertaken on debris slopes and not on sand ramps, a real possibility exists that these rates cannot be applied to stone movement over sand. Consequently, as a test of the validity of applying the equations obtained by Abrahams et al. (1984) to the particles at Soldier Mountain, we obtained similar data over a 3-year period (2007– 2010) for coarse particles (with diameter of 10–30 mm) at 8 sites on the surface of the undisturbed sand ramp directly south of the Soldier Mountain quarry. The sites stretched from the base of the sand ramp to the junction between the sand ramp and the mountain front. Slope angles varied from6° (at the base) to 26° (at the junction). At each site a 3.5-mline of angular clasts perpendicular to the slope was painted (see Fig. 8). Movement of stones on each line was monitored annually using the a approach
of Abrahams et al. (1984) (see Table 4). The location of these
sites is outlined in Fig. 3.
At each site we were able to compare our actual M values with those predicted using Eqs. (1) and (2). We can see from Fig. 9a that these data are not well matched when we invoke Eq. (1); partly perhaps as a function of the difficulty in determining distance to the divide on a sand ramp. By contrast, when we work with actual and predicted data based upon parameters which can be determined reliably in a field context (S and D) we can see from Fig. 9b that there is a reasonable match between the variables. However, although there is a good correlation between changes in observed and predicted rates, the former is over the order of three times greater than the latter suggesting that the process of runoff creep causes coarse particles to move over a sandy slope much faster than on a stony surface (and
.
Table 4. Details of data collected over three years at our eight experimental sites. For location of the study sites, see Fig. 4. D is b-axis diameter (mm) for material that moved, X is distance to the divide (m) and S is slope (tangent).
Site S (degrees) Orientation (degrees) X (m)a D (mm) M
(EQ1) predicted (mm/yr)
M (EQ2) predicted (mm/yr)
M-TOT obs Average
total at site (mm) M obs (mm/yr)
1 6.25 244 27 17.0 5.8 1.2 81.0 27.0
2 6 62 25 12.6 7.0 1.5 43.3 14.4
3 9 270 35 11.8 10.8 3.0 59.8 19.9
4 9.25 262 30 9.2 11.5 4.0 119.0 39.7
5 23 328 11 11.1 3.2 14.0 196.3 65.4
6 20 322 15 29.7 1.8 4.1 153.8 51.3
7 26 248 5 9.6 1.6 20.0 177.0 59.0
8 29 260 2 12.5 0.5 18.6 123.9 41.3
[image:14.612.42.567.600.673.2]Fig. 9. A comparison between observed and predicted stone movement from collection of three years of data from our experiment using (a) Eq. (1), and (b) Eq. (2). Values used were average observed D and S (diameter and slope) at each site. Whiskers represent one standard error in the derivation of each equation as reported by Abrahams et al. (1984).
perhaps as much as 10 times faster for some sites —Table 4); probably due to more ready undermining of the underlying sand. We therefore used the somewhat conservative regression outlined in Fig. 9b to recalibrate Eq. (2). Thus, using the previous D of 55 mm and slopes ranging between 4° and 25° we can attempt to revise upwards our estimates of M to between 0.6 and
11 mm yr−1. Fig. 10 uses the same approach and equation to chart the time taken for clasts to move over the top surface of the Soldier Mountain ramp from the source (using slopes derived from cross section E in Fig. 3). These relatively conservative estimates suggest a time scale of up to 85 ka might be required. Even if we use the maximum transport rate and steepest slopes observed, travel of these clasts could have taken in the region of 4.5 ka to travel 50 m. If we are even more bold and use the suggestion (from Fig. 9b) that transport may have been more rapid than even this (perhaps up to ten times faster than on a stony surface; Table 4) we still struggle to emplace these layers within our sections in a time of less than 1.5 ka on a slope of 25° using a revised Eq. (2); a slope figure which is quite unlikely. Ultimately, even our most optimistic figures for stone transport over the surface of the sand ramp do not match well with either the overall chronological sequence observed at Soldier Mountain in which the new OSL chronology suggests all sand-ramp sedimentation took place within b5 ka and individual stone horizons
Fig. 10. A schematic cross-section of the Soldier Mountain sand ramp based on the surface topography found at transect E (Fig. 3). Shown are slope angles (degrees) and calculations of the possible time-scale (ka) required for the movement of clasts over the surface based on the equations derived from Abrahams et al.
(1984), and stone movement rates on a neighbouring sand ramp.
8. Discussion
From the results presented here the evolution of the Soldier Mountain sand ramp can be discerned (Fig. 11). Prior to the formation of the sand ramp the area was covered by the high stand of Lake Manix forming unit 1b. When Lake Manix drained there is evidence at Soldier Mountain from ~15 ka of debris flows bringing weathered clastic material from the mountains forming unit II. This broadly fits with alluvial fan aggradation within the Mojave identified by Miller et al. (2010). Aeolian deposition at Soldier Mountain forming unit III occurred after 13.8 ka when Lake Manix and subsequently Lakes Coyote and Troy had dried up
(Reheis et al., 2007). From then sediment became available for
aeolian transportation from shoreline deposits, reworked deltaic and, once the river Mojave re-established itself, fluvial sediments
(Reynolds and Reynolds, 1994; Reheis and Redwine, 2008).
Deposition of the sand ramp in this period fits well the phase 2 of Mojave sand ramp formation of Kocurek and Lancaster (1999). The final Aeolian phase (unit IV) saw free-form dunes moving across the sand ramp reflecting either increased aridity or that accommodation space at the mountain front had been filled by the sand ramp. Two further phases have occurred on the Soldier Mountain sand ramp since the final dune phase; the development of a stone-armoured surface across the top of unit IV and a phase of dissection when valleys were formed through the sand ramp. The latter may be related to the sustained flow identified in the medieval and Little Ice Age periods (Miller et al., 2010). That these valleys have not subsequently been infilled suggests that the sand ramp is now relict: either the whole system is moribund from an Aeolian perspective or is acting only as a transportation pathway with deposition elsewhere.