This is a repository copy of Assessing the impact of framing on the comparative favourability of nuclear power as an electricity generating option in the UK. White Rose Research Online URL for this paper:
http://eprints.whiterose.ac.uk/95622/ Version: Accepted Version
Article:
Jones, C.R., Eiser, J.R. and Gamble, T.R. (2012) Assessing the impact of framing on the comparative favourability of nuclear power as an electricity generating option in the UK. Energy Policy, 41. pp. 451-465. ISSN 0301-4215
https://doi.org/10.1016/j.enpol.2011.11.006
Article available under the terms of the CC-BY-NC-ND licence (https://creativecommons.org/licenses/by-nc-nd/4.0/)
eprints@whiterose.ac.uk https://eprints.whiterose.ac.uk/ Reuse
Unless indicated otherwise, fulltext items are protected by copyright with all rights reserved. The copyright exception in section 29 of the Copyright, Designs and Patents Act 1988 allows the making of a single copy solely for the purpose of non-commercial research or private study within the limits of fair dealing. The publisher or other rights-holder may allow further reproduction and re-use of this version - refer to the White Rose Research Online record for this item. Where records identify the publisher as the copyright holder, users can verify any specific terms of use on the publisher’s website.
Takedown
If you consider content in White Rose Research Online to be in breach of UK law, please notify us by
Now published in Energy Policy:
Jones, C. R., Eiser, J. R., & Gamble, T. R. (2012). Assessing the impact of framing on the comparative favourability of nuclear power as an electricity generating option in the UK. Energy Policy, 41, 451-465.
Assessing the impact of framing on the comparative favourability of nuclear
power as an electricity generating option in the UK.
Christopher R. Jones a,*, J. Richard Eiser a,†, Tim R. Gamble b
a
Department of Psychology, University of Sheffield, Western Bank, Sheffield, S10
2TP, United Kingdom. b
Department of Psychology, University of Bath, Bath, BA2 7AY, United Kingdom..
*Corresponding author
Email: c.r.jones@shef.ac.uk (C. R. Jones)
Tel: +44 (0)114 222 6592
Fax: +44 (0)114 276 6515
Highlights
> Three studies investigate the acceptability of nuclear power in response to ‘framing’
used by government in 2007 UK consultation. > Acceptability of nuclear power was compared against four energy sources in an ‘electricity calculator’ task. > Study 1
showed an apparent increase in the endorsement of nuclear following climate change ‘framing’. > Studies 2 and 3 contradict this finding, suggesting that ‘framing’ had a
Abstract
In 2007 the UK government’s public consultation on the future of nuclear power
courted much criticism. Three studies were conducted to assess whether key
arguments used by government within this consultation might have influenced public
opinion about the technology. Participants first read a passage of text which made
salient certain positive (climate change mitigation, increased energy security) or
negative (nuclear waste) aspects of the nuclear debate. Participants then completed a
task that required them to create an electricity mix for the UK by varying the
contributions made by each of five energy sources (coal, gas, nuclear, renewables and
electric import). Study 1 seemed to indicate that pitching the debate in terms of
climate change mitigation was effective in increasing endorsement of nuclear power.
The results of studies 2 and 3, however, contested this conclusion suggesting that
these arguments were having little direct impact upon participants’ preferences for
nuclear power. The results of these studies hold implications for UK energy policy
and attitude assessment and can contribute to the understanding of how the arguments
used by government in the 2007 consultation might have influenced public opinion.
Running Head
The impact of framing on the favourability of nuclear power.
Keywords
1. Introduction
The recognised financial, environmental and humanitarian risks that could result from
a failure to mitigate climate change (e.g. IPCC 2007; Stern, 2007) are placing the
international community under ever increasing pressure to ensure rapid and
substantial reductions of Greenhouse Gas (GHG) emissions. The UK is no exception
and is committed to an ambitious target of reducing GHGs by 80% by 2050
(compared to 1990 levels), with a shorter term desire to meet a 34% reduction by
2020 (see Climate Change Act, 2008).
26%
8%
15% 22%
14% 9%
6%
Power Stations Other Energy Supply Business Sector Transport Sector
[image:5.595.100.502.326.548.2]Residential Sector Agriculture Other
Figure 1. a. The UK Greenhouse Gas (GHG) emissions by sector in MtCO2e (2009) and b.
The UK electricity mix (2009-2010) by energy source. Note: GHG emissions by sector do not
reflect savings arising from Land Use Change (Sources: UK emissions statistics: 2009 UK
figures; Fuel mix disclosure data table [2009-2010] - available from http://www.decc.gov.uk).
While the sources of GHGs in the UK are manifold, the largest single contributing
sector is electricity generation (see Figure 1; see also DECC, 2010). While recent
efforts to decarbonise this sector (e.g. through investment in renewables and fuel-47.7%
25.8% 18.0%
6.6% 1.9%
Gas Coal
switching from coal to natural gas) have helped to reduce GHG emissions, some
believe that such efforts might come at the price of reduced energy security (see
Stern, 2004; see also Bahgat, 2006). It is the triple challenge of ensuring that
electricity is not only low-carbon but that it is also secure and affordable, which has recently been used by the UK government to reopen the ‘nuclear debate’ in the UK
(see DTI, 2006a).
2. Nuclear Power in the UK
Nuclear power (NP) has been a part of the UK electricity mix for over 50 years and in
2009-2010 accounted for around 18% of electricity generated (see Figure 1b). NP is
considered to be a comparatively low-carbon, secure and affordable energy source
(see Sustainable Development Commission, 2006a, 2006b, see also Fthenakis and
Kim, 2007) and while these claims have been disputed (e.g. Friends of the Earth,
2006; Greenpeace, 2007; see also Sovacool, 2008), it was for these reasons that in
January 2008, following a period of public consultation (see DTI, 2007a, 2007b; BERR, 2008), that the then UK government gave the ‘green light’ for a new
generation of nuclear power stations in the UK. This pro-nuclear decision has since
been upheld by the new coalition government.
This pro-nuclear decision has met with considerable objections, principally due to
perceived failings in the public and stakeholder consultation process accompanying it
(see Table 1 for a recent history of the nuclear debate in the UK). For example, during
the second of two periods of consultation (May – October, 2007), prominent
Consultation Working Group (NCWG) – a group of leading experts in the energy
policy and economics, environmental risk and justice, and the social and political
sciences – questioned not only the apparent brevity and exclusivity of the whole
process but argued that the simplistic (and contentious) twinning of global warming
and nuclear power within the consultation was designed to purposefully yield pro-nuclear responses, thereby ‘rubber-stamping’ a ostensibly pre-ordained pro-nuclear
decision (see NCWG, 2008; see also Greenpeace, 2007; NIRS/WISE International,
2005).
3. Overview of Studies
In response to the assertion that the government had presented or ‘framed’
information within the 2007 consultation in order to yield pro-nuclear responses, we
conducted a series of three experimental studies. Each study was designed to
investigate what impact key arguments used by government might have had upon participants’ opinions about the use of NP in UK electricity generation relative to
other key energy sources. The impact of two psychological principles, namely
‘framing’ and ‘anchoring’ were of interest to this study and are briefly outlined below.
3.1. Framing: It has long been recognized that the manner in which an issue is presented, that is to say the manner in which an issue is ‘framed’, can exert a marked
impact upon a person’s assessment of that issue (e.g. Brewer and Gross, 2005;
Iyengar and McGrady, 2005; Jacoby, 2000; Levin et al., 1998; Tversky and
Kahneman, 1981). Further, research into a type of framing known as emphasis
attention on certain features of a debate or issue (i.e. by emphasising certain aspects or
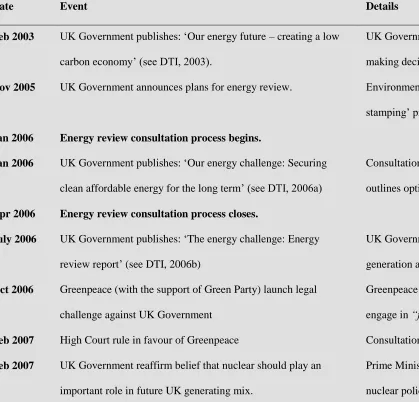
Table 1.
Nuclear Consultation Timeline
Date Event Details
Feb 2003 UK Government publishes: ‘Our energy future – creating a low
carbon economy’ (see DTI, 2003).
UK Government commits to engaging in “fullest public consultation” before
making decisions about a new programme of nuclear build.
Nov 2005 UK Government announces plans for energy review. Environmental NGOs note desire for review to be more than just a ‘rubber
stamping’ process for a new generation of NP stations.
Jan 2006 Energy review consultation process begins.
Jan 2006 UK Government publishes: ‘Our energy challenge: Securing
clean affordable energy for the long term’ (see DTI, 2006a)
Consultation document outlines progress towards goals outlined in 2003 and
outlines options for future, including possible investment in NP.
Apr 2006 Energy review consultation process closes.
July 2006 UK Government publishes: ‘The energy challenge: Energy
review report’ (see DTI, 2006b)
UK Government registers belief that NP should play a role in future UK power
generation and begins consultation on new-build.
Oct 2006 Greenpeace (with the support of Green Party) launch legal
challenge against UK Government
Greenpeace take UK Government to High Court on grounds that they did not
engage in “fullest public consultation”.
Feb 2007 High Court rule in favour of Greenpeace Consultation deemed to be “misleading”, “flawed”, “inadequate and unfair”.
Feb 2007 UK Government reaffirm belief that nuclear should play an
important role in future UK generating mix.
Prime Minister, Tony Blair, announces that the ruling would not affect their
May 2007 NP consultation process begins.
May 2007 UK Government publishes: ‘Meeting the energy challenge: A
white paper on energy’ (see DTI, 2007a).
Outlines the two principal energy challenges faced by the UK as: (1) “tackling climate change” and; (2) “ensuring secure, clean and affordable energy”.
May 2007 UK Government publishes: ‘The future of nuclear power: The
role of nuclear power in a low carbon UK economy’ & begins
second consultation (see DTI, 2007b).
Consultation document focuses on how NP could help to tackle climate change and
security of supply issues.
July 2007 UK Prime Minister undermines consultation process Prime Minister, Gordon Brown, announces Government’s decision to “…continue with nuclear power” before completion of consultation.
July 2007 Series of stakeholder, site stakeholdera and citizen deliberative
events begin.
Environmental NGOs (e.g. Greenpeace) publically exit the consultation process on
the eve of the citizen deliberative events.
Oct 2007 NP consultation process closes.
Jan 2008 UK Government publishes: ‘The future of nuclear power:
Analysis of consultation responses’ (see BERR, 2008).
Justifies the nature and design of the consultation process and includes analysis on
the responses from the public consultation, the citizen deliberative events and
stakeholder meetings.
Jan 2008 UK Government announces second pro-nuclear decision (10th
January 2008).
It is concluded that nuclear power will be a safe and affordable way of meeting the
future energy needs of the UK, while helping to fight climate change.
a
Site stakeholders are classed as interested parties (e.g. community groups, schools) located near to existing nuclear sites.
There is certainly evidence that politicians will employ emphasis framing in order to “…mobilise voters behind their policies” (Chong and Druckman, 2007, p.106; see
also Nelson et al., 1997) and, as such, it is perhaps unsurprising that some
commentators raised concerns about the possibility of this having occurred in the
2007 consultation.
However, while a belief in ‘freewheeling manipulation’ is attractive to politicians, a
growing literature contests the ease with which emphasis framing effects may be
induced, with a number of important moderators having recently been identified, e.g.
perceived source credibility (e.g. Druckman, 2001b), the presence of strong
pre-existing attitudes (e.g. Brewer, 2001; Haider-Markel & Joslyn, 2001) and access to
alternative viewpoints (e.g. Druckman and Nelson, 2003). Thus, it remains an
empirical question as to what impact the information provided to people within the
2007 consultation might have had upon their attitudes towards NP.
3.2 Anchoring: In addition to investigating the impact of emphasis framing on
participants opinions about NP, we also wished to investigate what impact the
provision of figures relating to the current use of NP in the UK power generation might have had upon participants’ opinions about NP within the consultation.
The anchoring and adjustment heuristic is one of many mental shortcuts (or ‘rules of thumb’) that people employ with making decisions or judgments (seeTverksy &
Kahneman, 1974; 1981). In short, research into this heuristic shows that the provision
can fundamentally influence the nature of the conclusions reached (e.g. Epley &
Gilovich, 2006; Gilovich et al., 2002). Indeed, particularly with unfamiliar tasks or in
uncertain situations, people will use given values or numbers as reference-points to ‘anchor’ their decisions, adjusting from them in order to reach their final conclusions
(see Fiske and Taylor, 1991).
Within the 2007 consultation, participants were provided with information about
current UK electricity generating mix, which informed participants of the relatively
large role of NP in electricity generation (18%) compared to other sources like
renewables (4%). In accordance with the principles of anchoring and adjustment, we
would argue that the provision of such information may have increased the acceptance
of NP as a generating option, compared to if no such detail had been provided.
4. Study 1
Study 1 (21/04/2008 to 19/02/2009) provided initial insight into the impact of each
argument in a context where participants also had access to information about the
current electricity generating status quo.
4.1. Method
4.1.1. Procedure: Participants were recruited via email invitation or via the
Participants were tested individually in a quiet laboratory setting. Upon arrival, each
participant registered their level of support for the use of each of five key energy
sources used in UK electricity generation (i.e. coal, gas, NP, renewables, and
electricity import2). All responses were recorded using a pen-paper questionnaire on
5-point Likert-scales (5 = Strongly support to 1 = Strongly oppose; plus ‘Don’t know’).
Each participant was then sat at the computer where they were provided with an
on-screen introduction to the experimental task. This explained that the experiment was
designed to assess the future role that they saw for NP in UK electricity generation
(relative to other key energy sources) and provided some information about the
general uses for electricity and the current role played by NP in UK electricity generation. The instructions ended by outlining the UK government’s opinion that
energy companies operating in the UK should be allowed the option of investing in
new NP stations (see Appendix A1, for exact phrasing of introductory instructions).
The computer then assigned each participant to one of four experimental ‘framing’
conditions (i.e. climate change, energy security, nuclear waste or control condition).3 While each framing condition proceeded in an identical manner, there were
differences in the information provided to participants. Specifically, participants in
each condition received a different passage of text (between 221-226 words),
designed to emphasise the aspects of the NP debate consistent with the theme of the
condition (see Table 2 for brief details). Each passage of text was based upon
consultation, citizen deliberative events (see Appendix A2 [1-4], for the exact
[image:14.595.88.502.205.594.2]phrasing of each frame).
Table 2
Brief details of the framing employed in each condition within the three studies
Condition Valence Details
Control Neutral Neutral discussion of the key stages in generating
electricity from NP. Does not talk about purported
positive or negative attributes of NP.
Climate change Positive Outlines climate change. Discusses NPs status as a
low-carbon form of power generation and its utility in
reducing CO2 emissions from this sector alongside other
low-carbon options.
Security of supply Positive Outlines security of supply concerns. Discusses role for
NP in reducing reliance on gas and oil imports from
politically unstable regions and maintaining diversity in
the UK electricity generating portfolio
Nuclear waste Negativea Highlights nuclear waste as a serious and important issue
associated with NP new-build. Discusses pro- and
anti-nuclear viewpoints on the issue.
a While ostensibly a negative (i.e. anti-nuclear) framing condition, discussion of the issue of nuclear
waste was presented in a relatively ambivalent way within the consultation document. Note. The
‘nuclear waste’ frame was not used in the study 3 in order to focus on the impacts of pro-nuclear
framing on electricity mix decisions.
Participants then received instructions detailing the specifics of the experimental task
the UK by manipulating the relative contributions made by five energy sources (coal,
gas, NP, renewables and electricity import).
Participants were free to use as much or as little of each energy source as they liked,
with two exceptions: (1) they could not be more than 50% reliant upon any one
source; and (2) they had to meet 100% of electricity demand. These restrictions forced
participants to make trade-off decisions between the available energy source options
by preventing a 100% reliance on any one energy source or a 0% reliance on all
energy-sources.4 The instructions ended by reaffirming the content of the frame
relevant to the condition (for an example of how this was done, see Appendix A3).
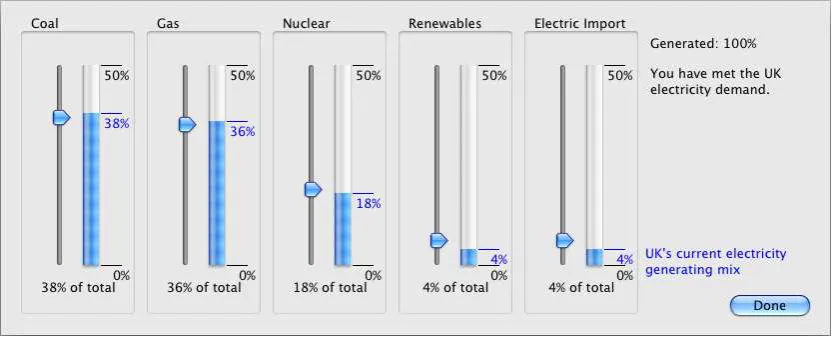
Within the main task, participants were presented with the ‘electricity calculator’ (see
Figure 2) and asked to create their preferred electricity generating portfolio. When participants were first presented with the ‘electricity calculator’ the bars for each
energy source were set to a level indicative of the approximate contribution made that
particular energy source to the current UK mix, i.e. the status quo (coal = 38%; gas =
[image:15.595.90.509.569.738.2]Figure 2. The ‘electricity calculator’. Participants were required to reconfigure the bars
associated with each energy source to create their ‘preferred’ mix. When first presented with
the calculator the bars were positioned to reflect the status quo. Note. Participants were
required to meet 100% of demand and could be only up to 50% reliant upon any one energy
source.
Having settled upon their preferred mix, participants then responded to a series of
post-mix questions that assessed: (1) their self-proclaimed knowledge about how
electricity is generated, their opinions about the use of NP to generate electricity, their
opinions about the use of NP to combat climate change and increase energy security,
and concerns over the safety of NP and the creation of new nuclear waste (8
questions); and (2) their more general beliefs about climate change and favoured
mitigation options (3 questions) (see Appendix B, for details of each question).
Participants finally recorded some basic demographic information (e.g. age, gender)
before being debriefed, thanked and then dismissed.
4.1.2. Hypothesis: It was anticipated that if participants were directly responding to
the content of the information provided to them (i.e. a direct response to the emphasis
framing) that the two pro-nuclear frames should significantly increase reliance on NP compared to the ‘control’ condition, while the ‘waste’ condition should significantly
reduce reliance on NP compared to the ‘control’ condition.
4.2.1. Participants: One-hundred University of Sheffield psychology undergraduate
and postgraduate students participated in this study (69 females and 31 males).
Participants were aged between 18-38 years (Mean = 21.2 years) and the majority (i.e.
89%) believed in anthropogenic climate change (ACC).
4.2.2. Framing condition comparability: Univariate ANOVA and Chi-square analysis
confirmed that the participants assigned to each of the 4 framing conditions (Ns = 25)
were comparable with respect to mean age (p = .161), self-reported knowledge about
electricity generation (knowledge) (p = 1.00), initial attitudes to the 5 energy sources
(ps ≥ .210), the proportion of male and female participants (p = .275) and the
proportion of climate change believers and sceptics (climate) (p = .959) (see Table C1
in Appendix C for descriptive data).
This broad comparability between the participant groups in each framing condition
meant that we could be more certain that any differences found in the electricity
mixes created by participants in each condition were related to our emphasis framing
manipulation.
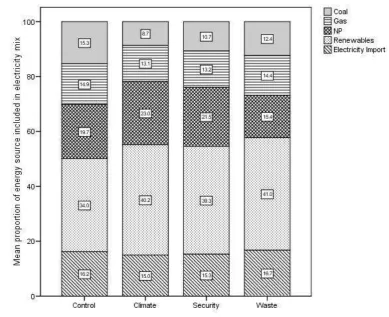
4.2.3. Electricity Mix Analysis: Participants in all 4 conditions responded in a
relatively consistent manner, opting for a high reliance on renewables, a moderate
reliance on NP, a low-moderate reliance on gas and coal, and low reliance on import.
To gain a fuller appreciation of how the framing might have influenced responses, we
conducted a series of univariate ANOVAs with planned simple contrasts (using the ‘control’ condition as a referent category).6
These analyses were used to assess: (a)
framing condition; and (b) whether mean responses in the pro- or anti-nuclear framing conditions differed significantly from the ‘control’ condition (see Figure 3, for the
mean mixes from each framing condition).
The analysis revealed that there were no differences between the conditions with
respect to the mean inclusion of coal (p = .115), gas (p = .135), renewables (p = .840)
or import (p = .778). There was, however, a significant difference in the mean
inclusion of NP, F (3, 96) = 3.15, p = .028, p2 = .090, with participants in the
‘climate’ condition using significantly more NP that those in the ‘control’ condition (p
= .042). Participants in both the ‘security’ (p = .844) and ‘waste’ (p = .351) conditions
Figure 3. Mean electricity mix portfolios generated within each framing condition (study 1).
Overall means for each energy source in rank order of inclusion: [1] Renewables = 35.1%; [2]
NP = 21.4%; [3] Gas = 19.8%; [4] Coal = 16.0%; [5] Import = 7.7%. Note: All mixes are
roughly comparable except in ‘climate’ condition in which a significantly greater proportion
[image:19.595.84.511.484.720.2]of NP is endorsed.
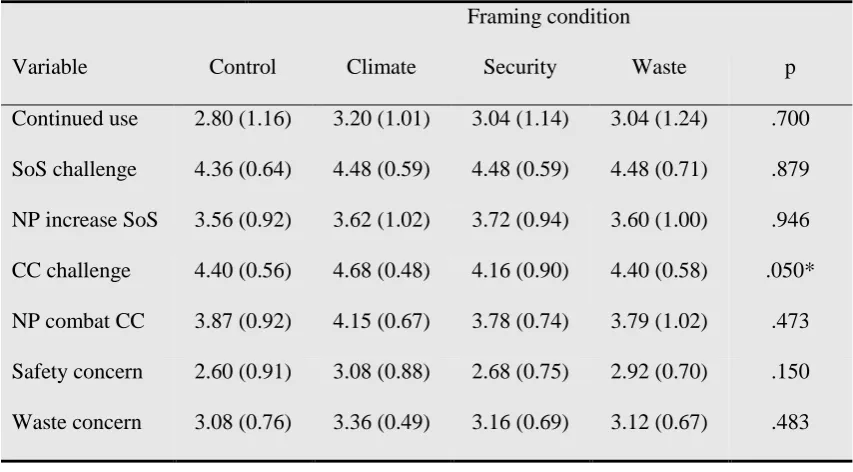
Table 3.
Means and standard deviations for responses to post-mix questions concerning NP (study 1).
Framing condition
Variable Control Climate Security Waste p
Continued use 2.80 (1.16) 3.20 (1.01) 3.04 (1.14) 3.04 (1.24) .700
SoS challenge 4.36 (0.64) 4.48 (0.59) 4.48 (0.59) 4.48 (0.71) .879
NP increase SoS 3.56 (0.92) 3.62 (1.02) 3.72 (0.94) 3.60 (1.00) .946
CC challenge 4.40 (0.56) 4.68 (0.48) 4.16 (0.90) 4.40 (0.58) .050*
NP combat CC 3.87 (0.92) 4.15 (0.67) 3.78 (0.74) 3.79 (1.02) .473
Safety concern 2.60 (0.91) 3.08 (0.88) 2.68 (0.75) 2.92 (0.70) .150
Waste concern 3.08 (0.76) 3.36 (0.49) 3.16 (0.69) 3.12 (0.67) .483
* p < .05
4.2.4. Post-Mix Question Analysis: The results of these analyses ostensibly
supported the conclusion that couching the nuclear debate in terms of mitigating
climate change had produced a greater direct endorsement of NP (i.e. evidence of a
direct emphasis framing effect). However, while on the surface this finding might have been seen to validate the concerns of critics of the consultation, participants’
responses to some of the post-mix feedback questions argued against this basic
conclusion (see Appendix B1 for details of the post mix questions used in this study
and see Table 3 for the mean responses to these questions).
In short, if participants were directly responding to the content of the ‘climate’ frame,
one should have expected those in this condition to be: (a) more convinced that
climate change is a critical challenge for the UK (CC challenge); and (b) hold a
stronger belief that NP could help to address this challenge (NP combat CC).
However, while a difference in CC challenge was observed between the conditions, F
(3, 96) = 2.71, p = .050, p2 = .078 (with concern shown to be highest in the ‘climate’
condition), there was no comparable difference in responses to the NP combat CC
item between the conditions (p = .473). Thus, while it appeared that the ‘climate’
frame was effective in heightening concern over climate change, this apparently did
not convince participants that NP was the obvious solution to the problem.
strongly agree). Responses to the safety concern and waste concern items were made on a 4-point scale
(1 = not at all concerned –4 = very concerned). All analyses discount respondents answering ‘Don’t
Know’. For exact phrasing of questions and the codes for each item, see Appendix B1. Abbreviations
Indeed, taken together, participants across the conditions were shown to favour: (a)
the expanded use of renewables; (b) behavioural interventions to reduce consumption;
and (c) improved energy efficiency over the expanded use of NP as the preferred
means for mitigating climate change (see Table 4 for preferred climate change mitigation choices). Moreover, participants in the ‘climate’ condition were no more
likely to select NP as a favoured options than those in other conditions, 2 (3) = 2.42, p = .490.
Finally, if participants in the ‘climate’ condition were directly favouring NP as a
generating option, then one might have expected them to be more convinced of the
relative safety NP within this condition. However, assessment of the planned simple
contrasts between the mean responses to the safety concern item in each condition (from this point on referred to simply as ‘planned simple contrasts’) revealed that
participants in the ‘climate’ condition actually had a significantly elevated concern
[image:21.595.83.503.546.731.2]about the safety and security of NP compared to the control condition (p = .041) .
Table 4
Favoured options for mitigating climate change (study 1).
Rank Option Checked Unchecked
1 Expanded use of renewables 95 5
2 Change behaviour to reduce consumption 82 18
3 Expand energy-efficient technology 74 26
4 Expand use of NP 23 77
5 Reduce consumption via regulation/taxes 13 87
6 Continued use of fossil fuels with CCS 4 96
In sum, while there was evidence for an apparently elevated preference for NP in the ‘climate’ condition within this study, analysis of respondents’ post-mix responses
pointed towards this being the result of something other than a direct endorsement in
response to climate change framing.
4.3. Discussion
Study 1 provided initial insight into the trade-off decisions that participants would
make when confronted with the task of having to create an electricity mix for the UK
with a limited number of options. Findings suggested that participants in all
conditions were in broad agreement as to the general nature of their preferred mixes,
opting for a relatively low reliance on fossil fuels and import, high reliance on
renewables, and a moderate reliance on NP.
The results also provided insight into how these trade-off decisions might vary in
response to arguments centred upon the issues of climate change, security of supply
and nuclear waste. The findings suggested that while there was little evidence of framing effects among participants in the ‘waste’ and ‘security’ conditions, the
‘climate’ frame apparently did prompt participants to rely significantly more on NP.
While on the surface this could perhaps be taken to validate the concerns aired by
critics of the 2007 consultation, the lack of corroborative trends within the responses
varied thus: 4-options (N = 3); 3-options (N = 86); 2-options (N = 10); 1-option (N = 1). There were
also ‘none of these’ and ‘don’t know’ options but these were not selected. Abbreviations used: CCS
to the post-mix questions cast doubt over this assumption and suggested that this
increase may have formed more indirectly – and perhaps reluctantly – as a
consequence of other decisions made within the task. For instance, it is possible that
this trend might have resulted from an elevated desire to reduce fossil fuel use within the ‘climate’ condition and the dependence of energy source decisions within the task.
In short, participants’ reliance on both coal and gas was visibly lowest in the ‘climate’
condition. While this decision to more noticeably limit the inclusion of fossil fuels is
consistent with the general thrust of the frame (i.e. reduce GHG emissions from electricity generation), the nature of the ‘electricity calculator’ meant that participants
would have necessarily had to increase their reliance on the other energy sources (i.e.
renewables, NP, and electricity import) relative to the other conditions in order to
create a viable electricity mix (i.e. one totalling 100%).
With the use of renewables ostensibly saturated, participants in the ‘climate’ condition
apparently favoured investing in NP over electricity import. While this decision could
have related to relative familiarity of these energy sources, we would argue that it might have also stemmed from participants’ recognition of the existing contributions
made by each of these energy sources to UK electricity generation (18% NP vs. 4%
electricity import), i.e. an anchoring effect caused by the provision of the status quo
figures.
In this way then, the greater reliance on NP in the ‘climate’ condition might not be the
result of a direct emphasis framing effect, but something more akin to a reluctant
reduced reliance on fossil fuels in this condition; and (b) an awareness of the UK’s
existing reliance on NP as a generating option. A conclusion of reluctant acceptance
is certainly consistent with existing literature on attitudes towards NP (see Bickerstaff
et al., 2008; Corner et al., 2011; Pidgeon et al., 2008) and can perhaps explain why the higher preference for NP in the ‘climate’ condition was accompanied by heightened
concern for safety and security.
5. Study 2
Study 2 (25/02/2009 to 03/12/2009) investigated the findings of study 1 in a context
where status quo information was no longer available. Thus, we could assess whether
the elevated reliance on NP in the ‘climate’ condition was indicative of a direct
emphasis framing effect or a reluctant acceptance resulting from other decisions made within the ‘electricity calculator’ task and anchoring provided by the status quo.
5.1. Method
5.1.1. Procedure: The procedure for study 2 was the same as study 1, with two
exceptions. First, all references to the status quo figures were removed and the ‘electricity calculator’ task was updated such that when beginning the task each
energy source was making a standard 20% contribution to the generating mix. This
change meant that while the initial sum of the contributions made by the
energy-sources still totalled 100% (akin to study 1), participants received no information
about the comparative ‘real-world’ contributions made by each source. Secondly,
5.1.2. Hypotheses: It was reasoned that if participants’ decisions in study 1 were
being anchored by the status quo figures, that participants in study 2 should show
comparatively higher reliance on the low-anchored energy-sources (i.e. renewables
[4%] and electricity import [4%]) and comparatively lower reliance of high-anchored
energy-sources (i.e. coal [38%] and gas [36%]).
It was also reasoned that if the elevated reliance on NP in the ‘climate’ condition of
study 1 was tied to the provision of the status quo figures (as opposed to a direct
framing effect), that the absence of this information in study 2 should reduce any
discrepancy in the preference for NP between the conditions.
5.2. Results
5.2.1. Participants: One-hundred and twenty participants took part in this study
(100 female and 20 male). All participants were either University of Sheffield
undergraduate or postgraduate students, members of the University of Sheffield
volunteers list, or visiting sixth-form students. The participants were all aged between
17-56 years (Mean = 19.8 years), with 81.6% shown to believe in anthropogenic
climate change (ACC). Postgraduate, undergraduate and volunteers-list participants
were recruited via email invitation or through the ORPS. Each received either course
credit or chocolate as payment. The remaining participants (i.e. sixth-form students)
were recruited on departmental open-days, where the study was run as a
5.2.2. Framing-condition comparability: Participants in each condition (N = 30)
were comparable with respect to mean age (p = .810), self-reported knowledge about
electricity generation (knowledge) (p = .581), initial attitudes to the 5 energy sources
(ps ≥ .294), the proportion of males and female participants (p = .696), and the
proportion of climate change believers and sceptics (climate) (p = .774) (see Table C1
in the Appendix C for descriptive data).
5.2.3. Electricity Mix Analysis: Despite having no access to status quo information,
participants in all 4 conditions responded in a manner akin to those in study 1, opting
for a relatively low reliance on fossil fuels and import, a large reliance on renewables,
and a moderate reliance on NP. However, in contrast to study 1, overall mean
inclusion of electricity import out-ranked that of both the fossil fuels and there was no obviously elevated reliance on NP in the ‘climate’ condition (see Figure 4).
Figure 4. Mean electricity mix portfolios generated within each framing condition (study 2).
Overall means for each energy source in rank order of inclusion: [1] Renewables = 38.6%; [2]
NP = 19.9%; [3] Import = 15.8%; [4] Gas = 13.9%; [5] Coal = 11.7%. Note: All the mixes are
roughly comparable and the elevated endorsement of NP in the ‘climate’ condition (vs.
control) observed in study 1 is greatly attenuated.
Univariate ANOVAs (with planned simple contrasts) revealed that there were
significant differences between the conditions with respect to the inclusion of coal, F
(3, 116) = 6.60, p < .001, p2 = .146, and renewables, F (3, 116) = 3.47, p = .018, p2
= .082, but no statistically significant differences in terms of the reliance on gas (p =
.535) or electricity import (p = .803). A marginal difference in the relative preference
conditions, did not differ significantly from the inclusion of NP in the ‘control’
condition (ps ≥ .153)8.
The significant differences in the reliance on coal and renewables were explored
further through the planned simple contrasts. In terms of reliance on coal, participants in the ‘climate’ (p < .001) and ‘security’ (p = .003) conditions included significantly
less than those in the ‘control’ condition, while use in the ‘waste’ and ‘control’
conditions was comparable (p = .059). In terms of renewables, participants in the ‘climate’ (p = .011), ‘security’ (p = .029) and ‘waste’ (p = .004) conditions included
significantly more in their mixes than those in the ‘control’ condition.
5.2.4. Post-Mix Question Analysis: Analysis of the post-mix questions revealed that
there was again a difference in the perceived criticality of climate change as a
challenge for the UK between the conditions (CC challenge), F (3, 115) = 4.41, p =
.006, p2 =.103. Participants in both the ‘climate’ and ‘security’ conditions perceived climate change a greater challenge than those in the ‘control’ condition (ps < .028).
As with study 1, however, this heightened concern about climate change was not
accompanied by a heightened belief that NP should be used to mitigate this threat (NP
combat CC), F (3, 111) = 0.17, p = .917. Indeed, analysis of the between-group
differences in responses to the safety concern and waste concern items revealed that the ‘security’ frame had actually increased unease about NP relative to the ‘control’
condition on these items (ps ≤ .019) (see Table 5).
With respect to climate change mitigation, investment in NP remained only
moderately favourable option in all the framing conditions (see Table 6) and was no more likely to be favoured by participants in the ‘pro-nuclear’ framing conditions than
those in the ‘control’ and ‘waste’ conditions, 2
(3) = 1.10, p = .778.
Taken with the findings of the electricity mix analyses, these results indicated that the ‘pro-nuclear’ framing, while perhaps effective in stimulating concern over
unsustainable and insecure generating practices, apparently did not significantly affect participants’ relative preference for NP as an electricity generating option.
Means and standard deviations for responses to post-mix questions concerning NP (study 2).
Framing condition
Variable Control Climate Security Waste p
Continued use 3.00 (1.02) 3.14 (0.97) 3.00 (0.96) 2.86 (0.99) .764
SoS challenge 4.14 (0.58) 4.33 (0.48) 4.45 (0.51) 4.33 (0.55) .167
NP increase SoS 3.37 (0.97) 3.63 (0.72) 3.34 (0.86) 3.41 (1.09) .609
CC challenge 4.07 (0.64) 4.55 (0.57) 4.47 (0.68) 4.03 (0.85) .006**
NP combat CC 3.74 (0.86) 3.63 (0.77) 3.57 (0.88) 3.67 (1.06) .917
Safety concern 2.46 (0.64) 2.69 (0.76) 2.93 (0.70) 2.59 (0.63) .072
Waste concern 2.90 (0.62) 3.03 (0.68) 3.28 (0.53) 2.86 (0.58) .043*
* p < .05
** p < .01
Note. Responses to first 5-items were made on 5-point Likert-type scales (1 = strongly disagree – 5 =
strongly agree). Responses to the safety concern and waste concern items were made on a 4-point scale
(1 = not at all concerned –4 = very concerned). All analyses discount respondents answering ‘Don’t
Know’. For exact phrasing of questions and coding for items, see Appendix B1. Abbreviations used:
5.2.5 Comparing Studies 1 and 2: A series of 2 (study: one vs. two) x 4 (framing
condition: control, climate, security, waste) univariate ANOVAs (with planned simple
contrasts) were run to formally assess how the provision of the status quo figures in
study 1 might have influenced participants’ reliance on each energy source, in
addition to checking for any interactions between study and framing condition.
The results showed significant anchoring effects for the relative inclusion of coal, gas,
renewable and electricity import. As predicted, participants in study 1 (anchored task)
[image:30.595.82.506.164.370.2]on average included significantly more coal and gas (Fs ≥ 17.71, ps < .001, p2≥ .077) and significantly less renewables and import (Fs ≥ 5.07, ps ≤ .025, p2≥ .023)
Table 6.
Favoured options for mitigating climate change (study 2).
Rank Option Checked Unchecked
1 Expanded use of renewables 112 8
2 Change behaviour to reduce consumption 108 12
3 Expand energy-efficient technology 93 27
4 Expand use of NP 21 99
5 Reduce consumption via regulation/taxes 15 105
6 Continued use of fossil fuels with CCS 5 115
7 Don’t Know 1 119
Note. Whilst participants were asked to select the two or three options they most favoured; the
number of checked options varied thus: 5-options (N = 2), 4-options (N = 3); 3-options (N = 103);
than those in study 2 (unanchored task). On average there was no significant
difference in the inclusion of NP between the studies (p = .357).
Main effects of framing condition were only observed in the reliance on coal, F (3,
212) = 6.87, p < .001, p2 = .089, and NP, F (3, 212) = 5.40, p = .001, p2 = .071 (Gas: p = .084; Renewables: p = .109; Import: p = .580). In terms of coal, this resulted from participants in the ‘climate’ and ‘security’ conditions using less coal than those in the
‘control’ condition (ps < .001); while the difference in NP principally resulted from
the elevated inclusion of this source in the ‘climate’ condition of study 1. There were
no significant interactions between study and framing condition (ps ≥ .274).
5.3. Discussion
In addition to confirming the status of renewables as the clearly favoured generating
option, the results of study 2 demonstrated how the provision of the status quo figures in study 1 had influenced participants’ decisions in the ‘electricity calculator’ task,
leading them to incorporate significantly less renewables and import and significantly
more coal and gas. The results also confirmed the apparent ineffectiveness of the experimental framing in influencing participants’ preferences for NP. Indeed, the
‘climate’ and ‘security’ frames in particular prompted the participants to reduce the
reliance on coal and increase the contribution of renewables rather than to increase
reliance on NP.
Importantly, the absence of the elevated endorsement of NP in the ‘climate’ condition
Participants in the ‘climate’ condition still showed a desire to reduce reliance on coal
relative to other conditions, however, in the absence of the status quo figures, they
apparently felt more able to rely on investment in electricity import and renewables (i.e. the otherwise ‘low-anchored’ sources) to make up for any additional generating
deficit, which negated the need for heavier investment in NP.
With regard to the inclusion of NP, it was interesting to find that participants in both
studies opted for broadly comparable reliance on this option on average (i.e. approx.
20%). While in study 1 this finding could possibly be attributed to the anchoring
provided by the status quo (i.e. 18% NP), it was less clear why a similar reliance on
NP should be found in study 2 (i.e. where no such anchoring information was
available). Two explanations were considered for this finding: (1) The 20% figure was indicative of a generic acceptable level of endorsement for NP within the ‘electricity
calculator’ (a figure coincidentally resembling the levels within the status quo); or (2)
The 20% figure resulted inadvertently from our decision to set the initial starting
values for each energy source to a standard 20% level.
In order to determine between these explanations a third study was conducted. This
study also tested the findings of the previous studies within a more diverse sample of
participants (i.e. a non-student sample). This was achieved by recruiting participants
alongside a nationally representative survey on attitudes towards climate change and
energy futures in Britain (see Spence et al., 2010).
Study 3 (07/01/2010 to 20/04/2010) tested the findings from the previous two studies
in a more diverse sample of participants and allowed for the investigation of whether participants’ reliance on NP in study 2 might have been inadvertently anchored by the
decision to set the initial starting values of the energy-sources within the electricity
calculator to 20%.
6.1. Method
6.1.1. Procedure: Participants were recruited alongside a national survey exploring
public perceptions of climate change and future electricity generation options (for
details, see Spence et al., 2010; see also Spence et al., 2011). After completing this
survey, participants were provided with a link to an online version the ‘electricity calculator’ task, which they were asked complete at their own convenience.
Of the 2339 people who participated in the national survey9, 1181 expressed interest
in completing the online task and were issued with a participation code. Provision and use of this code allowed us to coordinate participants’ online responses with their
survey responses.
The experiment operated in the manner previously described, with four exceptions:
1) Because the focus of the research was principally on whether the government’s use
of pro-nuclear framing was influencing attitudes to NP, the decision was taken to drop the ‘waste’ condition from study 3. Thus, when accessing the online task, participants
‘security’ condition, in either the anchored or unanchored version of the ‘electricity
calculator’ task).
2) The operating platform was changed to enable the task to operate within an online environment. The questions recording participants’ initial attitudes to each of the 5
energy-sources (originally delivered in a pen-and-paper format) were also uploaded to become a part of the online task and ‘key press’ instructions were adapted to ensure
compatibility with different computers.
2) The initial contributions made by each energy source when people began the task
were set to 0%. This removed the inadvertent 20% anchor present in study 2. The
same was done for both the anchored and unanchored versions of the task; however,
in the anchored task, the status quo values were still visible alongside the
energy-source bars.10
3) Each participant who completed the online task was sent a £5 gift voucher as
payment for participation, rather than course credit or chocolate.
6.1.2. Hypotheses: It was anticipated that: (a) participants’ decisions within the ‘electricity calculator’ should broadly mirror the previous studies (i.e. high reliance on
renewables, low-moderate reliance on fossil fuels and electricity import, and moderate
reliance on NP); (b) that the pro-nuclear framing should not promote the greater
reliance on NP compared to the ‘control’ condition; and (c) that anchoring would
It was also hypothesised that if participants’ inclusion of NP in study 2 was not a
product of inadvertent anchoring, that on average participants in study 3 should again
include around 20% of NP within their mix.
6.2. Results
6.2.1. Participants: Of the 1181 participants issued with a participation code, 184
completed the online task. Of these, 6 failed to enter a valid code and were omitted
from the dataset leaving a final population of 178. All 178 participants were aged
between 15 and 83 years (Mean = 43.3 years; SD = 16.9 years), 48.9% were male and
86.5% believed in anthropogenic climate change. Consistent with the aims of the
study, this sample was more demographically diverse than those tested in either of the
previous studies. However, being self-selected, it should be noted that the sample was
not representative of the UK and is likely to have contained a disproportionate number
of individuals with interests in energy and environment.
6.2.2. Sub-condition comparability: Assignment of participants between the 6
conditions was roughly comparable. Four of the conditions comprised between 27 and
31 participants. The ‘security’ condition (anchored version) had fewest participants (N = 21) and the ‘climate’ condition (unanchored version) had the most (N = 39).
Participants within each condition were comparable with respect to age, knowledge,
belief in climate change and trends in their initial attitudes towards the 5 energy
sources (ps ≥ .458). Equal proportions of male and female participants took part in the
under-represented within the unanchored version of the task (p = .025) (see Table C1 in the
Appendix for descriptive data).
Despite the slight discrepancy in participant numbers and the under-representation of
male participants in the unanchored task, the conditions were overall considered
suitable for direct comparative analysis.
6.2.3. Electricity Mix Analysis: Participants in all conditions were in general
agreement about the broad shape of their favoured electricity mix. Participants again
foremostly favoured investment in renewables, combining this with a low reliance on
the fossil fuels and import and a low-moderate reliance on NP (see Figure 5).
A series of 2 (Anchoring: anchored vs. unanchored) x 3 (Framing condition: control
vs. climate vs. security) univariate ANOVAs were again conducted to investigate the impact of the experimental framing and anchoring on participants’ inclusion of each
Figure 5. Mean electricity mix portfolios generated within each framing condition (study 3).
Overall means for each energy source in rank order of inclusion: (A) Anchored: [1]
Renewables = 34.7%; [2] NP = 23.6%; [3] Gas = 19.2%; [4] Coal = 15.6%; [5] Import =
6.7%. (B) Unanchored: [1] Renewables = 38.1%; [2] NP = 21.7%; [3] Gas = 17.4%; [4] Coal
= 12.9%; [5] Import = 9.9%. Note: Patterns of responding between conditions and between
the unanchored and anchored versions of the task were broadly comparable.
Coal: While not achieving conventional statistical significance, the main effects of
anchoring, F (1, 172) = 2.98, p = .086, p2 = .017, and framing condition, F (1, 172) =
(‘security’: p = .038; ‘climate’: p = .067). In terms of anchoring, the observed trend
was towards the lower inclusion of coal within the unanchored task (see Figure 5).
Gas and NP: The analyses for gas and NP revealed no significant main effects of
anchoring (ps ≥ .285) or framing condition (ps ≥ .422) and no interactions (ps ≥ .645).
Renewables: There was no main effect of anchoring (p = .197) and no significant
interaction between anchoring and framing (p = .585). The main effect of framing
achieved marginal significance and was explored further, F (1, 172) = 2.90, p = .058,
p2 = .033. This marginal effect was principally found to result from participants in the ‘security’ conditions using more renewables than those in the ‘control’ conditions
(p = .018) (‘control’ vs. ‘climate’: p = .161).
Import: There was a significant main effect of anchoring only, F (1, 172) = 4.73, p =
.031, p2 = .027 (framing condition, p = .787; interaction, p = .843). Participants in the unanchored task included significantly less electricity import on average than those in
the anchored task (see Figure 5).
6.3. Discussion
Study 3 was designed to assess the findings of the previous two studies in a more
general sample. Modifications to the task also meant that we could examine the
competing explanations for why participants in study 2 might have endorsed similar
levels of NP to those in study 1 in spite of having no access to the status quo
Consistent with the previous studies, participants again opted for a low reliance on
fossil fuels and import, high reliance on renewables and a low-moderate reliance on
NP (circa. 20-25%). These results not only confirmed the status of renewables as the most favoured generating option but also confirmed participants’ general willingness
to incorporate NP within their mix. Furthermore, the finding that participants tended
to include between 20-25% of NP within their mixes – particularly in the unanchored
task – tended to argue against the suggestion that inclusion of NP in study 2 had been
overly influenced by our decision to set the initial energy-source contributions to
20%.
There was again some evidence that the pro-nuclear framing had impacted
participants’ choices within the ‘electricity calculator’ task; however, these effects did
not manifest as significant increases in the inclusion of NP. Rather, the ‘climate’ and
‘security’ arguments again exerted a more appreciable impact upon participants’
inclusion of coal and renewables. Importantly, the absence of a significantly elevated
endorsement of NP in response to ‘climate’ framing in either of the anchored or
unanchored tasks, added weight to the suggestion that the trend observed in study 1
was not evidence of a genuine pro-nuclear framing effect.11
Study 3 showed less clear-cut evidence of anchoring, which perhaps reflects the
greater diversity of participants within the sample and/or the fact that the task was conducted in a less controlled environment (e.g. participants’ homes) where people
might have had access to additional information. The exception to this rule related to
the inclusion of electricity import, which was found to be much higher in the
in the inclusion of electricity import not only because the status quo contribution from
this energy source is relatively low, but also due to the relative unfamiliarity of this
option compared to the other specified energy sources.12
7. General Discussion
In 2007 the UK government held a public consultation on the future of NP in the
country (see BERR, 2008; DTI, 2007b). A series of three studies sought to assess
what impact key arguments used by government within this consultation (to
ostensibly promote acceptance of NP) might have upon preferences for NP in
electrical power generation relative to other generating options. While the results do
not speak to the suggestion that government deliberately sought to sway public
opinion, they do offer insight into what impact the use of repetitive, pro-nuclear
framing might have had on opinions about the technology during the period of
consultation.
7.1. The impact of framing and anchoring
The results of these studies revealed little evidence of the hypothesised impact of
pro-nuclear framing on participants’ preferences for NP and suggested that anchoring as opposed to framing was having the greater impact upon participants’ decisions.
Indeed, even when it appeared that the ‘climate’ frame had directly increased
inclusion of NP (study 1), subsequent analyses indicated that this probably
demand and the anchoring provided by the status quo figures (see also Bickerstaff et
al., 2008; Pidgeon et al., 2008).
The lack of an impact of framing on preferences for NP could perhaps stem from
participants having strong pre-formed attitudes about NP. The nuclear debate is
certainly a divisive issue in the UK and strong pre-existing attitudes have been shown
to limit the power of persuasive appeals (e.g. Brewer, 2001; Zuwerink and Devine,
1996). Thus, while there was evidence that participants had registered the content of the ‘climate’ and ‘security’ frames, perhaps it is unsurprising that they stopped short
of elevating participants’ reliance on NP.
7.2. A significant role for nuclear power?
While there was little evidence for the impact of framing upon participants’ inclusion
of NP within our task, NP was still found to play a major role in participants’
favoured mixes. Largely independent of anchoring or framing NP accounted for
around 20-25% of electricity generated and typically ranked second among the
available energy source options.
On the surface, these findings would appear to suggest that our participants not only
saw NP to be a vital component of the UK’s generating portfolio but that NP should
make a similar contribution to generation as it does at present. While not taking issue
with the first part of this statement (as it was clear that the on average participants saw
a substantial role for NP) we would advise caution in directly generalising the values
While certain design features (e.g. the inability to reject all generating options) were
built into the ‘electricity calculator’ task in order to more closely align participants’
decision-making with real-world scenarios (e.g. where a rejection of all options is not
practicable), the task was never designed to fully reflect reality but to experimentally
investigate emphasis framing within a setting offering a purposefully limited number
of choice options. As such, while our results might be taken as indicative of genuine
relative real-world preferences, the actual figures observed should only be considered
in the context of the choices that were available to participants.
In order to develop the ‘electricity calculator’ tool to be more reflective of real-world
preferences in the future, we would argue for the need to incorporate a greater range
of energy-source options (including a demand reduction option) and to more obviously relate participants’ decisions to key outcome variables (e.g. impacts on
generating cost and carbon emissions). Other calculator tools that incorporate some of
these additional features can currently be found on the UK government (see
http://my2050.decc.gov.uk/) and BBC (see
http://news.bbc.co.uk/1/shared/spl/hi/uk/06/electricity_calc/html/1.stm) websites.13
7.3 The desire for renewables
Arguably the most prominent finding from this research was the clear desire for
investment in renewables among our participants. In all conditions people were most
reliant on this option, which is perhaps unsurprising considering the positive attitudes
simply confirming the popularity of renewables, we would argue that our results
perhaps hold additional implications.
For instance, from a policy perspective, this favourability could be taken to offer
indirect support for the UK government’s ambitious renewable energy targets (see
DECC, 2009a; 2009b). That said, while the general desire for expansion of
renewables among the general public might be welcomed by government, we would
argue that this general support should not be used as a means to justify specific
renewable projects. Not only did our renewables category fail to distinguish between
different renewable technologies (e.g. hydroelectric, wind, solar) but a burgeoning
literature now attests to discrepancy that often exists between general attitudes
towards a technology and attitudes towards specific projects (e.g. Jones and Eiser,
2009; Krohn and Damborg, 1999; van der Horst, 2007).
The popularity of renewables could also have implications for how to frame and
discuss investment in other energy sources, like NP, particularly when arguments
centre upon the issue of climate change mitigation. Recent research shows that
attitudes towards NP and other low-carbon technology options, e.g., carbon capture
and storage (CCS) tend to be more favourable if they are seen not to affect investment
in renewables (see e.g. Oltra et al., 2010; Pidgeon et al., 2008). The high levels of
support for renewables relative to NP within our studies could be taken as evidence
for this caveat on the endorsement of NP and would support attempts to delineate,
where possible, the non-competitive nature of these options. That said, it should be
options remains a major source of disagreement within current debates around energy
(e.g. Verbruggen, 2008)
7.4 Limitations of task
There are several limitations within the current experimental design which should be
noted if using the results of these studies to directly critique of the 2007 consultation.
First, our decision to separately investigate the impacts of the ‘climate’ and security’
arguments might have limited the strength of our framing manipulation compared to
the 2007 consultation (i.e. where both frames were presented simultaneously and on
more occasions). While our chosen method allowed us to keep the experimental
procedure brief and to investigate the comparative influence of each argument, it is
possible that combining these arguments and presenting them in a more sustained and
repetitive manner (as was the case in the consultation) may have had a larger impact upon participants’ preferences for NP within the task. That said, the individual
‘climate’ and ‘security’ frames were strong enough to significantly influence
participants’ inclusion of other energy sources (e.g. coal and renewables), thus
supporting the conclusion that the experimental framing was simply ineffective in influencing participants’ preferences for NP within the task.
Second, our choice to test participants in a non-deliberative context did not accurately
reflect how members of the public reached decisions within the public consultation events. Within the consultation participants’ decisions were made in a small-group
be argued that in a more sustained deliberative setting, stronger framing effects might
have been observed. That said, recent research demonstrates that in such small-group
deliberative contexts, people are often exposed to a number of competing viewpoints
and opinions that can reduce the persuasive influence of elitist framing (e.g.
Druckman and Nelson, 2003). As such, our decision to test people individually could
have arguably increased the strength of the framing manipulations.
Finally, it is possible that our decision to provide participants with five energy-source
options might have accounted for their tendency to incorporate around 20% of NP in
their mix. This is the level you would anticipate people to incorporate by chance.
However, while we would advise that future studies incorporate a greater number of
response options in order to test this assumption, the clear deviations from
chance-level responding shown in the use of other energy-sources argues against the chance-levels of
NP included being simply the result of chance-level responding.
8. Conclusion
The three studies outlined above illustrate that, among our sample, the pro-nuclear
framing used by the UK government within the 2007 public consultation events had
very little impact upon preferences for NP. Rather, the findings suggest that this
framing actually served to bolster a desire for investment in renewables and a reduced
reliance on coal. These findings can perhaps provide insight into the influence that
such framing might have had upon participants of the actual consultation. However,
care should be taken if drawing such comparisons due to the relatively narrow
assessed and the notable differences in the decision-making context employed in our
studies compared with the citizen deliberative events.
In addition to the empirical findings of these studies, we would also argue that the ‘electricity calculator’ task developed for use in this research holds real potential for
future assessment of public opinion energy policy options. Not only does this tool
stand to provide a more realistic picture of the kinds of trade-offs and decisions that
people might be willing to endorse (or tolerate) in complex choice settings, but
employed alongside other engagement and outreach efforts these tools could stand to:
(a) enhance broader public understanding of challenges faced by energy companies
and policy makers in the energy sector; and (b) build capacity within the general
public to assist in deciding how these challenges should be addressed (see Beierle and
Cayford, 2002; Stern and Fineberg, 1996).
Acknowledgements
This research was funded by The Leverhulme Trust (F/00 407/AG). Thanks goes to Ross Pointon for his assistance in reconfiguring the ‘electricity mix’ task for operation
within an online environment (study 3). Thanks also goes to Alexa Spence, Wouter
Poortinga, Catherine Butler and Nick Pidgeon for enabling us to affiliate study 3 with
References
Bahgat, G., 2006. Europe’s energy security: challenges and opportunities. International Affairs, 82 (5),
961-975.
BERR, 2008. The future of nuclear power: Analysis of consultation responses. Department of Business
and Regulatory Reform (BERR), London, UK. Available from:
http://www.berr.gov.uk/files/file43206.pdf (Last accessed: 16th February 2011).
Beierle, T.C., Cayford, J., 2002. Democracy in Practice: public participation in environmental
decisions. RFF Press, Washington (DC), USA.
Bickerstaff, K., Lorenzoni, I, Pidgeon, N.F., Poortinga, W., Simmons, P., 2008. Reframing nuclear
power in the UK energy debate: nuclear power, climate change mitigation and radioactive waste.
Public Understanding of Science, 17 (2), 145-169.
Brewer, P.R., 2001. Value words and lizard brains: Do citizens deliberate about appeals to their core
values? Political Psychology, 22 (1), 45-64.
Brewer, P.R., Gross, K., 2005. Values, framing, and citizens’ thoughts about policy issues: Effects on
content and quantity. Political Psychology, 26 (6), 929-948.
Climate Change Act, 2008. The Climate Change Act (Chapter 27). The Stationery Office (TSO),
London, UK.
Chong, D., Druckman, J.N., 2007. Framing Theory. Annual Review of Political Science, 10 (1),
103-126.
Corner, A., Venables, D., Spence, A., Poortinga, W., Demski, C., Pidgeon, N.F., 2011. Nuclear power,
climate change and energy security: exploring British public attitudes. Energy Policy, 39 (9),
4823-4833.
DECC, 2009a. The UK Low Carbon Transition Plan: National Strategy for Climate and Energy.
DECC, 2009b. The UK Renewable Energy Strategy (July 2009). Department of Energy and Climate
Change (DECC), The Stationery Office, London, UK.
DECC, 2010. UK energy in brief 2010. Department of Energy and Climate Change (DECC), The
Stationery Office, London, UK.
Druckman, J.N., 2001a. The implications of framing effects for citizen competence. Policy, 23 (3),
225-256.
Druckman, J.N., 2001b. On the limits of framing effects: Who can frame? The Journal of Politics, 63
(4), 1041-1066.
Druckman, J.N., Nelson, K.R., 2003. Framing and deliberation: How citizens’ conversations limit elite
influence. American Journal of Political Science, 47 (4), 729-745.
DTI, 2003. Our energy future – creating a low carbon economy. Department of Trade and Industry
(DTI), London, UK. Available from: http://www.berr.gov.uk/files/file10719.pdf (Last accessed:
16th February 2011).
DTI, 2006a. Our energy challenge: Securing clean, affordable energy for the long term. Department of
Trade and Industry (DTI), London. UK. Available from:
http://www.dti.gov.uk/energy/review/consultation/index.html (Last accessed: 16th February
2011).
DTI, 2006b. The energy challenge: Energy review report. Department of Trade and Industry (DTI),
London, UK. Available from: http://www.berr.gov.uk/energy/whitepaper/review/page31995.html
(Last accessed: 16th February 2011).
DTI, 2007a. Meeting the energy challenge: A white paper on energy. Department of Trade and Industry
(DTI), London, UK. Available from: http://www.berr.gov.uk/energy/whitepaper/page39534.html