This is a repository copy of
Stain guided mean-shift filtering in automatic detection of
human tissue nuclei
.
White Rose Research Online URL for this paper:
http://eprints.whiterose.ac.uk/79946/
Version: Accepted Version
Article:
Zhou, Y, Magee, DR, Treanor, D et al. (1 more author) (2013) Stain guided mean-shift
filtering in automatic detection of human tissue nuclei. Journal of Pathology Informatics, 4
(1). ISSN 2229-5089
https://doi.org/10.4103/2153-3539.109863
[email protected] https://eprints.whiterose.ac.uk/
Reuse
Unless indicated otherwise, fulltext items are protected by copyright with all rights reserved. The copyright exception in section 29 of the Copyright, Designs and Patents Act 1988 allows the making of a single copy solely for the purpose of non-commercial research or private study within the limits of fair dealing. The publisher or other rights-holder may allow further reproduction and re-use of this version - refer to the White Rose Research Online record for this item. Where records identify the publisher as the copyright holder, users can verify any specific terms of use on the publisher’s website.
Takedown
If you consider content in White Rose Research Online to be in breach of UK law, please notify us by
Stain Guided Mean-Shift Filtering in Automatic
Detection of Human Tissue Nuclei
Yu Zhou1, Derek Magee1, Darren Treanor2, and Andy Bulpitt1
1
School of Computing, University of Leeds, Leeds, UK (Y.Zhou; D.Magee; [email protected])
2 Pathology and Tumor Biology, Leeds Institute of Molecular Medicine, University of
Leeds, Leeds, UK ([email protected])
Abstract
Background: As a critical technique in a digital pathology laboratory, automatic nuclear detection has been investigated for more than one decade. Conventional methods work on the raw images directly whose colour/intensity homogeneity within tissue/cell areas are undermined due to artefacts such as uneven staining, making the subsequent binarization process prone to error. This paper concerns detecting cell nuclei automatically from digital pathology images by enhancing the colour homogeneity as a preprocessing step.
Methods: Unlike previous watershed based algorithms relying on post-processing of the watershed, we present a new method which incorporates the staining information of pathological slides in the analysis. This preprocessing step strengthens the colour homogeneity within the nuclear areas as well as the background areas, while keeping the nuclear edges sharp. Proof of convergence for the proposed algorithm is also provided. After preprocessing, Otsu’s threshold is applied to binarize the image, which is further segmented via watershed. To keep a proper compromise between removing overlapping and avoiding over-segmentation, a naive Bayes classifier is designed to refine the splits suggested by the watershed segmentation.
Results: The method is validated with 10 sets of 1000 × 1000 pathology images of lymphoma from one digital slide. The mean precision and recall rates are 87% and 91%, corresponding to a mean F-score equal to 89%. Standard deviations for these performance indicators are 5.1%, 1.6% and 3.2% respectively.
Conclusions: The precision/recall performance obtained indicates that the proposed method outperforms several other alternatives. In particular, for nuclear detection, stain guided mean-shift turns out to be more effective than the direct application of mean-shift in preprocessing. Our experiments also show that preprocessing the digital pathology images with stain guided mean-shift gives better results than conventional watershed algorithms. Nevertheless, as only one type of tissue is tested in this paper, a further study is planned to enhance the robustness of the algorithm so that other types of tissues/stains can also be processed reliably.
2 Zhou et al. 2012
1 Background
In digital pathology, a stained tissue section is first placed under a microscope for scanning. Then digital imaging data can be collected, archived and shown to users such as pathologists. Overall, digital pathology offers unprecedented flexibility to pathologists’ clinical work, including a modern platform for carrying pathological inspection over the Internet.
As an important problem in digital pathology which has miscellaneous biological and medical applications, detecting nuclei automatically has been investigated for more than ten years [1]. There are numerous publications using algorithms such as: Hough transform [2], mean-shift [3], quick-shift [4], normalized cut [5], graph cut [6], watershed [7], colour-texture [8] and cumulative distribution function [9]. In addition, segmentation algorithms for 3D cellular data collected with laser scanning microscopy [10] and confocal microscopy [11] are also emerging.
Although there are a variety of methods in the literature, for analyzing colour pathology images generated by devices such as Aperio’s ScanScope series, there is still room for further improvement in terms of accuracy and efficiency, especially when compared with cell images from fluorescent microscopy [7]. One main reason behind this is that the colour pathology images have richer texture details than the fluorescence microscopy images. Although the affluence of texture is desirable for better human based diagnosis, it makes the computer based nuclear detection problem rather challenging.
This paper offers a fully automatic algorithm for detecting nuclei from colour pathology images. Instead of resorting to the post-processing of a watershed algorithm such as merging only, this paper incorporates a pre-processing step in the loop as well. Section 2 presents the details of this algorithm. The experimental results are presented in Section 3. Section 4 concludes this paper.
2 Methods
Fig. 1 presents an overview of our method. The first key step is pre-processing of the image which uses stain guided mean-shift (SGMS) filtering. The morphological watershed algorithm is then applied to generate the segmentation result. Finally, the watershed segmentation result is refined, leading to the final output.
2.1 Stain Guided Mean-Shift Filtering
Stain Guided Mean-Shift in nuclear detection 3 uniformity within the image area can be enhanced while the edge of the nucleus is preserved, the segmentation performance will be improved.
As a non-parametric clustering algorithm, mean-shift has attracted wide attention [14]. Comaniciu and Meer [3] applied mean-shift filtering in analyzing cell images which incorporates a sub-sampling procedure and is largely used as a reference method in nuclear detection [8].
For every pixel in the image, a colour vector can be constructed. Within the RGB colour space, every pixel has a colour vector x = (r, g, b). For a colour vector x0 , the standard mean-shift algorithm updates this colour vector with
the following equation:
0 0 0 ( ) ' 0 0 ( ) ( , ) ( , ) i i i i
x N x
i x N x
k x x x
x
k x x
, (1)where k(xi , x0 ) is the kernel function and N (x0) is the set of neighbourhood
pixels of x0 .
Unlike classic mean-shift algorithm which processes the input image within its neighbourhood area only, here we incorporate prior knowledge of pathology dyes into the filtering process to enhance the pre-processing. As shown in Fig. 1, k-means is applied to extract the three main colour vectors, which represents the three main/ dominant colours within one image: two stains and the background colour induced by the white lighting.
For instance, in Fig. 2, apart from the purple colour and pink colour, there are white areas in Fig. 2 as well, showing no tissue in the field of view. This white colour is the colour of the light source which also affects the image in a global manner.
Therefore, by introducing the stain colour vectors into the filtering process, the update algorithm for the colour vector in (1) is modified as follows:
0
'
0 0 0
( ) 1
( , ) ( , )
i i
i i i i
x N x s S
x k x x x k s x s
, (2)
where 0 0 0 ( ) ( , ) ( , ) i j i j
x N x s S
k x x k s x
. In the numerator of (2), the firstsummation represents the effect of local neighbourhood colours and the second summation represents the effect of stain colour vectors. The denominator is the normalization coefficient. S denotes the set of colour vectors for the two stains plus the light source. Compared with (1), (2) is governed by the stain and lighting colour vectors, therefore it is named as stain guided mean-shift (SGMS).
4 Zhou et al. 2012
2.2 Watershed Segmentation
After applying the SGMS filtering, the colour within the image is agglomerated, including the cytoplasm areas as well as the background areas. As shown in the Appendix, each pixel tends to converge to its closest global colour model. Thus by applying Otsu’s threshold, the nuclei areas, which are of darker colour, can be segmented with the watershed algorithm [7]. Fig. 3 shows an example in which Fig. 3(a) is the original image; Fig. 3(b) is the result of SGMS filtering; Fig. 3(c) shows the inverse distance transform result after applying a threshold to Fig. 3(b).
2.3 Detecting Isolated Nuclei
As shown in Fig. 3(c), after watershed processing, lots of catchment basins can be identified. A stand-alone catchment basin corresponds to one single nucleus area. In Fig. 3(d), these units represent the nuclei which are stained with haematoxylin and are not touching other cells.
With the availability of these stand-alone nuclei, statistics of the size, shape and colour can be extracted. Here the area of the nucleus region is employed to represent the size; aspect ratio to characterize the shape and the original colour vectors are utilized to extract the colour statistics. Therefore, there are 5 features to evaluate altogether. Statistics of these 5 features can be used to refine the over-segmented areas in the watershed which usually correspond to touching nuclei. The blue areas in Fig. 3(e) are examples of touching nucleus units.
2.4 Separating Touching Nuclei
To refine the watershed segmentation result, a naive Bayes mechanism is employed.
Firstly, for every touching nucleus unit in the initial segmentation, a hypothesis is made which is based on combinations of the catchment basins. Since there might be multiple catchment basins within one connected component, as shown in Fig. 3(e), different hypotheses, i.e., combinations of these catchment basins, are tested.
Secondly, the size, shape and colour statistics of the areas in the hypothesis are extracted and forwarded to the naive Bayes classifier whose output is defined as follows:
5
1 ( )
i
y f i
, (3)where f (i) is the binarized output obtained by testing one feature’s fitness against the obtained nuclei statistics. If the classifier output in (3) has a positive output, the hypothesis is accepted. Otherwise, the null hypothesis, which means the combination is invalid, will not be rejected.
Stain Guided Mean-Shift in nuclear detection 5
if one catchment basin passes more than one test, the hypothesis with the best fit to the nuclei statistics obtained in Section 2.3 will be accepted.
Fig. 3(f ) shows the final result of applying the proposed refinement scheme. As can be seen, the touching nuclei are split effectively and the spurious tiny noise is eliminated.
3 Results
3.1 Lymphoma Data
Fig. 4 shows an overview of the images selected for evaluating the nuclei detection algorithm in this paper. The original size of the images in Fig. 4 is 1000 × 1000. These images correspond to 10 randomly selected regions of one lymphoma tissue from a patient, which was formalin fixed and paraffin embedded initially and then cut into slices with 5 microns in thickness. After staining the tissue section with haematoxylin and eosin, the digital slide was collected with Aperio AT scanner (Aperio, Vista, CA, USA) with a spatial resolution of 0.23 microns per pixel. To evaluate the performance of the proposed algorithm, the ground truth of nuclei centres was generated by manually clicking on the raw data.
3.2 Detection Methods for Comparison
Here several nuclear detection methods are employed as references. These methods include: k-means of intensity, Canny operator, Laplacian of Gaussian (LoG), quick-shift [4], watershed, anisotropic diffusion (A-Diff ) [12, 13] and mean-shift [3].
For SGMS, a standard Gaussian kernel is used ( = 1). If the update of the image is smaller than a given threshold, or it has repeated more than 100 times, the algorithm will exit the loop. In the naive Bayesian classifier, we choose p=0.05.
3.3 Evaluation of Results
For nuclear segmentation/detection, there are four different types of results: correct detection, under segmentation - type A, under segmentation - type B and over-segmentation. Here the type A under segmentation is a false negative while type B under segmentation means that one unit covers more than one nucleus centre. Fig. 5 gives a schematic diagram illustrating the meaning of these four types of nuclear detection results.
We denote the number of nuclei in the ground truth as ng, the number of detected
nuclei as nd , the four types of results as , , , I I I I I I I V
n n n n respectively. The type B
under-segmentation can be counted in two ways. One way is to count the corresponding
number of ground truth I I I
g
n while the other way is to count the number of detected
nucleus units I I I
d
n . The relationship between these numbers can be summarized as
follows:
I I I
g
g I I I
n n n n , (4)
I I I
d
d I I V
n n n n . (5)
To compare the performance of different algorithms, we use precision/recall and F-number to measure the results.
6 Zhou et al. 2012
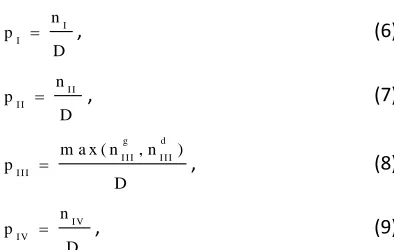
shown in Fig. 5, here 4 performance indicators are proposed as follows:
I I
n p
D
, (6)
I I I I
n p
D
, (7)
m a x ( g , d )
I I I I I I I I I
n n
p
D
, (8)
I V I V
n p
D
, (9)
where the denominator D is the maximum of ng and nd .
3.4 Results
For the ten images, the mean value plus the standard deviation of performance indicators are extracted to characterize the performance of eight algorithms. Table 1 and 2 summarize the results of experiments in which eight different algorithms are tested with respect to the ten lymphoma images.
Table 1 shows the nuclear detection results in precision/recall and F-measure. According to Table 1, SGMS gives the best mean F-measure as well as the best consistency of F-measure. For both the precision and recall rates, SGMS gives the best results with good consistency levels.
Table 2 summarizes the four types of detection results as defined in (6-9). It can be seen from Table 2 that the correct detection ratio for SGMS is the best when compared with other alternatives. In addition, according to the pI I in Table
2, SGMS has the minimum level of type A under-segmentation which is even less than the standard watershed. For type B under-segmentation (pI I I ) and
over-segmentation (pI V ), SGMS also gives good results.
Fig. 6 presents the computational costs in applying SGMS to analyze those images in Fig. 4. This is based on a personal computer with a dual core processor (3.40GHz) plus 16GB installed memory. As shown in Fig. 6, the processing time typically takes 90 seconds if the iteration number is set to 50 times. In practice, we set the number of iterations as 10 and it gives good results in general.
4 Conclusion
This study investigates automatic detection of tissue nuclei from pathological images. Instead of using watershed directly, we propose an algorithm to smooth the input image while preserving the edges of nuclei. Unlike the standard mean- shift algorithm which is based on local colours only, here by introducing the stain colour vectors, global stain information is incorporated into the filtering process. We tested the algorithm and compared the results with several alternative algorithms. Based on the results shown in Table 1 and 2, one can conclude that by processing the input image with SGMS filtering, the accuracy of watershed based nuclear detection is improved.
This study was exploratory on a small set of images. When compared with more complicated pathology images, the image set tested in this study is relatively simple since many nuclear borders are well separated and overlapping nuclei are a minority. Therefore, for the next step research, enhancing the algorithm on other types of human tissue constitutes a good direction.
[image:7.612.285.482.122.247.2]Stain Guided Mean-Shift in nuclear detection 7
Proof of Convergence for (2)
Suppose the input image is m × n. Firstly, the update equation in (2) can be rewritten in vector-matrix format as follows:
1
k k k k
X A X B S , (10)
where Xk is the vector representing the current image in k-th iteration and S
represents the stain vectors. Ak is an mn × mn square matrix and Bk is an mn ×
3 matrix. Both Ak and Bk are determined by the selected kernel function and
they are normalized to satisfy
3
1 1
( , ) ( , ) 1
m n
k k
j j
A i j B i j
. If the kernel functionin (2) is Gaussian, we have ( , ) 0 k
A i j and ( , ) 0
k
B i j . Therefore,
1
( , ) 1
m n
k j
A i j
, (11)i.e., Ak 1. Since for every eigenvalue of Ak , (Ak) Ak 1, it
yields
(Ak) 1
. (12)
According to modern control theory [15], (12) means Xk in (10) is convergent,
i.e., (2) is convergent.
References
1. Gurcan, M.N., Boucheron, L.E., Can, A., Madabhushi, A., Rajpoot, N.M. and Yener, B.: Histopathological Image Analysis: A Review. IEEE Reviews in Biomedical Engineering. 2, 147-171 (2009)
2. Magee, D., Chomphuwiset, P., Treanor, D., Quirke P.: Context Aware Colour Classification in Digital Microscopy. In: Proceedings of Medical Image Understanding and Analysis, London (2011)
3. Comaniciu, D. and Meer, P.: Cell Image Segmentation for Diagnostic Pathology. In: Suri, J.S., Setarehdan, S. and Singh, S. (eds.) Advances in Computer Vision and Pattern Recognition 2002. pp. 541-558, Springer, London (2002)
4. Vedaldi, A. and Fulkerson, B.: Vlfeat: an open and portable library of computer vision algorithms. Proceedings of the International Conference on Multimedia 2010. pp. 1469-1472 (2010)
5. Bernardis, E. and Yu, S.X.: Pop out many small structures from a very large microscopic image. Medical image analysis. 15(5), 690-707 (2011)
6. Al-Kofahi, Y., Lassoued, W., Lee, W. and Roysam, B.: Improved Automatic Detection and Segmentation of Cell Nuclei in Histopathology Images. IEEE Transactions on Biomedical Engineering. 57(4), 841-852 (2010)
7. Chen, X., Zhou, X. and Wong, S.T.C.: Automated segmentation, classification, and tracking of cancer cell nuclei in time-lapse microscopy. IEEE Transactions on Biomedical Engineering. 53(4), 762-766 (2006)
8. Kong, H., Gurcan, M. and Belkacem-Boussaid, K,: Partitioning histopathological images: An integrated framework for supervised color-texture segmentation and cell splitting. IEEE Transactions on Medical Imaging. 30(9), 1661-1677 (2011)
9. Hagwood, C., Bernal, J., Halter, M. and Elliott, J.: Evaluation of segmentation algorithms on cell populations using CDF curves. IEEE Transactions on Medical Imaging, 31(2), pp. 380-390 (2012)
10. Kriv, Z., Mikula, K., Peyriras, N., Rizzi, B., Sarti, A., Staov, O.: 3D early embryogenesis image filtering by nonlinear partial differential equations. Medical Image Analysis, 14 (4), pp. 510-526 (2010)
8 Zhou et al. 2012
spots. Cytometry Part A, 81(3), pp. 198-212 (2012)
12. Perona, P. and Malik, J.: Scale-Space and Edge Detection Using Anisotropic Dif- fusion. IEEE Trans. Pattern Anal. Mach. Intell. 12(7), 629-639 (1990)
13. Mendez-Rial, R., Martin-Herrero, J.: Efficiency of semi-implicit schemes for anisotropic diffusion in the hypercube. IEEE Transactions on Image Processing, 21(5): 2389-2398 (2012)
14. Comaniciu, D. and Meer, P.: Mean Shift: A Robust Approach Toward Feature Space Analysis. IEEE Trans. Pattern Anal. Mach. Intell. 24(5), 603-619 (2002)
Stain Guided Mean-Shift in nuclear detection 9
Figure legend
Fig. 1 Flowchart of nuclear detection process.
Fig. 2 (a) Digital pathology image of lymphoma; (b) selected area of interest in (a).
Fig. 3 Watershed segmentation of stain guided mean-shift images. (a) raw picture; (b) stain guided mean-shift; (c) inverted distance transform; (d) stand- alone catchment basins; (e) touching nuclei and (f ) final result.
Fig. 4 Ten sets of lymphoma images for evaluating the nuclear detection algorithm.
Fig. 5 4-types of detection results. ’+’s are manually assigned nucleus centres. (2)(3)(4) - correct detections; (5) type A segmentation; (1) type B under-segmentation and (6) over-under-segmentation.
10 Zhou et al. 2012
Table 1. Results of experiments (mean value and standard deviation).
measure Precision (%) Recall (%) F-measure (%)
K-means 74(6.0) 57(13) 64(9.6)
Canny edge 79(5.5) 52(11) 63(9.1)
LoG 73(4.1) 64(18) 67(13)
Quick-shift 72(8.1) 30(17) 41(18)
Watershed 72(7.6) 90(6.5) 80(6.1)
A-Diff 76(6.3) 57(13) 64(9.7)
Mean-shift 79(8.2) 85(22) 81(17)
SGMS 87(5.1) 91(1.6) 89(3.2)
Table 2. Records of four types of detections (mean value and standard deviation).
Detection pI (%) pI I (%) pI I I (%) pI V (%)
K-means 56.9(12.0) 29.2(7.45) 13.7(6.0) 14.3(3.7)
Canny edge 52.4(11.0) 25.3(5.4) 22.3(6.9) 44.6(2.4)
LoG 62.7(16.9) 34.7(18.8) 0.6(0.5) 22.7(8.1)
Quick-shift 30.4(16.7) 42.9(17.4) 26.8(11.9) 4.0(2.6)
Watershed 72.7(7.4) 9.0(6.6) 0.1(0.1) 27.3(7.3)
A-Diff 56.4(12.3) 29.5(7.2) 14.0(6.23) 12.4(3.9)
Mean-shift 75.1(18.9) 12.3(22.7) 1.5(0.8) 18.1(3.7)