White Rose Research Online URL for this paper:
http://eprints.whiterose.ac.uk/95102/
Version: Accepted Version
Article:
Prisutova, J., Horoshenkov, K. orcid.org/0000-0002-6188-0369, Groby, J-P. et al. (1 more
author) (2014) A method to determine the acoustic reflection and absorption coefficients of
porous media by using modal dispersion in a waveguide. Journal of the Acoustical Society
of America, 136 (6). pp. 2947-2958. ISSN 0001-4966
https://doi.org/10.1121/1.4900598
[email protected] https://eprints.whiterose.ac.uk/ Reuse
Unless indicated otherwise, fulltext items are protected by copyright with all rights reserved. The copyright exception in section 29 of the Copyright, Designs and Patents Act 1988 allows the making of a single copy solely for the purpose of non-commercial research or private study within the limits of fair dealing. The publisher or other rights-holder may allow further reproduction and re-use of this version - refer to the White Rose Research Online record for this item. Where records identify the publisher as the copyright holder, users can verify any specific terms of use on the publisher’s website.
Takedown
If you consider content in White Rose Research Online to be in breach of UK law, please notify us by
the acoustic reflection and absorption coefficients
of porous media by using modal dispersion
in a waveguide
Jevgenija Prisutova
a)Department of Mechanical Engineering, University of Sheffield,
Sheffield, S1 3JD, UK
Kirill Horoshenkov
Department of Mechanical Engineering, University of Sheffield,
Sheffield, S1 3JD, UK
Jean-Philippe Groby
Laboratoire d’Acoustique de l’Universit´e du Maine, UMR6613 CNRS/Univ. du Maine,
F-72085 Le Mans Cedex 9, France
Bruno Brouard
Laboratoire d’Acoustique de l’Universit´e du Maine, UMR6613 CNRS/Univ. du Maine,
F-72085 Le Mans Cedex 9, France
The measurement of acoustic material characteristics using a standard impedance tube
method is generally limited to the plane wave regime below the tube cut-on frequency. This
implies that the size of the tube and, consequently the size of the material specimen must
remain smaller than a half of the wavelength. This paper presents a method which enables
the extension of the frequency range beyond the plane wave regime by at least a factor of
3, so that the size of the material sample can be much larger than the wavelength. The
proposed method is based on measuring of the sound pressure at different axial locations
and applying the spatial Fourier transform. A normal mode decomposition approach is used
together with an optimization algorithm to minimize the discrepancy between the measured
and predicted sound pressure spectra. This allows the frequency and angle dependent
reflec-tion and absorpreflec-tion coefficients of the porous layer to be calculated in an extended frequency
range. The method has been tested successfully on samples of melamine foam and wood
fibre. The measured data are in close agreement with the predictions by the equivalent fluid
PACS: 43.20 Mv, 43.20 Ye, 43.55 Ev, 43.58 Bh
Keywords: absorption measurements, acoustic intensity, porous media, modal dispersion
I. INTRODUCTION
Impedance tube measurements are used extensively for acoustic material
characterization. The procedure for the determination of the plane wave, normal incidence
acoustic absorption coefficient of a material is detailed in ISO 10534-2
1. However, the high
frequency limit for this regime is restricted by the diameter of a circular tube,
d
, ot the side
length of a square cross-section tube. In this case, the standard requirement is that the
minimum wavelength,
λ
, at which the measurement procedure works is
λ >
1
.
72
d
(or
λ >
2
d
when the impedance tube is of a square cross-section of side
d
). As a result, there is
often a conflict between the high frequency limit which needs to be achieved and the size of
the samples which the tube is able to accommodate in order to determine the acoustical
absorbing properties for a representative area of the material specimen. Several efforts have
been made in the past to overcome this problem. Coulon
et al
used an impedance tube
coupled with a horn
2to increase the area of the sample which can be tested under the
plane wave regime. This method is believed to work well provided there is little or no
scattering of the incident plant wave into higher order modes. Akoum and Ville
3and
Schultz
et al
4have been the first to propose multi-modal decomposition methods which
reflection and absorption properties of relatively large material specimens beyond the
maximum frequency of the plane wave regime in an acoustic waveguide. However, these
works are based on the use of a number of microphone pairs installed at several
cross-sectional positions near the terminated end of the waveguide. It can be argued that
the use of several microphones increases the probability of a phase mismatch and can be
time-consuming in terms of calibration. Additionally, the proximity of these microphones
to the acoustic termination can result in a poor signal-to-noise ratio, problems associated
with the standing waves in the tube and with the influence of the evanescent modes near
the tube termination. Out-of-tube methods of the reflection and absorption measurements
at oblique incidence also exist, as it was detailed by Tamura
5,
6. In these papers, the
numerical method to measure the reflection coefficient at the range of angles is described
and its predictions are compared to experimentally obtained results for two types of
material. One can assume the theoretical underpinning of the Tamura’s method enables us
to suggest that this method can be more stable than the one described in this paper, as it
does not employ numerical fitting and function minimization. However, the method by
Tamura predicts the total reflection coefficient instead of modal reflection coefficient, which
might be of interest in some cases. The experimental setup detailed in Tamura’s paper is
also not easy to run, as it requires an anechoic chamber to control the unwanted reflections,
(over 200 positions according to
6). The authors in the Tamura’s paper do not provide any
data for the acoustical properties of the tested materials below 500 Hz. This enables us to
suggest that this method suffers from a typical limitation of those methods which require
the compensation for the edge diffraction effect, which, however, depends on the source
used.
This paper presents an alternative method for measuring the reflection and absorption
coefficient of a relatively large specimen of rigid frame porous media in an acoustic
waveguide of square cross-section for which
λ << d
. The method makes use of the sound
pressure and intensity of multi-modal field in a waveguide with rigid walls and absorbing
termination in the form of a rigidly backed porous material specimen. It is based on
one-dimensional Fourier transform which is applied to the sound pressure data recorded
with a single microphone roving along the axial direction of the waveguide to simulate a
horizontal microphone array. This method can be potentially free from the calibration
problems and it is arguably less prone to the influence of the evanescent modes and
problems from a poor signal-to-noise ratio caused by standing waves in the pipe. The
Johnson-Champoux-Allard equivalent fluid model
7for the acoustical properties of porous
media is used to predict the measured reflection and absorption coefficient spectra for the
investigated material specimen. It is found that these spectra are in good agreement with
smaller material specimens.
II. EXPERIMENTAL METHODOLOGY
A. Acoustic setup
The reported experiments were carried out using the large impedance tube facilities
available at the Laboratoire d’Acoustique de l’Universit´e du Maine (LAUM). A sketch of
an experimental setup is presented in Fig. 1. The impedance tube is a square waveguide
constructed from 38 mm thick panels of medium density fibreboard which are varnished to
ensure that the walls are perfectly reflective so that they do not contribute noticeably to
the level of air attenuation expected for this tube. The absorption of the empty tube was
quantified and it does not exceed 15% in the plane wave regime, slightly increasing in the
vicinity of the first cut-on frequency. The tube is 4.15 m long and the dimensions of the
square cross-section are 300 mm x 300 mm. According to the standard method the high
frequency limit for the plane wave regime in this tube was 572 Hz assuming that the sound
speed was
c
0= 343 m s
−1
at 20
◦C
1. One end of this tube was terminated with a 30 mm
thick aluminium lid, and at the opposite end there were three loudspeakers (S1-S3) which
were connected in parallel as shown in Fig. 1. The coordinates of the centers of these three
speakers were (50 mm, 50 mm), (50 mm, 150 mm), (150 mm, 150 mm), for speakers S1, S2
propagating modes which can be excited in the adopted frequency range of 50 to 1800 Hz.
A porous material sample was accurately cut to fit the cross-section of the tube and
attached to the metal lid end without an air gap. The signal used for the sound field
excitation was a step-by-step sine sweep, ranging from 50 to 1800 Hz, with a step of 12 Hz.
A single 1/4” B&K microphone was used to avoid problems with phase and amplitude
mismatch. This microphone was placed in the corner of the pipe’s cross-section, at
x
m= 5
mm,
y
m= 5 mm, where the amplitude of all the modes was maximum. The pressure
readings were taken at 52 axial positions and the movement of the microphone was
controlled by a robotic arm. The first position of the microphone was at the 5 mm distance
from the porous material sample, and then the microphone was moved at a 40 mm step,
which is consistent with the minimum spacing interval permitted by the Nyquist sampling
theorem. This spacing enables us to measure the spatial spectrum with the minimum
wavelength of 80 mm. Also, this combination of spacing and maximum adopted frequency
allows to avoid the spatial aliasing problem in frequency-wavenumber space. The data were
acquired using a Stanford Research Systems SR785 signal analyser which enabled us to
record the sound pressure signals and store the sound pressure spectra in the text file
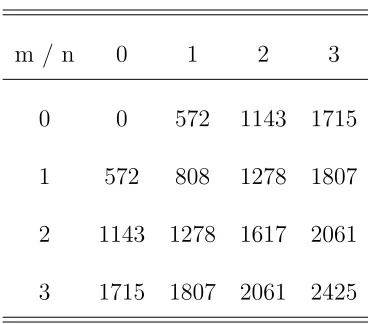
format. The frequency resolution of this system was 12 Hz. Two materials were studied in
this experiment: (a) melamine foam, and (b) wood fibre. The material characteristics are
m / n
0
1
2
3
0
0
572
1143 1715
1
572
808
1278 1807
2
1143 1278 1617 2061
[image:9.595.213.397.121.283.2]3
1715 1807 2061 2425
Table 1: The values of the cut-on frequencies in Hz for a 300 mm square waveguide.
B. Theoretical background
The spatial Fourier transform can be applied to the sound pressure spectra obtained
from the described experiments to determine the relations between the wavenumber and
frequency spectra (convention
e
−iωt). The Fourier integral was applied in the spatial
domain and it was approximated with a sum which was taken using the trapezoidal rule,
leading to ˜
p
m(
K, ω
). This trapezoidal rule was applied to the sound pressure data
p
m(
z, ω
)
measured at the N = 52 discrete microphone positions:
˜
p
m(
K, ω
) =
∞
Z
−∞
p
m(
z, ω
)
e
iKzdz
≃
∆
2
N−1
X
j=1
p
m(
z
j+1, ω
)
e
iKzj+1+
p
m(
z
j, ω
)
e
iKzj,
(1)
where ∆ is the separation between two subsequent microphone positions in the axial
direction (i.e. 40 mm),
z
jand
z
j+1are the
j
-th and (
j
+ 1)-th axial positions, respectively.
The sound pressure
p
m(
z, ω
) in a square waveguide (square impedance tube) which is
superposition of an infinite number of normal modes:
p
(
z, ω
) =
∞X
m=0 ∞X
n=0cos
mπ
a
x
cos
nπ
a
y A
mne
−ikmnz
+
A
mnR
mne
ikmnz,
(2)
where
x, y
and
z
are the coordinates of the microphone,
m, n
are the indices of the modes
propagating in the tube,
a
is the width of the tube cross-section,
k
mnis the modal
wavenumber,
k
mn=
q
k
2−
mπ a 2−
nπ a 2, with
k
= 2
π f /c
, and
A
mnare the modal
excitation coefficient in the incident sound wave and
R
mnare the unknown modal reflection
coefficients which depend on the frequency, on the angle at which the mode is incident on
the termination and on the acoustical properties of the porous material from which the
specimen at this termination is constructed. The values of the cut-on frequencies for the
first few normal modes for the particular impedance tube used in this experiment are
presented in Table 1 (at 20
◦C). The Fourier transform of Eq.(2), leading to ˜
p
m(
K, ω
), is
˜
p
(
K, ω
) =
∞X
m=0 ∞X
n=0cos
mπ
a
x
cos
nπ
a
y
A
mn∞
Z
−∞
e
i(K−kmn)zdz
+
A
mn
R
mn∞
Z
−∞
e
i(K+kmn)zdz
.
(3)
Eq.(3) can be analytically simplified by replacing the infinite integration limits with
take the following form:
˜
p
(
K, ω
) =
∞X
m=0 ∞X
n=0cos
mπ
a
x
cos
nπ
a
y
× · · ·
· · ·
A
mne
i(K−kmn)z2 +z1 2
(
z
2
−
z
1) sinc
(
K
−
k
mn)
z
2−
z
12
+
· · ·
· · ·
A
mnR
mne
i(K+kmn)z2 +z1 2
(
z
2
−
z
1) sinc
(
K
+
k
mn)
z
2−
z
12
,
(4)
where sinc
z
=
sinzz. In Eq.(4)
A
mnand
R
mnare the unknowns which have to be
determined for every mode and frequency. For this purpose, the optimization algorithm
was applied to the cost function
F
to minimize the difference:
min
Amn,Rmn
F
(
ω
) =
Kmax
X
Kmin
|
p
˜
m(
K, ω
)
−
p
˜
(
K, ω
)
|
2,
(5)
for each of the angular frequencies
ω
in the measured modal pressure spectra ˜
p
m(
K, ω
). In
the above expression
F
is the cost function to be minimized, ˜
p
(
K, ω
) is the predicted sound
pressure expressed with Eq.(4) and
K
minand
K
maxare the minimum and maximum values
of the wavenumber in the wavenumber spectra for which the measured data are available,
respectively. These values range from
−
25 m
−1to 25 m
−1with the step of
≃
0
.
049 m
−1.
It is convenient to express the modal amplitude and the modal reflection coefficient in
the following form:
A
mn=
a
mne
iφmn,
A
mnR
mn=
b
mne
iψmn,
(6)
where
a
mn,
b
mnare the absolute values of the forward and backward waves, i.e.
A
mnand
numbers which are convenient to use in the minimization procedure to estimate the
amplitudes and phases in the incident and reflected normal waves. These can then be
combined to represent the proportion of the sound energy in the reflected sound wave and
the proportion of the sound energy absorbed by the porous specimen through the
decomposition of normal waves at a particular frequency. Four examples of the application
of the minimization procedure are shown in Fig. 2, presenting the data in two different
frequency regimes: plane wave (214 Hz) and fully modal (1236 Hz). These examples are for
a 82 mm hard-backed layer of melamine foam. The figures show the amplitudes and phases
as functions of the wavenumber before (upper subplots) and after (lower subplots) the
application of the minimization procedure. The amplitudes
A
mnand
A
mnR
mnof the
wavenumber in the upper subplots were initially assumed to be equal to 1, and the phases
φ
mnand
ψ
mn- equal to 0. The results suggest that the minimization procedure enables us
to match very closely both the amplitude and the phase of the reflection coefficient below
the cut-on frequency with the mean error
ǫ
of 1.1% for the amplitude and 1.9% for the
phase calculated using
ǫ
=
Nw
P
w=1
|
p
˜
m−
p
˜
|
Nw
P
w=1
˜
p
m+ ˜
p
2
.
(7)
This error can be higher (of the mean value of 5.3% and 23.2%, respectively) when several
The minimization procedure (5) was applied to recover the absolute values of the
modal amplitudes and phases in the considered range of frequencies so that the modal
reflection coefficients were determined by the following expression:
R
mn=
b
mne
iψmna
mne
iφmn.
(8)
The procedure was performed by making use of MATLAB in-built
fminsearch
function. It was applied to each mode separately, i.e. the adopted frequency range was
divided into several regions, limited by modal cut-on frequencies from each side (50-572 Hz,
572-808 Hz, 808-1143 Hz, 1143-1278 Hz, 1278-1617 Hz and 1617-1800 Hz). In each region,
amplitudes and phases of incident and reflected waves were recovered for each propagating
mode, frequency-by-frequency, so for the frequency band of 50-572 Hz amplitudes and
phases were recovered for the fundamental mode only, for the frequency band of 572-808
Hz - for the fundamental mode and the first higher mode, etc. The recovered values were
imprecise in the vicinity of the cut-on frequencies, but as soon as the frequency of interest
was about 40 Hz from the cut-on, the recovered values stabilized.
The absorption coefficient for the plane wave regime,
α
00, was then calculated in the
following standard manner:
α
00= 1
− |
R
00|
2.
(9)
This acoustical quantity does not account for the energy dissipated by the higher order
dissipated through the high order mode absorption mechanisms was calculated using the
following expression, which comes from the energy conservation law:
α
(
ω
) = 1
−
P
mn
Re(kmn)
εmεn
k
A
mnR
mnk
2
P
m′n′
Re(km′n′)
ε′
mε′n
k
A
m ′n′k
2,
(10)
where
ε
m(m=0)= 1 and
ε
m(m>0)= 2. The detailed derivation of this expression is provided
in Appendix A.
The angles at which the higher modes impinged on the porous material surface were
calculated separately for each mode by making use of the following formula:
θ
mn(
ω
) = arccos
q
ω c 2−
mπa 2−
nπa 2ω/c
0
,
(11)
where
m, n
are the indices of the modes propagating in the tube.
III. EQUIVALENT FLUID MODEL
It is of direct interest to compare the acoustic reflection and absorption coefficients for
the porous materials studied with the proposed experimental method against those
obtained from the application of the standard impedance tube method detailed in the ISO
10534-2 standard
1. It is also of interest to use an equivalent fluid model to predict the
observed acoustic behavior of the porous material specimens. For this purpose the
experiment with the material samples was carried out in a standard impedance tube which
range for this tube was 400 - 6000 Hz. The equivalent fluid model was the
Johnson-Champoux-Allard model
7which enabled us to predict the dynamic density
˜
ρ
eq(
ω
) =
ρ
0α
∞"
1 +
σφ
iα
∞ρ
0ω
1 +
4
iα
2
∞
ηρ
0ω
σ
2Λ
2φ
2 1/2#
,
(12)
and the dynamic bulk modulus
˜
K
eq(
ω
) =
γP
0
γ
−
"
(
γ
−
1)
1 +
σφ
iα
∞ρ
0N
P rω
1 +
4
iα
2
∞
ηρ
0N
P rω
σ
2Λ
2φ
2 1/2#
−1,
(13)
where
η
is the viscosity of air,
γ
is the specific heat ratio of air,
P
0is the air equilibrium
pressure,
ρ
0is the density of air, and
N
P ris the Prandtl number.
The following formulae were used for the calculation of the impedance and the modal
reflection coefficients at oblique incidence.
Z
s(
ω
) =
−
i
Z
ccos
θ
t(
ω
) cot(
k
c(
ω
) cos
θ
t(
ω
)
d
s)
,
(14)
Z
c(
ω
) =
q
˜
ρ
eq(
ω
) ˜
K
eq(
ω
)
, k
c(
ω
) =
ω
s
˜
ρ
eq(
ω
)
˜
K
eq(
ω
)
,
(15)
R
mn(
ω
) =
Z
s(
ω
) cos
θ
mn−
ρ
0c
0Z
s(
ω
) cos
θ
mn+
ρ
0c
0,
(16)
where
sin
θ
mn(
ω
)
c
0=
sin
θ
t(
ω
)
c
′(
ω
)
,
(17)
d
sis the material sample thickness,
θ
mnis the angle of incidence in air, and
θ
tand
c
′
are
form of Snell’s law of refraction
8. The non-acoustical parameters used in the above
equations are:
σ
is the flow resistivity,
φ
is the porosity,
α
∞is the tortuosity, Λ is the
viscous characteristic length, and Λ
′is the thermal characteristic length. The values of
these parameters are provided in Table 2. These values were obtained using a standard
parameter characterization procedure which was carried out by Centre de Transfert de
Technologie du Mans (CTTM).
Parameter
Melamine foam
Wood fibre
Units
Porosity (
φ
)
0.99
0.98
-Tortuosity (
α
∞)
1.01
1.07
-Flow resistivity (
σ
)
1
.
1
·
10
45
.
0
·
10
3Pa
·
s
·
m
−2Viscous characteristic length (Λ)
1
.
2
·
10
−41
.
0
·
10
−4m
Thermal characteristic length (Λ
′)
2
.
4
·
10
−42
.
0
·
10
−4m
[image:16.595.100.513.300.514.2]Layer thickness (
d
)
0.082
0.095
m
Table 2: Characteristics of porous materials
IV. RESULTS AND DISCUSSION
Figs. 3 and 4 present the wavenumber-frequency spectra for the sound pressure in the
300 mm x 300 mm impedance tube in the presence of a layer of melamine foam (Fig. 3)
between the first six cross-sectional modes (including the fundamental mode) which are
excited in the impedance tube in the frequency range of 50 - 1800 Hz and at a range of
angles of incidence
−
π/
2
< θ
mn(
ω
)
<
+
π/
2. The waves with positive wavenumbers in Figs.
3 and 4 correspond to those modes which propagate towards the porous layer, whereas the
waves with the negative wavenumbers are the modes reflected by the porous layer. This
enables us to determine the acoustic reflection coefficient of the porous layer in the
frequency range that is much broader than that suggested in the ISO 10534 document
1and
for a range of the angle of incidence. This can be achieved using the modal decomposition
method and optimisation technique detailed in Section II. The relationship between the
value of the angles
θ
mn(
ω
),
θ
t(
ω
), the frequency
f
=
ω/
2
π
and the modal number is
illustrated graphically in Fig. 5 for the case of melamine foam (see Eq. (17)).
Figs. 6 and 7 show the real and imaginary parts of the modal reflection coefficients as
a function of the frequency and the incidence angle which were obtained from the analysis
of the wavenumber-frequency spectra for the layer of melamine and wood fibre,
respectively. The solid line denotes the experimental data obtained through the application
of optimization algorithm (5), whereas the dashed line is the numerical simulation results
obtained using the Johnson-Champoux-Allard equivalent fluid model via expression (16).
The experimental data are only provided for those frequencies at which the signal to noise
frequency range below the first cut-on frequency at 572 Hz. The differences between the
real and imaginary parts of the measured and predicted modal reflection coefficients were
quantified in terms of the mean difference given by
ǫ
Re= 1
/N
q NqX
q=1
|
Re(
R
(m)mn(
ω
q)
−
R
mn(
ω
q))
|
, ǫ
Im= 1
/N
q NqX
q=1
|
Im(
R
(m)mn(
ω
q)
−
R
mn(
ω
q))
|
,
(18)
where
R
(m)mn(
ω
q) is the experimentally determined modal reflection coefficient,
R
mn(
ω
q) is
the predicted reflection coefficient and
N
qis the number of frequency points in the
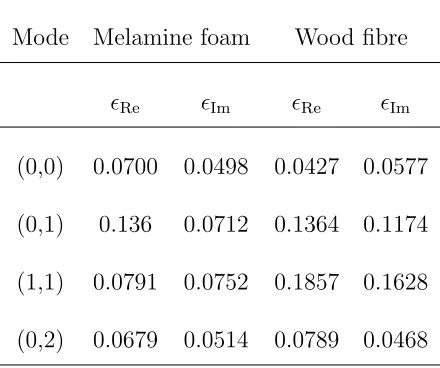
reflection coefficient spectrum. These differences are presented in Table 3. The differences
between the measured and predicted plane wave reflection coefficient are below 0.07. The
maximum difference of 0.19 is between the real parts of the measured and predicted
reflection coefficient for mode (11) for the case of wood fibre sample. These errors are
attributed to the fact that the measured amplitude of the fundamental mode becomes
relatively low above the cut-on frequency of the (01)-mode (572 Hz). A similar effect can
be observed in the case of the (11)-mode, the amplitude of which becomes relatively low
above the cut-on frequency of the (02)-mode (1143 Hz). This can be explained by the fact
that the adopted speaker arrangement (see Fig. 1) and the cross-sectional position of the
microphone array in a corner of the tube favored the excitation of the (01) and (02) modes
particularly in the vicinity of their cut-on frequencies. As a result, the signal to noise ratio
for some modes at some frequencies and angles was limited so that the recovered reflection
conducted in a circular cross-section tube suggests that this phenomenon does not occur at
all, or it is much less pronounced when the microphone array is in the middle of the tube
10.
It is also likely that a better speaker arrangement is required to make use of the
orthogonality of the mode shapes in the tube so that the mode filtering which is currently
attained with Eq. 3 can be enhanced as suggested by Vinogradov and Gavrilov
9. Another
solution is to make use of the orthogonality of normal modes to maximize the excitation
coefficients by adopting speakers connected in the form of a phased array.
Mode Melamine foam
Wood fibre
ǫ
Reǫ
Imǫ
Reǫ
Im(0,0)
0.0700
0.0498
0.0427 0.0577
(0,1)
0.136
0.0712
0.1364 0.1174
(1,1)
0.0791
0.0752
0.1857 0.1628
[image:19.595.196.416.331.515.2](0,2)
0.0679
0.0514
0.0789 0.0468
Table 3: A summary of the mean differences between the real and imaginary parts of the
measured and predicted modal reflection coefficients for the two material samples.
A common feature between the Figs. 6 and 7 is that the largest discrepancies between
the measured and predicted values of the modal reflection coefficients are in the vicinity of
errors are small. The possible explanation of this is that the integration limits in the
Fourier transform analysis were not sufficiently large to capture the modal pressures at or
near a cross-sectional resonance. At a cut-on frequency or near it, the modal attenuation is
relatively low whereas the modal phase velocity is relatively high so that the adopted
spatial length of the FFT window in Eq. (1) may not be sufficiently long to capture a
representative lengths of the modal wavefront. The other issue is cross-sectional modes
were not properly excited above the frequency of the next cross-sectional resonance.
Possible solutions to this issue have already been discussed in the previous paragraph.
Figs. 8 and 9 present the total absorption coefficient spectra in the frequency range of
50 - 1800 Hz. The experimental and theoretical values of the total absorption coefficient
were calculated from Eq. (10) using the measured and predicted sound pressure level
spectra, respectively. The discrepancy between the measured and predicted absorption
coefficient was quantified in terms of the relative error in a way similar to that described by
Eq. (7). The error between the experimental and predicted total absorption coefficient is
equal to 3.7% in case of the melamine foam and it is 3.3% in case of the wood fibre. These
figures also show the theoretical and experimental values of the plane wave absorption
coefficient, which were calculated using the sound pressure data obtained in the 29 mm
impedance tube in accordance with the ISO 10534-2 procedure
1and predicted using Eqs.
measured total absorption coefficient (Eq. (10)) and measured plane wave absorption
coefficient (Eq. (9)) for an entire frequency range is 3.2% for the melamine foam and 5.1%
for the wood fibre. However, one should not expect a full agreement between these two
cases, as absorption in the 29 mm and 300 mm impedance tubes is not the same beyond
the first cut-on frequency of the latter.
The match between the predicted and measured total absorption coefficient data is
remarkably close until the first cut-on frequency of 572 Hz. At the first cut-on frequency
there is a sharp decrease in the experimental absorption coefficient for both melamine foam
and wood fibre which is partly matched by the predicted data. This decrease takes place
each time when the frequency of sound approaches a cross-sectional resonance when the
incident angle for the normal mode becomes large. In the case of melamine foam the
predicted data match better the behavior of the measured total absorption coefficient
between the resonances than near these resonances. For this material, the total absorption
coefficient appears to fluctuate about the spectrum of the normal incidence, plane wave
absorption coefficient. In the case of wood fibre, the predicted total absorption coefficient
spectrum agrees better with the measured data across the whole frequency range than it
does in the case of melamine foam. The total absorption coefficient for wood fibre material
appears 5-10% higher than the normal incidence, plane wave absorption coefficient for this
between the normal incidence and diffused absorption coefficient, matching the diffused
field absorption coefficient at the cut-on frequencies. Another thing which can be remarked
is that for both materials the amplitude of the experimental absorption coefficient is higher
than of the predicted. It can be attributed to the fact that the walls of the waveguide are
not perfectly reflecting and partially absorb sound.
V. CONCLUSIONS
This paper presents a new method to measure the reflection and absorption
coefficients of a porous layer in an impedance tube which lateral dimensions are larger than
the acoustic wavelength. The proposed method is based on measuring the sound pressure
spectra with a horizontal microphone array and then applying the spatial Fourier transform
to these data to separate the incident modal field from the modal field reflected from the
porous layer. It has been shown that in this way the high frequency limit of a rectangular
impedance tube can be extended at least by a factor of three. This enables us to measure
the acoustical properties of much larger material specimens well beyond the high frequency
limit that is currently set in the standard
1. A most attractive feature of this method is
that it yields both frequency and angular dependent complex reflection coefficient data for
a porous layer. This enables us to measure in the laboratory the acoustical properties of a
large porous specimen at a range of the angles of incidence and in a relatively wide
are subsequently used in the spatial Fourier transform
6, the proposed method does not
require the compensation for the edge diffraction effect because of the sample being present
in a bounded waveguide with acoustically hard walls. This enables us to measure reliably
the acoustical properties of large material specimens in the low frequency end (50 Hz in the
presented work). Furthermore, the proposed experimental setup is rather time-efficient and
easy to run and it does not require large material specimen. The reason for choosing the
high frequency end equal to 1800 Hz was the balance between the measurement time, the
number of measurement points per wavelength and maximum frequency in the reflection
coefficient spectra to which the standard method can be extended. The wavelength of the
plane wave at 1800 Hz is
λ
= 188 mm at
T
= 20
◦C
. The step between the measurement
positions is 40 mm which is just under
λ/
5. Increasing this limit further will require a
proportionate reduction in the spatial step to ensure that integral (1) is accurately
evaluated. This will result in the proportionate increase in the duration of the experiment
leading to measurements taking excessive amount of time.
The proposed method has been used to obtain the complex reflection coefficient and
absorption coefficient spectra for a layer of melamine foam and wood fibre. These materials
have been characterized independently to derive the values of non-acoustical parameters so
that the Johnson-Champoux-Allard equivalent fluid model
7could be used to predict the
of materials. It has been shown that a good match between the measured and predicted
modal reflection coefficients across the whole frequency range can be achieved using an
optimization analysis whereby the difference between the measured and predicted spatial
sound pressure spectra is minimized for a given frequency of sound. The measured and
predicted modal reflection coefficient frequency spectra agree within 5-15%, whereas the
absorption coefficient spectra agree within 5%. The agreement between the absorption
coefficient spectra measured using the proposed measurement method and the normal
incidence, plane wave absorption coefficient spectra measured in the 29 mm impedance
tube is within 5-10% across the whole frequency range. However, it is not possible to
achieve a total agreement between these two cases at frequencies higher than the first
cut-on frequency of the 300 mm impedance tube, as beyond it the measurements are not
equal. The agreement between the measured and predicted absorption coefficient spectra is
particularly close in the plane wave regime below the frequency of the first cross-sectional
resonance. However, in the vicinity of a cross-sectional resonance this agreement can
deteriorate, making the results imprecise. This happens due to some cross-sectional modes
beginning to dominate whereas the others are not excited strongly enough to be resolved
with the proposed modal analysis method. A poor signal to noise ratio affects the accuracy
with which the modal reflection coefficients can be derived using the optimization
repeating the measurements with the same microphone array moved to an alternative
cross-sectional position in the impedance tube. The influence of the microphone at high
frequencies has been neglected, as well as the absorption of the tube, which might have
contributed to the discrepancies between the experimental results and the predictions in
higher frequency range. The ability to excite a sufficient number of modes and to capture
these modes accurately by positioning the microphone at those locations where the modal
amplitude is much higher than that of the background noise can pose a challenge as well.
Finally, measuring at a sufficient number of points to be able to apply accurately the
REFERENCES
1.
ISO 10534-2:1998, Determination of sound absorption coefficient and impedance in
impedance tubes, Part 2: Transfer-function method International Organization for
Standardization, Geneva, Switzerland, (1998).
2.
J.-M. Coulon, F. Chevillotte, F.-X. B´ecot, L. Jaouen, “Broadband acoustical
characterisation in a horn shaped impedance tube,” CD-ROM Proc. Acoustics 2012,
Nantes, France, 1903-1907 (2012).
3.
M. Akoum, J.-M. Ville, “Measurement of the reflection matrix of a discontinuity in a
duct,” J. Acoust. Soc. Amer.
103
(5), 2463-2468 (1998).
4.
T. Schultz, L. N. Cattafesta III, M. Sheplak, “Modal decomposition method for
acoustic impedance testing in square ducts,” J. Acoust. Soc. Amer.
120
(6),
3750-3757 (2006).
5.
M. Tamura, “Spatial Fourier transform method of measuring reflection coefficients at
oblique incidence. I:Theory and numerical examples,” J. Acoust. Soc. Amer.
88
(5),
2259-2264 (1990).
measuring reflection coefficients at oblique incidence. II. Experimental results,” J.
Acoust. Soc. Amer.
97
(4), 2255-2262 (1995).
7.
Y. Champoux, J.-F. Allard, “Dynamic tortuosity and bulk modulus in air-saturated
porous media,” J. Appl. Phys.
70
(4), 1975-1978 (1991).
8.
J.-F. Allard, N. Attala, Propagation of Sound in Porous Media: Modelling Sound
Absorbing Materials (Wiley, Chichester, United Kingdom, 2009), Chap. 3.
9.
M. S. Vinogradov, A. N. Gavrilov, “Cross-correlation of normal modes in a shallow
sea,” Soviet Physics - Acoustics
33
, 241-243 (1987).
APPENDIX A. The total absorption coefficient of an absorbing termination in
a multi-modal waveguide.
Equation (10) can be derived from the basic knowledge of the energy relations in a
waveguide. Eq. (2) suggests that the modal decomposition of the sound field in the
impedance tube combines two groups of waves: those which are incident on the material
specimen (
t
being the time)
p
(mni)(
x, y, z, t
) = cos
mπ
a
x
cos
nπ
a
yA
mne
−ikmnz+iωt
;
(19)
and those which are reflected from it
p
(mnr)(
x, y, z, t
) = cos
mπ
a
x
cos
nπ
a
yA
mnR
mne
ikmnz+iωt
.
(20)
The difference between these two groups is in the sign in the exponential function
e
±ikmnzand in the presence of the reflection coefficient term in (20). The
z
-component of the
intensity vector in a propagating normal wave is a measure of energy which this wave
carries from the source towards the material sample. This instantaneous intensity is the
product of the sound pressure
I
mn= Re
{
p
(mni)v
mn}
. The
z
-component of the acoustic
velocity vector of the mode (
mn
) is given by
v
mn=
1
iωρ
∂p
(mni)∂z
=
k
mnp
(mni)ωρ
,
(21)
and this suggests that
I
mn(
x, y, x, t
) =
k
mnA
2mnωρ
cos
2
(
ξ
with
ξ
m=
mπ/a
. The time-averaged intensity is
˜
I
mn(
x, y
) =
Re(
k
mn)
A
2mn2
ωρ
cos
2
(
ξ
m
x
) cos
2(
ξ
ny
)
(23)
The mode (
mn
) incident on the material surface carries the energy flux through the
cross-section of the impedance tube (
S
=
a
2) which is the integral of (23), i.e.
E
mn=
Z
S
˜
I
mn(
x, y
)
dS
=
Z
a0
Z
a0
˜
I
mn(
x, y
)
dxdy,
(24)
where
a
is the dimension of the side of the square cross-section of the impedance tube
S
. It
is easy to show that the integration of (24) with respect to
x
and
y
gives the following
expression for the total energy flux in the normal mode (
mn
) incident on the material
specimen
E
mn(i)=
Re(
k
mn)
A
2
mn
2
ε
mε
nωρ
,
(25)
where
ε
m(m=0)= 1 and
ε
m(m>0)= 2 are the same as defined in equation (10). The
wavenumber
k
mnhere is considered to be real because evanescent modes do not carry the
energy.
The above arithmetical manipulations can be used to derive the total energy flux in
the mode (
mn
) reflected from the material specimen and it is easy to show that
E
(r)mn
=
Re(
k
mn)
k
A
mnR
mnk
22
ε
mε
nωρ
,
(26)
where the norm
k
A
mnR
mnk
is applied because the quantity
A
mnR
mnwhich contains the
The total energy flux is the sum of the energies in all of the propagating modes,
therefore
E
(i)=
X
mn
Re(
k
mn)
A
2mn2
ε
mε
nωρ
,
(27)
and
E
(r)=
X
m′n′
Re(
k
m′n′)
k
A
m′n′R
m′n′k
22
ε
m′ε
n′ωρ
.
(28)
By its definition, the absorption coefficient is the ratio of the energy absorbed by the
surface (
E
(i)−
E
(r)) to the incident sound energy (
E
(i)), i.e.
α
= (
E
(i)−
E
(r))
/E
(i).
Making use of this definition and equations (27) and (28) yields
α
(
ω
) = 1
−
P
m′n′
Re(
k
m′n′)
k
A
m′n′R
m′n′k
2ε
m′ε
n′P
mn
Re(
k
mn)
A
2mnε
mε
n,
(29)
APPENDIX B. Sensitivity analysis.
In order to estimate what influence measurement errors may have on the measured
modal reflection coefficients, a sensitivity analysis was carried out. The
Johnson-Champoux-Allard equivalent fluid model
7was used to predict the modal reflection
coefficients which were then substituted in the equation for the frequency spectrum of the
sound pressure (see Eq. (2)) in which measurement errors,
e
(
ω
), were artificially added, i.e.
p
e(
z, ω
) =
p
(
z, ω
) +
e
(
ω
). The simulated sound pressure with errors,
p
e(
z, ω
), was then used
to calculate the spatial Fourier transform, ˜
p
e(
K, ω
), in accordance to Eq. (1). The
simulated spatial spectra, ˜
p
e(
K, ω
), were then used in the optimization analysis (see Eq.
(5)) instead of the measured sound pressure, ˜
p
m(
K, ω
), to study how the artificially added
errors affect the ability of the proposed measurement method to measure the modal
reflection coefficients,
R
mn.
Three types of error were considered in this analysis: (i) a random error in the sound
pressure phase spectrum within
±
20%; (ii) a random
±
10 mm positioning error applied
separately to the sound pressure at each of the 52 microphone positions; and (iii) a
constant 10 mm bias in positioning applied to the whole microphone array. The mean
difference between the modal reflection coefficient computed exactly for the 52 microphone
positions as assumed in Section II.B and the simulated one containing the added error was
reflection coefficient according to the following expressions:
ǫ
Re=
1
N
N
X
n=1
|
Re(
R
predmn
(
ω
n))
−
Re(
R
mnsim(
ω
n))
|
,
ǫ
Im=
1
N
N
X
n=1
|
Im(
R
predmn
(
ω
n))
−
Im(
R
simmn(
ω
n))
|
,
(30)
where
R
predmn