Rochester Institute of Technology
RIT Scholar Works
Theses Thesis/Dissertation Collections
5-1-2007
Development of test targets for microprinting
applications on the Kodak Nexpress 2100, the
Hewlett packard Indigo 5000 and the Heidelberg
Speedmaster 74
Kevin Landolt
Follow this and additional works at:http://scholarworks.rit.edu/theses
This Thesis is brought to you for free and open access by the Thesis/Dissertation Collections at RIT Scholar Works. It has been accepted for inclusion in Theses by an authorized administrator of RIT Scholar Works. For more information, please contactritscholarworks@rit.edu.
Recommended Citation
Development of Test Targets for Microprinting Applications on the Kodak NexPress 2100, the Hewlett Packard Indigo 5000 and the Heidelberg Speedmaster 74
by Kevin M. Landolt
A thesis submitted in partial fulfillment of the requirements for the degree of Master of Science
in the School of Print Media
in the College of Imaging Arts and Sciences of the Rochester Institute of Technology
May 2007
Primary Thesis Advisor: Dr. Scott Williams Secondary Thesis Advisor: Professor Michael Riordan
Permission to Reproduce Thesis
Title of Thesis: Development of Test Targets for Microprinting Applications on the Kodak NexPress 2100, the Hewlett Packard Indigo 5000 and the Heidelberg Speedmaster 74
I, Kevin Landolt, hereby grant permission to the Wallace Memorial Library of R.I.T. to reproduce my thesis in whole or in part. Any reproduction will not be for commercial use or profit.
Acknowledgements
I would like to thank everyone involved in my academic journey for his or her support, time, and constant encouragement because without it I would not be at this point.
A special thank you to the members of my committee; Dr. Scott Williams, Professor Michael Riordan, and Professor Franz Sigg. Without your expertise, patience, and willingness to spend long hours on this project, I would not have been able to see it to completion.
Thank you to my family and friends for encouraging me to finish my degree and stick with it. Without your love and support I would not be the person I am today.
Finally, to Katie Cole, I don’t know how I would have survived this thing they call the thesis process without your continuing love and guidance. It is truly a blessing to have you in my life.
Table of Contents
Acknowledgements ... ii
List of Figures ...v
List of Tables... vii
Abstract... viii
Chapter 1 - Introduction and Statement of the Problem ...1
Introduction ...1
Reasons for Interest ...2
Glossary of Terms ...2
Bit Depth ...2
Bitmap Images...3
Capital Height...3
Micron...3
Monospaced font ...3
Pixel ...3
Postscript ...4
Raster Image Processor (RIP) ...4
Spot ...4
Vector Graphics...4
Chapter 2 - Theoretical Basis for Study ...6
Resolution ...6
Addressability...6
Contrast ...7
Compression...8
Image Resampling ...8
Chapter 3 - Review of the Literature...9
Introduction ...9
Microprinting...9
Current Uses and Applications of Microprinting ...11
Limitations of Microprinting...12
Digital Printing Processes and Characteristics...12
Electrophotography...13
Device Characteristics ...15
Kodak NexPress 2100...15
Hewlett Packard Indigo 5000 ...15
Heidelberg Speedmaster 74...16
Chapter 4 - Research Questions ...17
Chapter 5 - Methodology...18
Development of the Targets ...18
Fonts Utilized ...19
PostScript ...19
Calculating the Point Size for the Fonts per the Addressability of the Devices ...22
Example of P ratio calculation ...24
Calculating the Required Point Size ...24
Workflow ...25
Printing of the Targets ...31
Analysis...31
Chapter 6 - Results ...36
Workflow Effects on Character Recognition...36
Character Recognition for the Four Different Spot Heights ...40
Character Recognition of the Fonts Relative to the Device’s Addressability...42
Differences Between Raster Imaging Processors (RIP) ...46
Specific Examples of Success ...48
Lucida Console ...48
Compression and Downsampling ...49
Chapter 7 - Summary and Conclusions ...50
Overall Objectives ...50
Workflow Effects on Character Recognition...50
Character Recognition for the Four Different Spot Heights ...51
Character Recognition of the Fonts Relative to the Device’s Addressability...52
Differences between Raster Image Processors (RIP) ...52
Implications for the Printing Industry...53
Agenda for Further Research ...53
List of Figures
Figure 1. Example of how contrast and resolution are dependent ...7
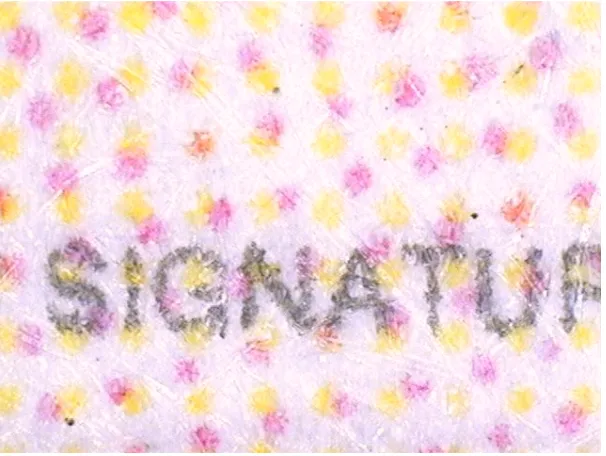
Figure 2. Microprinting found on the signature line of a check. Image taken at 120 x magnifaction using Olympus BX60 Microscope with Hitachi KP-D50 Color Digital Camera ...10
Figure 3. Microprinting found around the logo of a Visa credit card. Image taken at 120x magnification using the Olympus BX60 Microscope with Hitachi KP-D50 Color Digital Camera ...11
Figure 4. Example of the electrophotographic process (Kipphan, 2001)...14
Figure 5. Illustration of how a capital letter E is defined in spots...19
Figure 6. PostScript coding of character A for the Hand-coded Vector font ...21
Figure 7. Illustration of character A for five spots high designed in Microsoft Excel ...22
Figure 8. Capital height obtained in Adobe Illustrator CS 2 usint the create outline feature ...23
Figure 9. Prompt screen to specify resolution of the file to be placed in Adobe InDesign CS 2 ...26
Figure 10. Resolution settings for the Heidelberg Speedmaster 74 defined in Acrobat distiller ...28
Figure 11. Compression and downsampling rates established for 2400 NC_NS ...29
Figure 12. Workflow used for each file that was place into Adobe InDesign CS 2 ...30
Figure 13. Analysis performed using the Panasonic 30x Light Scope ...32
Figure 14. Succesful character rendering from the Heidelberg Speedmaster 74 for the source EPS Lucida Console file at 120 x magnification ...33
Figure 15. Succesful character rendering from the HP Indigo 5000 for the source EPS Hand-coded Bitmap file at 120 x magnification ...33
Figure 16. Unrecognizable characters taken from the target for the NexPress 2100 from the EPS 1-bit PDF NC_NS at 120 x magnification ...34
Figure 17. Unrecognizable characters taken from the target for the Heidelberg Speedmaster 74 from the EPS 8-bit PDF WC_WS at 120 x magnification ...34
Figure 18. Microsoft Excel data from the analysis ...37
Figure 19. Percentage of character recognition for each of the fifteen workflows using all four spot heights ...38
Figure 20. Workflow effects on character recognition using spot heigh averages that have a recognition greater than 70 percent. EPS 1 and 8-bit workflows were not included because the average character recognition was below 70 percent ...39
Figure 21. Effect of the different spot heights on character recognition ...41
Figure 22. Percentage recognized using the successful workflows with an average greather than 70 percent ...42
Figure 23. Font recognition for the Heidelberg Speedmaster 74 ...43
List of Tables
Abstract
Microprinting is utilized in many types of documents for authentication and anti-counterfeiting purposes. Elements of microprinting are usually text and not readable to the human eye without the aid of magnification. A series of test targets were developed to evaluate the capability of the Kodak NexPress 2100, the HP Indigo 5000 and the
Heidelberg Speedmaster 74 printing systems to render micro text.
The primary criterion that determines the ability of a printing device to render micro elements are: addressability, spot size, font selection, workflow (e.g. file processing), and resolution. All three devices were capable of reproducing micro text. While the 600 spots per inch device was capable of reproducing acceptable results under specific conditions, the devices with higher addressability performed proportionally better under the same conditions. San-serif fonts found in Adobe Illustrator can be used for microprinting and the programming of custom Postscript fonts is not necessary. Among the four fonts tested in this study, Lucida Console was the best suited for
Chapter 1
Introduction and Statement of the Problem
Introduction
The United States loses $200-$250 billion dollars a year as result of counterfeiting and piracy (United States Chamber of Commerce, 2006). Although counterfeiting is not a new problem, the use of desktop publishing and other home technologies are making it easier for people to perform these acts of forgery. Security printing is an area of the printing industry that specializes in combating and deterring counterfeiting methods. To combat counterfeiting, the industry utilizes many different printing processes and
technologies. Microprinting is one of the security techniques that are most often found on currency, credit cards and financial documents, such as checks. It is a security technique that utilizes microscopic letters that are too small for humans to see without the aid of magnification. Microprinting is most often performed with the intaglio and offset printing process, but Xerox Corporation has developed a micro font that can be used on digital technologies (Tyler, 2006).
Reasons for Interest
The researcher became interested in this field of study to help further understand the limitations and potential that printing systems present to render micro elements for the printing industry. Upon investigation into the use of microprinting as a security feature, it was discovered that not much research had been performed on its use for digital print technologies. The researcher wanted to be involved in developing a practical
methodology on how to utilize microprinting for different print technologies. After graduation, it is the researchers interest to become involved with testing, research and development for the printing industry.
Glossary of Terms
The following terms are ones that are commonly used within the Graphic Arts Industry, but there understanding is not widely known. Therefore, the terms used within the context of this study will be defined in this section:
Bit Depth
Bitmap Images
Bitmap images are created with a specific arrangement of pixels, where the pixels contain the information for position and tone value for each color channel. All photographic images are bitmap also known as raster images. Bitmap images are resolution dependent.
Capital Height
The distance from the baseline to the top a capital letter, for instance the letter E.
Micron
Translated from the Greek word mikros, meaning small. Micron is a unit of measurement that is one millionth of a meter. It is noted with the symbol .
Monospaced font
A typeface where all characters occupy a design space of exactly the same width. Also referred to as fixed-pitch fonts.
Pixel
Postscript
Postscript is as a page description computer language developed by Adobe Systems
Incorporated. The language defines how an output device should print the page.
Raster Image Processor (RIP)
The Raster Image Processor is a computer program that understands the digital
information of an image and calculates the image in bitmaps. The RIP takes the pixel
information as input and then calculates how to turn on the addressability in spots.
Spot
A spot is data and the smallest element in an addressability grid for an output device.
Spots possess the location in the addressability grid and is what the screener intended to
form. A mark is the actual placement of the ink indicted by the spot location and
performed by the marking engine.
Vector Graphics
Vector graphics and images are composed of mathematically defined shapes and are
resolution-independent. Graphics and images that are vector can be scaled, rotated, and
Chapter 2
Theoretical Basis for Study
The following sections outline the background needed to understand the process of resolving micro elements and the workflow used to develop the targets used for analysis.
Resolution
Resolution is an important requirement of image quality. Although resolution is used for many aspects of image quality, the term is often misrepresented. Resolution of an output
device can be defined as its’ ability to reproduce fine detail with high visible contrast. Resolution is affected by several factors; image sampling (pixels per inch), screening
(lines per inch), and addressability of the output device (spots per inch). In general, fine detail is easier to see and reproduce at higher contrast than at lower contrast (F. Sigg, personal communication March 23, 2007).
Addressability
Addressability and resolution are two terms that are often mistaken for one another. Where as resolution is dependent on contrast, addressability is not. Addressability is
defined as the number of spots per unit length for a given printing device. Addressability can differ in the horizontal and vertical direction. Resolution can be as high as
addressability when at maximum contrast, but will be less than at lower contrast
Professor Franz Sigg (2006), a better way to define it would be in spots per inch, because dpi implies dots which, for printing, has always meant halftone dots and not
addressability marks.
Contrast
[image:17.612.127.523.491.630.2]Contrast is the visual difference of tonal separation in the range from black to white. Resolution is a function of contrast because if there is no visual difference between foreground and background, then no perceivably difference can be seen. Figure 1 illustrates visually how resolution is a function of contrast. The photo on the left was photographed during a sunny day and all the branches and the small twigs on that tree are visible. The contrast in the photo on the right was lowered to simulate how a dense fog would look during that same day and the branches would still be visible but the small twigs would no longer be seen (F. Sigg, personal communication March 23, 2007).
Compression
Compression is the use of algorithms to reduce file size in a digital image. Image compression algorithms accomplish the reduction in file size by reducing redundancy found in image data (Kou, 1995). There are two types of compression algorithms utilized, lossy and lossless. Lossy compression reduces file size by removing data from the image and when compared to the source file they will look similar but not exact. Lossless compression reduces the file size with an algorithm that intends not to lose any of the original source data, and when uncompressed the source data is intact. Both compression types are utilized to preserve the essential information found within the source image while reducing the file size (Kou, 1995).
Image Resampling
Image resampling is the use of software to increase or decrease the size and resolution of pixels in a digital image. Downsampling is used to decrease the number of pixels. For example, in Acrobat Distiller the default settings for Color Image sampling are Bicubic Downsampling to 150 pixels per inch if images are found to be above 225 pixels per inch. Upsampling is used to increase the number of pixels to images based on surrounding pixel data.
Chapter 3
Review of the Literature
Introduction
Security printing is the process of using limited-access materials and technology to produce secure end products and documents to deter counterfeiting, forgery and other fraudulent activities. The security printer utilizes many different printing processes and specialized technologies to develop documents that strive to preserve the integrity of the document as well as protect it (Adams II, 2005).
The need for security printing is evident in the amount lost to counterfeiting each year. According to the United States Chamber of Commerce (2006), $200-$250 billion dollars is lost each year in the U.S. to counterfeiting. Although counterfeiting is not a new problem, the use of desktop publishing and other home technologies are making it easier for people to perform these acts of forgery. The relatively low cost of scanners, cameras, desktop printers and computers allows people to abuse the technology for fraudulent purposes (Adams II, 2005).
Microprinting
that microprinting is utilized as a security product due to the difficulty involved in producing the type accurately on reproduction technologies such as photocopying. When a counterfeiter attempts to reproduce a document on a photocopier, the micro text renders as a continuous line (Adams II, 2005). Figures 2 and Figure 3 illustrates microprint found on the signature line of a check and around the logo of a Visa credit card.
Figure 3. Microprinting found around the logo of a Visa credit card. Image taken at 120x magnification using the Olympus BX60 Microscope with Hitachi KP-D50 Color Digital Camera.
Current Uses and Applications of Microprinting
During the investigation of microprinting techniques, it was found that most
microprinting is performed through traditional printing methods such as intaglio printing
and offset lithography. Currently, microprinting can be found on many types of
documents such as: checks, credit cards and currency. The Xerox Corporation announced
in October 2006 that it had developed a micro font that is 1/100th of an inch tall and can be used on their line of digital printers. The capability of using the micro font on digital
technologies allows for variable data printing which can make the font customizable to
the recipient. Using digital printing to produce documents that possess microprinting can
help deter counterfeiting because if the information is specific to an individual, it will
University of California at Los Angeles developed another example of microprinting that
is currently being utilized. They created a technique to design shapes, objects and billions
of fluorescent letters that measure microns across that could be used to help tag cells
inside humans. The letters are smaller than the cells and glow to help for cell
identification. The study was performed in the field of thermal microrheology (Kanellos,
2007).
Limitations of Microprinting
Although microprinting is a valuable tool utilized in security printing, there are some
limitations. Microprinting can be used on currency as one of the ways to verify its
authenticity, but if someone is not specifically looking for the micro text, then the feature
does not work (Tyler, 2006). Another limitation of microprinting is that if it is the only
security feature present on a document, then the document might still be at risk. Richard
M. Adams II and Richard D. Warner (2005), authors of Introduction to Security Printing,
suggest a minimum of at least three security devices per document because no single
security printing technology is completely sufficient in deterring counterfeiting attempts.
Digital Printing Processes and Characteristics
There are several types of digital printing technologies currently in use in today’s market
such as: inkjet, magnetography, thermal transfer, thermal transfer dye sublimation and
Electrophotography
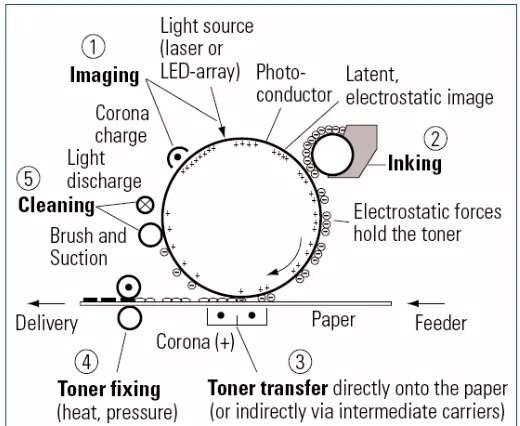
Electrophotography, also known as xerography, is a printing process that relies on the
electrostatic transfer of toner to a charged photoconductor surface. The
electrophotographic process can be explained in five steps: imaging, inking, toner
transfer, fixing the toner and cleaning (Kipphan, 2001).
The imaging process takes place through the use of a controlled light source. Two
common light sources that are used today are lasers and light emitting diodes. The
substrate, either coated or uncoated, is electrically charged and the light source is emitted
from the photoconductor drum in correspondence to the image that will be printed on to
the substrate.
The ink used in electrophotography is called toner and can be produced in the
form of dry toner or liquid toner. The toner is transferred to the photoconductor drum
without contact and is placed on the drum through an electrical charge. The inking stage
is when the latent image becomes visible on the photoconductor drum.
The transferring of toner to the substrate is performed by either placing it directly
on the substrate or through the use of an intermediate system such as a drum or belt. The
transfer of the toner from the photoconductor drum to the substrate occurs through the
electrostatic forces created by a corona wire found in the nip of the press. The contact
pressure between the drum and the surface of the paper causes the toner particles to
Once the toner particles are on the substrate they are not adhered until the toner fixing stage. The fixing unit on an electrophotographic printer is designed so that the toner adheres to the substrate through heat application and contact pressure.
[image:24.612.213.473.425.638.2]After the substrate is imaged and the toner is fixed, the photoconductor drum is cleaned and re-imaged so that it can create a new latent image on the drum for subsequent printing. The cleaning takes place through the use of both mechanical and electrical means. The mechanical stage of the cleaning process is accomplished through brushes, suction, or both and removes the particles off of the drum. The electrical cleaning is performed through electrically neutralizing the drum, making it free from particles so the process can begin again (Kipphan, 2001). An example of the electrophotographic process can be found in Figure 4.
Device Characteristics
Printing of the test targets took place on the Kodak NexPress 2100, the Hewlett Packard
Indigo 5000 and the Heidelberg Speedmaster 74. The three printing devices have
different characteristics that will be discussed in the following sections.
Kodak NexPress 2100
The Kodak NexPress 2100 is a dry toner sheet fed digital color press. The NexPress is a
digital technology that has an addressability of 600 spots per inch and a maximum sheet
size of 13.8 inches x 18.5 inches. The toner used within the press is DryInk Technology
and uses the four process colors of black, yellow, magenta and cyan. The NexPress
utilizes a blanket cylinder process that is similar to that of analog offset lithography. The
image is transferred from the imaging drum onto the blanket cylinder and then transferred
to the substrate. The blanket cylinder used for transferring the image to the substrate
allows a wide range of papers with varying stocks and weights to be used (NexPress,
2006).
Hewlett Packard Indigo 5000
The Hewlett Packard Indigo 5000 is a digital color press that utilizes liquid toner called
Liquid HP Electroink. The addressability of the machine is reported at 812 spots per inch
and has a maximum sheet size of 12 inches by 18 inches. The Indigo 5000 has optional
allow the user to augment the four process colors with HP IndiChrome special colors
(Hewlett Packard, 2006).
Heidelberg Speedmaster 74
The Heidelberg Speedmaster 74 is a six-color sheetfed offset lithographic press with a
perfecting device and coating system. The largest sheet size on the press is 20.87 inches
by 29.13 inches with a maximum printable area of 20.08 by 29.13 inches (Heidelberg,
Chapter 4
Research Questions
A series of test targets are developed to evaluate the capability of the Kodak NexPress 2100, the HP Indigo 5000 and the Heidelberg Speedmaster 74 printing systems to render micro text. The following questions are investigated:
1. How does the addressability of the printing devices effect its ability to render micro elements?
2. What effect does workflow/file processing have on the device’s ability to render micro elements?
3. What spot heights are best utilized for rendering micro elements?
Chapter 5
Methodology
A series of test targets were developed to assess the capabilities of three different
print technologies to resolve micro elements. The three printers that were tested were the
Kodak NexPress 2100, the Hewlett Packard Indigo 5000 and the Heidelberg Speedmaster
74.
Development of the Targets
The targets were designed using four different fonts; Lucida Console, OCR A Std
Medium, and Postscript fonts that were designed as vector and bitmap, Hand-coded
Vector and Hand-coded Bitmap. The two PostScript fonts were designed to be intelligent
and automatically adjust themselves to the addressability of the device. All four fonts
were designed with four different spot heights and placed through 15 different
workflows. Spot height sizes for the character set were used because the smallest element
that a printing device can produce is one spot. For micro text to reproduce well, it is
necessary that the lines of each character align exactly with the spots of the output device.
This is because anti-aliasing at the micro level is not possible. The smallest capital letter
E has to be five spots high: three black spots for the lines and two white spots for the
spaces. Figure 5 is an illustration of the concept of how a capital letter is made in terms
Figure 5. Illustration of how a capital letter E is defined in spots.
The different workflows utilized are ones that can be found in a prototypical publishing workflow and were used to determine how the fonts would render under different conditions on each of the three devices.
Fonts Utilized
Lucida Console and OCR A Std Medium where chosen for their accessibility in Adobe Illustrator CS 2 and because they were designed as sans serif fonts. The design of the PostScript fonts was performed using Text Wrangler version v2.1.2. All characters were designed using capital letters.
PostScript
device’s addressability grid and allowed control over the line widths. The fonts were
designed with character width in mind so that overlapping at the micro-level did not take
place. It was also programmed to resemble a sans-serif font set using all capital letters.
The target was designed to be “intelligent,” meaning that it is designed to automatically
determine the addressability of the output device and adjust the spot size of both the
Hand-coded Vector and Hand-coded Bitmap characters accordingly. The intelligence of
the target was also designed to be self-documenting. In the coding of the PostScript, the
target reported on the printed page several things: the name of the RIP, the addressability
and spot size in microns and for each character set printed, it recorded the name and size
of the font used. Two designs of the PostScript font were utilized to determine if vector
elements or bitmap elements would render successfully. The programming of the
PostScript code was performed working closely with Professor Franz Sigg whom has an
expertise in programming that the researcher did not possess.
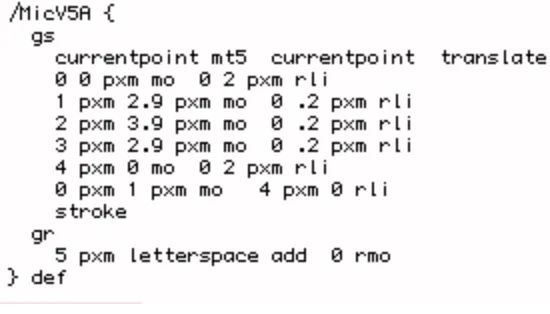
Hand-coded Vector. The PostScript coding of the font Hand-coded Vector took
place entirely in the Text Wrangler application. There were four spot sizes created within
the code: five, seven, nine, and ten spots high. The characters and numbers were created
using PostScript paths and made to resemble these characters as closely as possible.
Figure 6. PostScript coding of character A for the Hand-coded Vector font.
Hand-coded Bitmap. The PostScript coding of Hand-coded Bitmap was modeled
after a spreadsheet designed in Microsoft Excel. Small Bitmap images in PostScript can
be represented by a hexadecimal character string in which each character spots are
represented by eight-bits and each spot is defined as black or white. The PostScript
interpreter reads the hexadecimal characters in sequence using the image operator, to
build up the bits of a character. In order to facilitate determination of the necessary
hexadecimal characters for the micro fonts, an Excel spreadsheet was developed using
conditional formatting to automate the generation of the PostScript code. Figure 7 is an
illustration of how Excel was used for designing the character A for the spot height of
Figure 7. Illustration of character A for five spots high designed in Microsoft Excel.
Lucida Console. A monospaced sans-serif font utilized for forms, tables, memos
and titles. The font has thin stems and was used for this study because of its accessibility.
OCR A Std. Medium. A monospaced sans-serif font that was designed as one of
the first machine readable typefaces for optical character recognition. The font was used
for this study because of its accessibility.
Calculating the Point Size for the Fonts per the Addressability of the Devices
The capital height of a font has to be a full number of spots high in order to avoid
rounding problems by the device. Therefore, a method of calculating the point size had to
be devised to for a given number spots needed for a given addressability. There are four
variables needed to calculate the point size in. The four variables are as follows:
1. The addressability of the device in terms of spots per inch (spi)
2. The standard number of points within one inch. This is equal to 72 points/ spots
per inch. (sp)
3. The ratio between the nominal point size of a font and its capital height is needed.
4. The desired number of spots per capital height of the letter E. For this calculation
it was named E sp.
The following is the formula for calculating the required point size to obtain the desired
number of spots.
Required Point size = E sp • sp Spi • P ratio
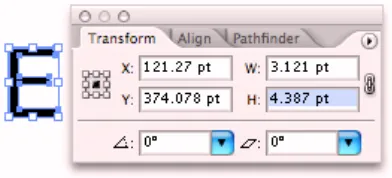
Finding the Capital Height for the P ratio in Adobe Illustrator
To obtain the capital height in Adobe Illustrator, the Create Outline tool was used. This
feature allows the character height to be accurately measured. The capital height
[image:33.612.224.420.419.508.2]measurement can be found in the Transform toolbox as shown in Figure 8.
Example of P ratio calculation
The following is an example of how the P ratio was calculated for Lucida Console at a
nominal point size of seven.
P ratio = Capital height in points (4.387) = .6267
Nominal point size (7)
Calculating the Required Point Size
After the proportional ratios (P ratio) were found, calculating the required font sizes in
terms of points could be performed for all three print devices different addressabilities.
Table 1 illustrates the known addressability of the devices and their size of a single spot.
Table 1 Known addressability and spot sizes for the three devices
Device Addressability Spot Size
Heidelberg Speedmaster 74 2400 spi 10.6
HP Indigo 5000 812 spi 31.3
Kodak Nexpress 2100 600 spi 42.3
An example of how the required point size was calculated for the target designed for the
NexPress 2100 using Lucida Console at a nominal point size of seven is as follows:
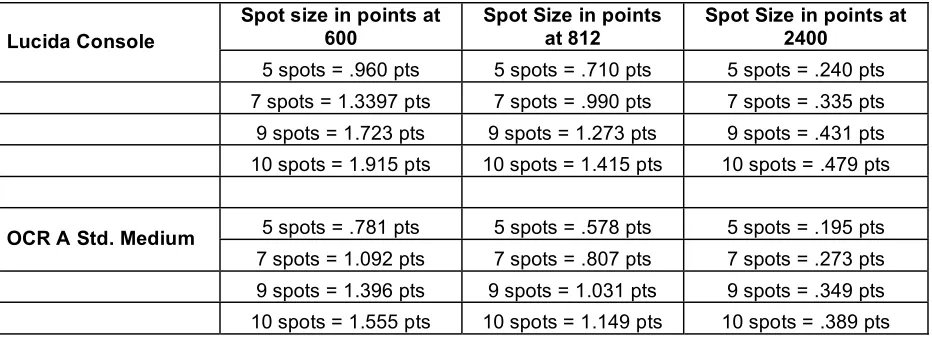
Table 2 is illustrates all the calculations performed for Lucida Console and OCR A Std.
[image:35.612.109.575.197.367.2]Medium for all three addressabilities.
Table 2 Spot size defined in points for the two fonts at the device’s addressability.
Spot size in points at 600
Spot Size in points at 812
Spot Size in points at 2400
Lucida Console
5 spots = .960 pts 5 spots = .710 pts 5 spots = .240 pts 7 spots = 1.3397 pts 7 spots = .990 pts 7 spots = .335 pts 9 spots = 1.723 pts 9 spots = 1.273 pts 9 spots = .431 pts 10 spots = 1.915 pts 10 spots = 1.415 pts 10 spots = .479 pts
5 spots = .781 pts 5 spots = .578 pts 5 spots = .195 pts OCR A Std. Medium
7 spots = 1.092 pts 7 spots = .807 pts 7 spots = .273 pts 9 spots = 1.396 pts 9 spots = 1.031 pts 9 spots = .349 pts 10 spots = 1.555 pts 10 spots = 1.149 pts 10 spots = .389 pts
Workflow
Within the context of this study, workflow is defined as a series of steps that were
followed to put the targets through some prototypical publishing renderings of
compression, downsampling and bitdepth settings. Several tests were conducted before
the final settings of workflow were decided on for this study. Compression, bit-depth, and
sampling have a significant impact on how micro print elements would render on the
three printing devices. There were three separate layout designs made in Adobe Indesign
CS 2 for the three printing devices used. This was done because each printing device has
a different addressability and the fonts were designed specifically for them. The
Encapsulated PostScript (EPS). The EPS files were the original source files for
both PostScript fonts and for Lucida Console and OCR. For the Lucida Console and OCR
fonts both were designed at the four calculated point sizes and then saved separately as
Adobe Illustrator EPS files. These were then placed in Adobe InDesign CS 2 into their
respective target layout for the specified printing device. The Postscript fonts were saved
in TextWrangler as EPS files and placed into the respective target layout for the devices.
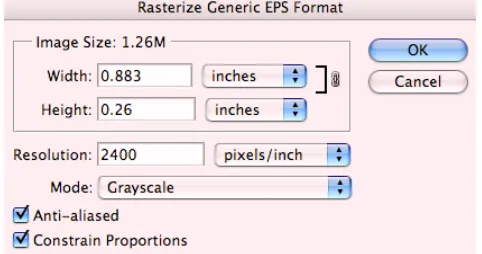
Adobe Photoshop 1-bit EPS. The original EPS files designed in Illustrator and
PostScript were opened in Photoshop and the file was then changed into a 1-bit bitmap.
When the files were opened in Photoshop, the program gave a prompt screen and the
resolution of the file was designated for which page layout the file was to be placed in.
Figure 9 illustrates this prompt screen for the Lucida Console EPS designed for the
[image:36.612.222.463.477.604.2]Heidelberg Speedmaster 74 with an addressability of 2400 spi.
After specifying the resolution of the device that the file was to be placed in, the file was
flattened and the mode was changed to bitmap, via the file menus of Image > Mode >
Bitmap. The file was then saved as a Photoshop EPS with a naming convention designed
by the researcher and placed into its appropriate page layout for the device. This
workflow was done to see how bitmap settings of 1-bit would affect how the fonts
rendered on the three devices.
Adobe Photoshop 8-bit EPS. Similar to how the workflow for the 1-bit EPS was
performed, again the original source EPS files were opened in Adobe Photoshop and the
resolution was set to the specified device it was designed for at the prompt screen. After
the resolution was specified in the prompt screen, the files were flattened and changed to
8-bit grayscale via the file menus of Image > Mode > Grayscale. The files were then
saved as Photoshop EPS with a naming convention designed by the researcher and placed
into its appropriate page layout for the device. This workflow was performed to see how
grayscale settings of 8-bit would affect how the fonts rendered on the three devices.
Compression and Downsampling. Acrobat Distiller 7.0 was utilized to evaluate
how the different files would be affected by compression and down sampling settings.
Each EPS file from Illustrator, Photoshop and Textwrangler were placed in Distiller 7.0
with a variety of settings. The resolution for each device was specified in Distiller for the
for the Heidelberg Speedmaster 74 would, go through the Distiller settings at resolution of 2400 spi. Figure 10 illustrates how the settings were established for 2400 spi.
Figure 10. Resolution settings for the Heidelberg Speedmaster 74 defined in Acrobat Distiller.
The following are the settings used for this study.
o NC_NS: No compression and no downsampling o NC_WS: No compression and with downsampling o WC_NS: With compression and no downsampling o WC_WS: With compression and with downsampling.
After the files were placed through these four different workflows a PDF file was made and placed into each respective page layout. Figure 11 demonstrates how the
Figure 11. Compression and sampling rates established for 2400 NC_NS.
The workflows used for this study were established to place the fonts through different
scenarios that affect how a font would render at the micro level. Figure 12 illustrates the
Printing of the Targets
Printing of the targets took place on the Kodak NexPress 2100, the Hewlett Packard 3050
and the Heidelberg Speedmaster 74 at the Printing Applications Lab(PAL), located at the
Rochester Institute of Technology in building 78. The targets were printed using two
substrates, 80# Sterling Ultra Digital Gloss for the NexPress and the HP Indigo and an
80# dull-coated substrate for the Heidelberg Speedmaster 74. Each of the presses were
calibrated to reduce variability and aid repeatability of the experiment. The
default-screening mode for the NexPress and Indigo was used. The RIP’s that were used for each
device was: the NexStation front end v3.25 for the Nexpress, the Harlequin RIP v5.0 for
the Indigo, and Prinergy 3.0.2.2 for the Heidelberg. The targets were PostScript files
submitted to each of the three printer’s RIP and printed at total of 15 times for the digital
devices and 50 times for the Heidelberg. The reason for 50 prints on the Heidelberg was
to get the press to registration and color calibration. The samples that were used for
analysis were selected randomly and dried at the Printing Applications Lab for 24 hours
before evaluation took place. A 24-hour waiting period was used to prevent the prints ink
from rubbing off during analysis. The targets can be found in Appendix A.
Analysis
A 30 x Panasonic Light Scope was used to analyze the prints. The 30 x magnification of
the light scope allowed the researcher to isolate a single character from the rest of the
target for accurate observation. Figure 13 illustrates how the research performed analysis
Figure 13. Analysis performed using the Panasonic 30x Light Scope.
The prints were examined to verify if each character for each target was recognizable to
the researcher. The test was subjective by nature, but the test was performed as
objectively as possible. The light scope helped to isolate the character that was being
observed so that the surrounding letters did not influence the decision of whether it was
recognized or not. This was performed for all three device target layouts.
Figures 14 and Figure 15, taken with the Olympus BX60 Microscope with Hitachi
KP-D50 Color Digital Camera at a magnification of 120 x, illustrate what was decided to be a
Figure 14. Successful character rendering from the Heidelberg Speedmaster 74 for the source EPS Lucida Console at 120 x magnification.
Figures 16 and 17 illustrate what was considered unrecognizable by the researcher.
[image:44.612.181.470.434.654.2]Figure 16. Unrecognizable characters taken from the target for the NexPress 2100 from the EPS 1-bit PDF NC_NS at 120 x magnification.
A criterion was set by the researcher to be used. The criteria specified that if a line of all
characters of the alphabet and numbers had over 13 that were not recognized, then that
line failed. 13 unrecognizable characters was decided as a failure because that was over a
third of all the characters. Over a third not recognized would make it nearly impossible to
use the alphabet or numbers to produce a sentence if the text was used. This procedure
was done for all three-page layouts for the three printing devices. The characters that
were not recognized by the observer were placed in an Excel spreadsheet and a count was
obtained for a total number of not recognized. Subtracting this number from the total
count of 36 characters and dividing that number by 36, an average of how many
characters were recognized for that spot height and font was obtained. Having performed
the analysis for all three devices, other averages were obtained. The analysis was done
using Microsoft Excel to determine several things: how workflow effected character
readability, the average of character recognition for the different spot heights, the average
character recognition of the four different fonts relative to the device’s addressability,
example of the differences between Raster Image Processors (RIP) and the use of
Chapter 6
Results
The following results illustrate; how workflow affected character readability, the average of character recognition for the different spot heights, the average character recognition of the four different fonts relative to the device’s addressability, example of the
differences between Raster Image Processors (RIP) and the use of compression and downsampling. The following is a legend for the abbreviations used in the following graphs.
• NC_NS: No compression and no down sampling • NC_WS: No compression and with down sampling • WC_NC: With compression and with no down sampling • WC_WS: With compression and with down sampling
Workflow Effects on Character Recognition
Conditional formatting was utilized with the Excel file to help differentiate the averages that were successful or not. The green boxes are averages from 90-100 percent. Yellow boxes are averages from 70-90 percent. Pink boxes are 70 percent or less. Figure 19 is a graph that illustrates the averages of all spot heights for all fifteen workflows.
Figure 19. Percentage of character recognition for each of the fifteen workflows using all four spot heights.
and the source PDF WC_NS. EPS 8 bit WC_WS was the worse with an average of zero percent. Although, Figure 19 illustrates how characters were recognized for all
[image:49.612.112.535.345.615.2]workflows and all spot height averages, it does not illustrate those spot heights that had a large percent of recognition. Including the averages of the spot heights that were below 70 percent made the averages relatively low. A criterion was then established that if a spot height average was less than 70 percent, it would not be included in the analysis. Figure 20 illustrates that all workflows for EPS 1 and 8-bit would be excluded from the preceding averages. The averages in Figure 20 illustrate that when the spot heights that were less than 70 percent were not included, the means were significantly higher.
Figure 20. Workflow affects on character recognition using spot height averages that have a character recognition greater than 70 percent. EPS 1 and 8-bit workflows were not included
Figure 20 Illustrates that with the new criteria used, the source EPS workflow is still the
most successful but with an average character recognition of 88 percent as opposed to 76
percent shown in Figure 19. The lowest recognition of the workflows shown is NC_WS
with average character recognition of 84 percent.
Character Recognition for the Four Different Spot Heights
To demonstrate how different spot heights affected the observer’s ability to recognize the
characters within each target, simple statistics were again performed. Utilizing the spot
height averages for each of the workflows identified in the previous analysis, a grand
total was obtained for each of the four different spot heights and averaged. This average
illustrates the overall readability for each of the four spot heights. As shown in Figure 21,
the largest average of character recognition per spot height is 10 spots with an average of
72 percent. Five spots high had the lowest character recognition with an average 20
Figure 21. Affect of the different spot heights on character recognition.
Anything less than 70 percent was not used for the following graph and the workflows of
EPS 1 and 8-bit were not included to illustrate the more successful spot heights that had
larger percent character recognition. Figure 22 demonstrates the average character
recognition of spot heights using only the source EPS and the source Acrobat Distiller
settings. Although 10 spots still has the best recognition at 93%, it is a much larger
Figure 22. Percentage recognized using the successful workflows with an average greater than 70 percent.
Character Recognition of the Fonts Relative to the Device’s Addressability
To illustrate how accurately the four different fonts were rendered by the addressability
of the three printing devices, simple statistics were used to derive a mean. The mean was
derived by using the percentage recognized for each font at all four spot heights, and for
the successful workflows with an average greater than or equal to 70 percent, to portray
overall how the font was rendered for the addressability of the device. The averages
in its recognition. The following graphs illustrate what fonts rendered most accurately for each of the device.
Figure 23. Font recognition for the Heidelberg Speedmaster 74.
Figure 24. Font recognition for the HP Indigo 5000.
Figure 24 shows that for the HP Indigo 5000 with an addressability of 812 spots per inch,
the font that was most consistently recognized was Lucida Console with an average of 91
Figure 25. Font recognition for the NexPress 2100.
Figure 25 shows that for the NexPress 2100 with an addressability of 600 spots per inch,
the font that was most consistently recognized throughout the analysis was Lucida
Console with an average of 84 percent. The lowest average of font recognition for the
NexPress was Hand-coded Vector with a percentage of 65 percent.
Comparing the fonts that recognized most consistently between the three devices,
Differences Between Raster Imaging Processors (RIP)
The analysis used demonstrated that even though the same workflows were used for all
three devices, how the device rendered the same fonts at the same spot heights was
different. One example of this is how the three devices rendered the Hand-coded Bitmap
font using the source EPS file at nine spots high. Figure 26 illustrates the differences of
[image:56.612.110.537.287.572.2]character recognition of the same font between the devices.
Figure 26. Example of RIP differences for the same font on the three printing devices.
Figure 26 shows that the RIP for the Heidelberg Speedmaster has a 100 percent character
recognition for the Hand-coded Bitmap font at 9 spots high. The HP Indigo 5000 has the
differences between the three device RIPS, a specific example of how one RIP treated the
rendering of the characters within the same target is illustrated in Figures 27 and 28.
Figure 27 illustrates how that for the spot height of nine for the target file of the source
EPS Hand-coded Bitmap, the stems of the letter B and M have been dropped and that the
letter I is completely missing. Figure 28 illustrates that in the same target at the spot
[image:57.612.174.476.283.509.2]height of ten the characters are all there.
Figure 28. Illustration of all letters being complete in the source EPS Hand-coded Bitmap at ten spots high at 120 x magnification.
Specific Examples of Success
Lucida Console
The font that was recognized most consistently between devices was Lucida
Console with an average recognition of 88 percent. The workflow best suited to utilize
this font is the source EPS workflow at a spot height of nine or seven. Figure 29
illustrates the recognition rate of Lucida Console at nine and seven spots high for the
Figure 29. Successful character recognition for all three printing devices.
Compression and Downsampling
Compression and downsampling did not affect character the workflow was
performed from the original source EPS file. One specific example of this is for the
workflow of WC_WS at nine spots high. Between all three devices and all four fonts at
nine spots high, the character recognition was 77 percent. This average falls above the set
criteria of using everything above 70 percent and this workflow uses both compression
Chapter 7
Summary and Conclusions
Overall Objectives
The capability of the Kodak NexPress 2100, the Hewlett Packard Indigo 5000, and the
Heidelberg Speedmaster 74 systems to render micro elements were evaluated to see how
they performed. Microprinting on these devices is possible if the correct spot height,
workflow and font are optimized for the addressability of the specified device.
Workflow Effects on Character Recognition
Workflow impacts character recognition of the fonts greatly. The original source
Encapsulated PostScript (EPS) workflow was best utilized for microprinting for this
study. These files went through the workflow of the printing devices RIP only and were
therefore not affected by Acrobat Distiller settings that were required for the rest of the
workflows. However, a PDF workflow can be utilized for micro elements as long as
correct Acrobat Distiller settings and the original source files are used. The fonts should
not be placed in Photoshop and converted to grayscale or bitmap because the degradation
of the text was substantial. Also, placing the converted grayscale file through different
Distiller settings only degrades the text more with EPS 8-Bit WC_WS scoring the lowest
with an average of zero percent recognition. The 15 different workflows illustrate how
different compression and sampling settings degrade the fonts at different rates. As the
for each workflow was correct, however the researcher did not have complete control
over the RIP of the output device or how it applied downsampling and compression. The
settings used for each device were carefully chosen, but access that is available to the
manufacturer of the device, may not be available to the end user.
Character Recognition for the Four Different Spot Heights
The spot heights utilized impacted the observer’s ability to recognize characters. The
smaller the font, the lower the recognition. The lowest recognition of characters was for
the spot height of five for each of the devices with an average character recognition of 39
percent. At a spot height of five, the capability of how the device renders the fonts is
[image:61.612.109.580.487.619.2]pushed to its limit because of how small it must make each spot to render a character.
Table 3 illustrates the spot heights in terms of microns for all three devices.
Table 3 Spot heights in terms of microns() for all three printing devices.
Heidelberg Speedmaster 74 2400 Spi
(Single Spot=10.6)
HP Indigo 5000 812 spi
(Single Spot=31.5)
Nexpress 2100 600 spi
(Single Spot=42.3)
Spot Height Microns
5 53 157.5 211.5
7 74 220.5 296.1
9 95.4 283.5 380.7
10 106 315 423
As the spot height increases the character recognition increases with the largest percent
overall 10 spots had the largest recognition, using Lucida Console at a spot height of nine
for all three devices yielded a recognition rate of 100 percent.
Character Recognition of the Fonts Relative to the Device’s Addressability
Based on the results of this study, designing a font using PostScript for microprinting
applications is not needed. The Lucida Console had the highest character recognition for
all three devices for the source EPS workflow and the source Distiller workflows.
Apparently, the logic that is built into the fonts to make the display well, works even at
the micro level. Utilizing known fonts within a design or page layout application for
micro printing applications is possible if testing is performed for the specified device
using the methodology of this study. This is helpful, because designing a font using
PostScript is both time consuming and tedious.
Differences between Raster Image Processors (RIP)
The three device’s RIPs impacted how the fonts rendered on the three printing devices.
Even though the same font was used at the same designed spot level, the RIP influenced
how the characters were recognized. The default settings were used for all three devices
and sampling and compression turned off, it was apparent that the RIP for each devices
Implications for the Printing Industry
The ability to render micro print elements utilizing a sans-serif font found in a design
page application program such as Adobe Illustrator, calls the utilization of microprinting
as a security feature into question. As shown in this study, microprinting found on the
signature line of a check printed by offset lithography is 241 high. The Lucida Console
font printed on the HP Indigo 5000 at seven spots high renders micro text that is 220.5
high. The use of digital printers can now be used to generate microprinting. This can pose
a problem to how forensic examiners view the security of the microprinting feature. This
study suggests that there is a need for a re-evaluation of current techniques for forensic
identification of specific print processes. That being said, generation of micro print
elements on digital print devices offers print service providers, an opportunity to expand
services or enter new markets. Utilizing micro print elements on digital devices can be
utilized to produce more unique and individualized documents using micro text with
variable data printing.
Agenda for Further Research
The analysis used for this study based on the researchers visual perception and by its
nature subjective and tedious. Therefore, only one observer was used. An objective
measure might be obtained to eliminate the subjectivity of the observer. Photographing
the test targets with a microscope and testing them using Optical Character Recognition
(OCR) might yield a more and standardized evaluation type quality and could
test other fonts found in design and page layout applications, to validate that a designed
PostScript font is not needed. Testing a variety of different fonts and finding their
character recognition rate could be useful to determine which ones could be used for
microprinting applications. Another area for further research would be to test other micro
elements besides fonts to determine how different devices are capable of rendering
Bibliography
Adams, R. M., II., & Warner, R. D. (2005). Introduction to security printing. Sewickley, PA: Printing Industries of America/Graphic Arts Technical Foundation.
Arizona State University, & Garza, T. (2001). Thumbprints twenty dollar bill. In Images of nature. Retrieved October 13, 2006, from Images of Nature Arizona State University database: http://ion.asu.edu/cool56_twenty/cool56_twenty_opt_facemicro_30x.htm
Counterfeiting and piracy. (2006). U.S. chamber of commerce. Retrieved October 20, 2006, from http://www.uschamber.com/issues/index/counterfeiting/default
Heidelberg Speedmaster 74. (2007). Heidelberg. Retrieved March 21, 2007, from
http://www.heidelberg.com/www/html/en/content/products/sheetfed_offset/50x70/speed master_sm_74,overview?msgId=5515146676614
HP indigo press3050. (2006). Hewlett packard. Retrieved October 16, 2006, from
http://h30267.www3.hp.com/country/us/en/products/digital_press/3050/prodinfo_overvi ew.html?pageseq=985658
International Paper, Romano, F., & Riordan, M. (Eds.). (2003). Pocket pal - a graphic arts production handbook (Nineteenth ed.). Memphis, TN: International Paper. (Original work published 1934)
Kanellos, Michael. (2007, March 21). Nano alphabet soup gets cooking. Retrieved March 24, 2007, from http://news.com.com/Nano+alphabet+soup+gets+cooking/2100-1008_3-6169353.html
Kipphan, H. (2001). Handbook of print media. Berlin: Springer.
Nexpress 2100 features and benefits. (n.d.). NexPress: A kodak company. Retrieved October 15, 2006, from http://www.nexpress.com/dyn/products/nxp2100/features.jsp
Sigg, F. (2003). Documentation II. Rochester Institute of Technology, School of Print Media.
Torrey Pines Research. (2003). Inkjet print image quality considerations [Data file]. Retrieved from
http://www.tpr.com/PDFFiles/Pearls-white-paper-tpr.pdf#search=%22what%20is%20printer%20addressability%22
Towner, D., & Schneider, E. (2002). An objective resolution metric for digital printers [Data file]. Retrieved October 8, 2006, from
http://www.incits.org/tc_home/w11htm/2002docs/w1102020.pdf#search=%22what%20i s%20printer%20addressability%22
Tyler, D. (2006, October 8). Small font, big-time security - Xerox’s new tiny typeface can add layer of protection to documents. Rochester Democrat and Chronicle. Retrieved October 15, 2006, from
http://www.democratandchronicle.com/apps/pbcs.dll/article?AID=2006610080308