R E S E A R C H A R T I C L E
Open Access
High-cost health care users in Ontario, Canada:
demographic, socio-economic, and health status
characteristics
Laura C Rosella
1,2,3*, Tiffany Fitzpatrick
3, Walter P Wodchis
2,4,5, Andrew Calzavara
2, Heather Manson
1,3and Vivek Goel
1,2,3,4Abstract
Background:Health care spending is overwhelmingly concentrated within a very small proportion of the population, referred to as the high-cost users (HCU). To date, research on HCU has been limited in scope, focusing mostly on those characteristics available through administrative databases, which have been largely clinical in nature, or have relied on ecological measures of socio-demographics. This study links population health surveys to administrative data, allowing for the investigation of a broad range of individual-level characteristics and provides a more thorough characterization of community-dwelling HCU across demographic, social, behavioral and clinical characteristics.
Methods:We linked three cycles of the Canadian Community Health Survey (CCHS) to medical claim data for the years 2003–2008 for Ontario, Canada. Participants were ranked according to gradients of cost (Top 1%, Top 2-5%, Top 6-50% and Bottom 50%) and multinomial logistic regression was used to investigate a wide range of factors, including health behaviors and socio-demographics, likely associated with HCU status.
Results:Using a total sample of 91,223 adults (18 and older), we found that HCU status was strongly associated with being older, having multiple chronic conditions, and reporting poorer self-perceived health. Specifically, in the fully-adjusted model, poor self-rated health (vs. good) was associated with a 26-fold increase in odds of becoming a Top 1% HCU (vs. Bottom 50% user) [95% CI: (18.9, 36.9)]. Further, HCU tended to be of lower socio-economic status, former daily smokers, physically inactive, current non-drinkers, and obese.
Conclusions:The results of this study have provided valuable insights into the broader characteristics of community-dwelling HCU, including unique demographic and behavioral characteristics. Additionally, strong associations with self-reported clinical variables, such as self-rated general and mental health, highlight the importance of the patient perspective for HCU. These findings have the potential to inform policies for health care and public health, particularly in light of increasing decision-maker attention in the sustainability of the health care system, improving patient outcomes and, more generally, in order to achieve the common goal of improving population health outcomes.
Keywords:Health care utilization, High-cost users, Upstream determinants, Population perspective, Canadian Community Health Survey
* Correspondence:laura.rosella@utoronto.ca 1
Dalla Lana School of Public Health, University of Toronto, 155 College Street, Suite 600, Toronto, ON M5T 3M7, Canada
2
Institute for Clinical Evaluative Sciences, Room 424, 155 College Street, Toronto, ON M5T 3M6, Canada
Full list of author information is available at the end of the article
Background
It is well known that health care spending is overwhelm-ingly concentrated; a very small proportion of the popu-lation consumes the majority of costs. In 2007/08, the top 1% of health care users in Ontario accounted for one-third of health care spending; the lower 50% of users, on the other hand, consumed a mere 1% of total expenditures [1]. This is not a phenomenon specific to Ontario, nor is it one isolated within Canada’s universal health care system. Indeed, this skewness in health care spending has been documented in nearly every health care system [2-16].
There has been a renewed interest in the so-called “high-cost users” (HCU) of health care in recent years. Policy makers are becoming increasingly concerned with the sustainability of the health care system, quality of care and patient outcomes [13,17-19]. Attention has been placed on programs to manage high-risk groups, such as the elderly and those with multiple comorbidi-ties [18,19]. Research has overwhelmingly focused on improving patient outcomes through better case man-agement and strategies to reduce health care spending. Few, however, have highlighted the importance of iden-tifying the broader determinants of HCU, which can be very influential upon health status. Understanding the HCU population from a broader perspective is para-mount to better managing patients who are currently HCU or those on the path to becoming HCU.
To date, the narrow characterization of HCU has been largely due to the limited data on social and behavioral factors linked with utilization outcomes. To overcome this gap, we have linked medical care use data for partic-ipants from several cycles of a national population-based survey. This has allowed us to investigate a multitude of individual-level characteristics not available in previous studies. By investigating a broad range of socio-economic, behavioral, and health status characteristics, we aim to more fully characterize HCU living in the community.
Methods Data sources
We linked population-based health administrative data from Ontario, Canada, to participants from multiple cycles of the Canadian Community Health Survey (CCHS) conducted in 2003, 2005, and 2007/8. The CCHS, a cross-sectional survey administered by Statistics Canada, collects self-reported health-related data. Briefly, the CCHS uses a multi-stage sampling survey design to target Canadians 12 years of age or older living in private dwellings. Detailed survey methodology is documented elsewhere [20]. All Ontario residents are covered by a single payer insurance system referred to as the Ontario Health Insurance Plan (OHIP) and all related health care utilization is tracked in the health administrative data.
Health care spending was calculated using administra-tive data across health care sectors, including in-patient hospital stay, emergency department visits, same day surgery, stays in complex continuing care hospitals and inpatient rehabilitation, inpatient psychiatric admissions, physician payments for patient visits and community laboratory, and prescriptions filled for individuals eligible for the Ontario Drug Benefit (ODB).” A person-centered costing methodology, developed at the Institute for Clinical Evaluative Sciences (ICES), was used to determine total health care spending [21].
Participants were excluded if they could not be suc-cessfully linked to administrative data, e.g. not found in the Registered Persons Database (RPDB), a population-based registry maintained by Ontario’s Ministry of Health and Long-term Care; already appeared in a pre-vious cycle of CCHS; or were OHIP-ineligible for the entire observation window. Respondents aged 12 – 18 were also excluded.
Prior health care utilization was captured using a 2-year look-back period from interview date and Aggre-gated Diagnosis Groups (ADGs) scores were calculated [22]. Briefly, the Johns Hopkins ADGs provide a numeric method for grouping diagnostic codes similar to terms of severity and likelihood of persistence. Their use has previously been validated in the adult Ontario population [22]. All other baseline characteristics were captured from interview variables including household income, demo-graphics, health behaviors and medical history (e.g. health status, chronic conditions, having a regular medical doc-tor). For the outcome, we calculated costs based on utilization for the year following interview date and ranked individuals according to gradients of cost within each CCHS cohort (1, 2–5, 6–50 and lower 50th percentiles); HCU were defined as the Top 5% of users.
Statistical analysis
Descriptive analyses (frequency, mean, median) were cal-culated for all covariates across four utilization ranking groups and the overall cohort population. Multinomial logistic regression models were used to quantify the asso-ciation between socio-economic, demographic, health and behavioral characteristics with gradients of use, including unadjusted, age-adjusted and fully-adjusted models. Using the Bottom 50% as the referent group, the multinomial models estimated the odds for each of the Top 1%, Top 2-5% and Top 6-50% cost-rank groups. A nominal multi-nomial model was chosen given the hypothesized differen-tial association between the characteristics of interest and gradients of use. The proportional odds assumption was tested to assess the appropriateness of treating the out-come as categorical, opposed to ordinal; where p <0.05 signifies a violation of the proportional odds assumption (i.e. the response should not be treated as ordered) [23].
Rosellaet al. BMC Health Services Research2014,14:532 Page 2 of 13
All covariates were treated as categorical. Sensitivity analyses were conducted to assess the effect of includ-ing additional individual- and ecological-level SES mea-sures. The more parsimonious model was kept if there were non-significant changes to model estimates.
Bootstrap sampling weights, as provided by Statistics Canada, were applied using Balanced Repeated Repli-cation (BRR) to all analyses to adjust for the complex survey design of the CCHS and to produce estimates reflecting a sample of the Ontario population weighted over three time points. Combining cycles of the CCHS in this manner, referred to as the “pooled approach”, allows for an increased sample size, and thus, statistical power [24]. Weighted 95% confidence limits were calcu-lated for all descriptive and regression estimates.
All statistical analyses were performed using SAS ver-sion 9.3 (SAS Institute Inc; Cary, NC). Proc SurveyFreq and Proc SurveyMeans were used to conduct descriptive analyses; Proc SurveyLogistic was used for multinomial logistic regression.
Ethics approval
The study design received ethics approval from the Ethics Review Boards of Public Health Ontario and Sunnybrook Health Sciences Center.
Results
A total of 101,719 individuals responded to the surveys and were successfully linked to administrative data via provincial insurance health card number; resulting in a linkage rate of approximately 84% among those respon-dents who agreed to share their data. After applying our exclusion criteria, a sample of 91,223 adult respondents was included in our analysis; with approximately one-third of respondents coming from each CCHS cycle. Exclusions were not significantly different across cycles.
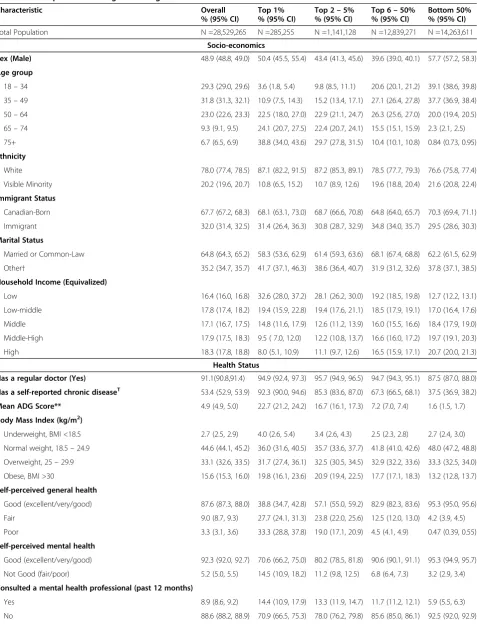
Table 1 provides the weighted distribution of all demo-graphic, socio-economic, health and behavioral charac-teristics for each of the four utilization groups (Top 1%, Top 2-5%, Top 6-50%, and Bottom 50%) and the overall CCHS weighted Ontario population. Compared to those with lower utilization, community-dwelling HCU (Top 5%) tended to be older, white ethnicity, and have lower household income. HCU more frequently reported having a regular medical doctor, having any chronic disease and had mean ADG scores magnitudes greater than the moderate and low utilization groups. HCU were also more likely to report poorer self-perceived health (both general and mental health) and to have reported con-sulting a mental health professional in the past year. Furthermore, HCU tended to be overweight or obese, former smokers, physically inactive, and current non-drinkers. All of these associations were more pronounced for the extreme HCU (Top 1%).
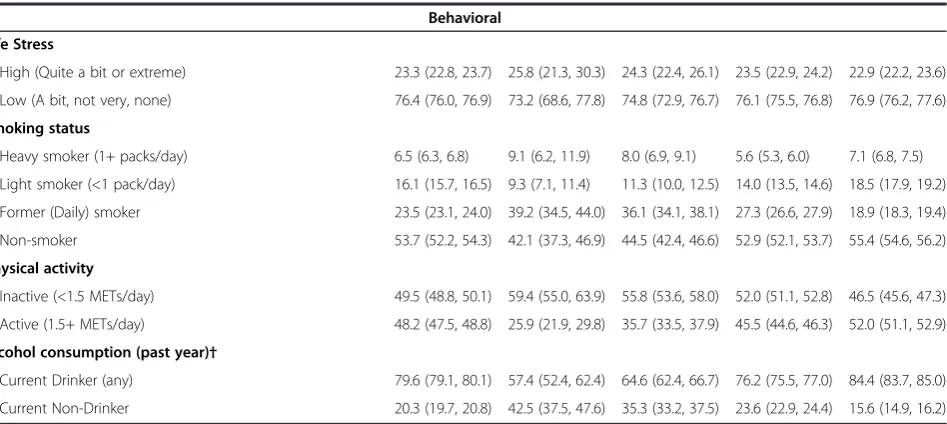
As expected, HCU accounted for the greatest proportion of health care spending within the non-institutionalized community. The Top 1% accounted for 27.5% of total health care spending, which translates to over $15 Billion (95% CI: $13.5 –16.9 B) in health care costs (Figure 1a). Combined, the top 5% of users incurred over 55% of total health care costs. In comparison, the Bottom 50% accounted for less than 4% of total spending (approxi-mately $2 billion). In the overall sample, 33.0% [95% CI: (31.4%, 32.9%)] of health care costs were incurred through physician services, 30.2% [95% CI: (28.8%, 31.6%)] through acute hospital care and 16.0% (95% CI: 15.4, 16.6) was spent on eligible drug prescriptions (ODB) (Figure 1b). In comparison, the largest contributor for the Top 1% was acute hospital care spending, accounting for an over-whelming 54.2% [95% CI: (51.1%, 57.4%)] of total costs (Figure 1c). For the Top 2-5%, acute hospital care accounted for 40.0% [95% CI: (38.8%, 41.2%) of total spending; while for the Top 6-50% group, acute hos-pital care accounted for only 10.2% [95% CI: (9.6%, 10.8%)] of the total costs incurred. The Bottom 50% incurred no costs on acute hospital care and instead expenditures mainly occurred through physician ser-vices [86.9%; 95% CI: (85.9%, 87.7%)].
For the overall weighted sample, average per-person spending was just under $2,000. Average spending was $142 for the Bottom 50% (Table 2), while the Top 1% incurred on average $53,150; a nearly 400-fold differ-ence. Unsurprisingly, the highest average costs for the HCU groups corresponded to acute hospital care, while physician services were the largest contributor to aver-age expenses for the Top 6-50% and Bottom 50% groups. Interestingly, only 75% of the Bottom 50% saw a physician during the follow-up year (Table 3). All four user groups were similarly likely to be enrolled with a physician not compensated through the typical fee-for service payment system (capitation services are pro-vided through Family Health Networks/Organizations in Ontario).
Table 1 The weighted* distribution of demographic, socio-economic, health and behavioral characteristics across health care expenditure categories using the 2003–2008 CCHS cohorts for adult Ontarians
Characteristic Overall
% (95% CI)
Top 1% % (95% CI)
Top 2–5% % (95% CI)
Top 6–50% % (95% CI)
Bottom 50% % (95% CI)
Total Population N =28,529,265 N =285,255 N =1,141,128 N =12,839,271 N =14,263,611
Socio-economics
Sex (Male) 48.9 (48.8, 49.0) 50.4 (45.5, 55.4) 43.4 (41.3, 45.6) 39.6 (39.0, 40.1) 57.7 (57.2, 58.3)
Age group
18–34 29.3 (29.0, 29.6) 3.6 (1.8, 5.4) 9.8 (8.5, 11.1) 20.6 (20.1, 21.2) 39.1 (38.6, 39.8) 35–49 31.8 (31.3, 32.1) 10.9 (7.5, 14.3) 15.2 (13.4, 17.1) 27.1 (26.4, 27.8) 37.7 (36.9, 38.4) 50–64 23.0 (22.6, 23.3) 22.5 (18.0, 27.0) 22.9 (21.1, 24.7) 26.3 (25.6, 27.0) 20.0 (19.4, 20.5) 65–74 9.3 (9.1, 9.5) 24.1 (20.7, 27.5) 22.4 (20.7, 24.1) 15.5 (15.1, 15.9) 2.3 (2.1, 2.5) 75+ 6.7 (6.5, 6.9) 38.8 (34.0, 43.6) 29.7 (27.8, 31.5) 10.4 (10.1, 10.8) 0.84 (0.73, 0.95)
Ethnicity
White 78.0 (77.4, 78.5) 87.1 (82.2, 91.5) 87.2 (85.3, 89.1) 78.5 (77.7, 79.3) 76.6 (75.8, 77.4)
Visible Minority 20.2 (19.6, 20.7) 10.8 (6.5, 15.2) 10.7 (8.9, 12.6) 19.6 (18.8, 20.4) 21.6 (20.8, 22.4)
Immigrant Status
Canadian-Born 67.7 (67.2, 68.3) 68.1 (63.1, 73.0) 68.7 (66.6, 70.8) 64.8 (64.0, 65.7) 70.3 (69.4, 71.1)
Immigrant 32.0 (31.4, 32.5) 31.4 (26.4, 36.3) 30.8 (28.7, 32.9) 34.8 (34.0, 35.7) 29.5 (28.6, 30.3)
Marital Status
Married or Common-Law 64.8 (64.3, 65.2) 58.3 (53.6, 62.9) 61.4 (59.3, 63.6) 68.1 (67.4, 68.8) 62.2 (61.5, 62.9)
Other† 35.2 (34.7, 35.7) 41.7 (37.1, 46.3) 38.6 (36.4, 40.7) 31.9 (31.2, 32.6) 37.8 (37.1, 38.5) Household Income (Equivalized)
Low 16.4 (16.0, 16.8) 32.6 (28.0, 37.2) 28.1 (26.2, 30.0) 19.2 (18.5, 19.8) 12.7 (12.2, 13.1)
Low-middle 17.8 (17.4, 18.2) 19.4 (15.9, 22.8) 19.4 (17.6, 21.1) 18.5 (17.9, 19.1) 17.0 (16.4, 17.6)
Middle 17.1 (16.7, 17.5) 14.8 (11.6, 17.9) 12.6 (11.2, 13.9) 16.0 (15.5, 16.6) 18.4 (17.9, 19.0)
Middle-High 17.9 (17.5, 18.3) 9.5 ( 7.0, 12.0) 12.2 (10.8, 13.7) 16.6 (16.0, 17.2) 19.7 (19.1, 20.3)
High 18.3 (17.8, 18.8) 8.0 (5.1, 10.9) 11.1 (9.7, 12.6) 16.5 (15.9, 17.1) 20.7 (20.0, 21.3) Health Status
Has a regular doctor (Yes) 91.1(90.8,91.4) 94.9 (92.4, 97.3) 95.7 (94.9, 96.5) 94.7 (94.3, 95.1) 87.5 (87.0, 88.0)
Has a self-reported chronic diseaseT 53.4 (52.9, 53.9) 92.3 (90.0, 94.6) 85.3 (83.6, 87.0) 67.3 (66.5, 68.1) 37.5 (36.9, 38.2)
Mean ADG Score** 4.9 (4.9, 5.0) 22.7 (21.2, 24.2) 16.7 (16.1, 17.3) 7.2 (7.0, 7.4) 1.6 (1.5, 1.7)
Body Mass Index (kg/m2)
Underweight, BMI <18.5 2.7 (2.5, 2.9) 4.0 (2.6, 5.4) 3.4 (2.6, 4.3) 2.5 (2.3, 2.8) 2.7 (2.4, 3.0)
Normal weight, 18.5–24.9 44.6 (44.1, 45.2) 36.0 (31.6, 40.5) 35.7 (33.6, 37.7) 41.8 (41.0, 42.6) 48.0 (47.2, 48.8) Overweight, 25–29.9 33.1 (32.6, 33.5) 31.7 (27.4, 36.1) 32.5 (30.5, 34.5) 32.9 (32.2, 33.6) 33.3 (32.5, 34.0) Obese, BMI >30 15.6 (15.3, 16.0) 19.8 (16.1, 23.6) 20.9 (19.4, 22.5) 17.7 (17.1, 18.3) 13.2 (12.8, 13.7)
Self-perceived general health
Good (excellent/very/good) 87.6 (87.3, 88.0) 38.8 (34.7, 42.8) 57.1 (55.0, 59.2) 82.9 (82.3, 83.6) 95.3 (95.0, 95.6)
Fair 9.0 (8.7, 9.3) 27.7 (24.1, 31.3) 23.8 (22.0, 25.6) 12.5 (12.0, 13.0) 4.2 (3.9, 4.5)
Poor 3.3 (3.1, 3.6) 33.3 (28.8, 37.8) 19.0 (17.1, 20.9) 4.5 (4.1, 4.9) 0.47 (0.39, 0.55)
Self-perceived mental health
Good (excellent/very/good) 92.3 (92.0, 92.7) 70.6 (66.2, 75.0) 80.2 (78.5, 81.8) 90.6 (90.1, 91.1) 95.3 (94.9, 95.7)
Not Good (fair/poor) 5.2 (5.0, 5.5) 14.5 (10.9, 18.2) 11.2 (9.8, 12.5) 6.8 (6.4, 7.3) 3.2 (2.9, 3.4)
Consulted a mental health professional (past 12 months)
Yes 8.9 (8.6, 9.2) 14.4 (10.9, 17.9) 13.3 (11.9, 14.7) 11.7 (11.2, 12.1) 5.9 (5.5, 6.3)
No 88.6 (88.2, 88.9) 70.9 (66.5, 75.3) 78.0 (76.2, 79.8) 85.6 (85.0, 86.1) 92.5 (92.0, 92.9)
Rosellaet al. BMC Health Services Research2014,14:532 Page 4 of 13
levels of users groups was noted. In the adjusted models, these effects were reduced and in the case of the Top 6-50% group, the association between visible minority status and health care use were reversed. Lower income had a strong relationship with utilization in the unadjusted models. However in the full-adjustment models, extreme HCU was not significantly related to income and other utilization groups showed a non-linear pattern, with middle-income group having lower likelihood and the lowest-income group having higher likelihood of higher utilization (compared to the highest income group).
Variables capturing health status (both self-reported and measured by health care utilization) showed very strong associations with health care consumption. Having a self-reported chronic disease, ADG score in the high-est quintile, and reporting poorer self-perceived general health were strongly associated with increased health care utilization. The adjusted odds ratios for these vari-ables were greatly reduced, but still remained largely influential. Similarly, recent contact with a mental health professional and poorer self-perceived mental health was also strongly associated with increased healthcare spending; however, these effects were strengthened in the age-adjusted model. Having a regu-lar medical doctor showed protective effects; these remained mostly significant, even with attenuation after adjustment. In the unadjusted analysis, all unhealthy weight categories were associated with increased health
care costs; the odds of being a community-dwelling HCU were two times greater for underweight or obese individuals as compared to normal weight individuals. Further, HCU was associated with former smoking sta-tus, being physically inactive and being a current non-drinker; life stress, however, was not significantly associ-ated with use. Overall, the health behavior variables were only moderately associated with HCU and effect sizes were greatly reduced after adjustment.
In the sensitivity analysis, the inclusion of additional measures of SES, including individual- and ecological-level variables, had no effect on any of the multinomial model estimates. This suggests that the multiple indi-vidual-level SES indicators originally included in the fully-adjusted multinomial regression model are quite robust towards characterizing HCU in this non-institu-tionalized, community-dwelling population.
Discussion
[image:5.595.65.539.112.324.2]This study offers a full characterization of the broad range of social, behavioral, and health factors associated with health care utilization for a population-based sam-ple in the context of a universal health care system. While there has been a recent renewed interest in health care spending, sustainability, quality of care and patient outcomes, focus on the broader characterization of these individuals that would support alternative perspectives on how to best address this issue has been limited. For example, HCU interventions have been overwhelmingly Table 1 The weighted* distribution of demographic, socio-economic, health and behavioral characteristics across health care expenditure categories using the 2003–2008 CCHS cohorts for adult Ontarians(Continued)
Behavioral
Life Stress
High (Quite a bit or extreme) 23.3 (22.8, 23.7) 25.8 (21.3, 30.3) 24.3 (22.4, 26.1) 23.5 (22.9, 24.2) 22.9 (22.2, 23.6)
Low (A bit, not very, none) 76.4 (76.0, 76.9) 73.2 (68.6, 77.8) 74.8 (72.9, 76.7) 76.1 (75.5, 76.8) 76.9 (76.2, 77.6)
Smoking status
Heavy smoker (1+ packs/day) 6.5 (6.3, 6.8) 9.1 (6.2, 11.9) 8.0 (6.9, 9.1) 5.6 (5.3, 6.0) 7.1 (6.8, 7.5)
Light smoker (<1 pack/day) 16.1 (15.7, 16.5) 9.3 (7.1, 11.4) 11.3 (10.0, 12.5) 14.0 (13.5, 14.6) 18.5 (17.9, 19.2)
Former (Daily) smoker 23.5 (23.1, 24.0) 39.2 (34.5, 44.0) 36.1 (34.1, 38.1) 27.3 (26.6, 27.9) 18.9 (18.3, 19.4)
Non-smoker 53.7 (52.2, 54.3) 42.1 (37.3, 46.9) 44.5 (42.4, 46.6) 52.9 (52.1, 53.7) 55.4 (54.6, 56.2)
Physical activity
Inactive (<1.5 METs/day) 49.5 (48.8, 50.1) 59.4 (55.0, 63.9) 55.8 (53.6, 58.0) 52.0 (51.1, 52.8) 46.5 (45.6, 47.3)
Active (1.5+ METs/day) 48.2 (47.5, 48.8) 25.9 (21.9, 29.8) 35.7 (33.5, 37.9) 45.5 (44.6, 46.3) 52.0 (51.1, 52.9)
Alcohol consumption (past year)†
Current Drinker (any) 79.6 (79.1, 80.1) 57.4 (52.4, 62.4) 64.6 (62.4, 66.7) 76.2 (75.5, 77.0) 84.4 (83.7, 85.0)
Current Non-Drinker 20.3 (19.7, 20.8) 42.5 (37.5, 47.6) 35.3 (33.2, 37.5) 23.6 (22.9, 24.4) 15.6 (14.9, 16.2)
*Weighted using bootstrap weights provided by Statistics Canada.†Other: Divorced, separated, widowed or single.T
focused on case-management for patients who are already HCU or frequent users of the health care system; knowledge of the upstream determinants of HCU, par-ticularly those that are non-clinical in nature, such as SES and health behaviors, is desperately lacking. Recent reports have suggested that health programs targeting high-risk groups may play an important role in health care sustainability [17-19], suggesting that $1.5 billion could be saved if just a 10% reduction in spending could be achieved for Ontario’s Top 5% of spenders [1].
Understanding HCU from a broader socio-economic and cultural perspective is crucial if modifiable charac-teristics are to be identified and addressed from both within and outside the health care system.
[image:6.595.59.540.87.576.2]The results of this study are consistent with previous research on HCU. Many studies have attempted to characterize HCU; however, these have examined only a minimal number and breadth of variables, have relied on binary definitions of HCU and have employed simplistic analytic techniques. Indeed, most characterizations of Figure 1Distribution of Health Care Spending.The proportion of total health care spending incurred by each user group(a)and average (per person) spending across health care sectors for the overall weighted population(b)and by user group(c).
Rosellaet al. BMC Health Services Research2014,14:532 Page 6 of 13
the HCU population have been limited to the informa-tion available in administrative data sources, such as age, sex, ethnicity and clinical measures; while others have included SES, most examined only income or education and relied on ecological-level measures. Only one other study has investigated HCU in Canada using health survey data linked to medical utilization records [2]. According to this 2009 study by Lemstra et al., low-income residents of Saskatoon had higher health care costs overall com-pared to higher-income groups. This is in agreement with the findings of our study; however, our affirmation of
[image:7.595.58.539.100.302.2]this association was confirmed even after controlling for several additional variables and finer categories of utilization. These findings suggest that differences in health care spending are not merely a result of differ-ences in health-seeking behavior, but may reflect higher needs in specific groups, such as low income users, as a result of poorer health. Our results are also consistent with previous literature examining socioeconomic status (SES) and HCU [2-16], although none of the previous studies adjusted for the number and depth of individual-level SES variables that were included in our study [2-16]. Table 2 Average (per person) expenditure* across health care service types for the weighted CCHS sample
Service type Overall (95% CI) Top 1% $CAD (95% CI)
Top 2–5% $CAD (95% CI)
Top 6–50% $CAD (95% CI)
Bottom 50% $CAD (95% CI)
Acute hospital care $ 584 (542–627) $ 28,830 (25,620–32,040) $ 5,382 (5,185–5,578) $ 180 (167–192) $ 0–
Physician services $ 639 (627–650) $ 6,374 (5,920–6,827) $ 2,995 (2,904–3,088) $ 874 (863–885) $ 124 (121–126) Ontario drug
Benefit (ODB)†
$ 309 (298–319) $ 3,803 (3,179–4,428) $ 2,214 (2,071–2,357) $ 403 (391–415) $ 1 (1–2) Home care $ 107 (98–117) $ 3,910 (3,261–4,560) $ 1,337 (1,192–1,482) $ 32 (29–36) $ 0– Emergency Dpt. $ 91 (89–94) $ 1,271 (1255–1,387) $ 584 (556–612) $ 111 (107–114) $11 (10–12) Day surgery $ 95 (91–99) $ 744 (554–934) $ 570 (523–618) $ 143 (137–149) $ 0– Complex continuing
care
$ 32 (21–44) $ 3,007 (1,848–4,167) $ 54 (30–78) $ 0– $ 0– Rehabilitation $ 36 (27–44) $ 2,967 (2,156–3,779) $ 150 (107–193) $ 0– $ 0– Long-term care $27 (21–32) $2,172 (1,627–2,717) $123 (84–162) $0 (0–1) $0– Non-Physician
Services‡
$ 15 (15–16) $ 70 (51–88) $ 42 (35–48) $ 22 (21–24) $ 6 (6–6) All services $ 1,935 (1,872–1,997) $ 53,150 (49,518–56,783) $ 13,450 (13,234–13,666) $ 1,765 (1,741–1,790) $ 142 (140–144) *Expenditure ($CAD) calculated for the year following CCHS interview.†Individuals eligible for ODB: Ontarians 65 years of age and older, those receiving Ontario Works (a financial assistance program), on the Ontario Disability Support Program, live in LTC, etc.‡Non-Physician services include optometrists, physiotherapists, etc. for covered individuals (Ontarians 65 years or age or older, those with specific chronic diseases, and those in specific government assistance programs).
Table 3 Proportion of the weighted CCHS sample, according to cost rank groups, using each health care service type
Proportion of the population or cost-rank group using health care sector (%)
Sector Overall
% (95% CI)
Top 1% % (95% CI)
Top 2–5% % (95% CI)
Top 6–50% % (95% CI)
Bottom 50% % (95% CI)
Total population N =28,529,265 N =285,255 N =1,141,128 N =12,839,271 N =28,529,265
Physician services 87.4 (87.0, 87.8) 100.0 (100, 100) 100.0 (99.9, 100) 99.7 (99.6, 99.9) 75.0 (74.3, 75.7)
Rehabilitation 24.2 (20.3, 28.1) 13.8 (11.2, 16.3) 2.6 (1.8, 3.3) 0 0
Long-term care 23.2 (18.9, 27.4) 14.1 (11.3, 17.0) 2.1 (1.3, 2.9) 0 0
Emergency Dpt. 21.4 (21.0, 21.8) 83.5 (79.8, 87.2) 66.1 (64.1, 68.2) 31.2 (30.5, 32.0) 7.8 (7.4, 8.1)
Non-Physician services 20.8 (20.4, 21.2) 36.2 (31.8, 40.6) 38.1 (36.1, 40.1) 28.6 (27.9, 29.3) 12.0 (11.5, 12.5)
Ontario Drug Benefit 20.1 (19.8, 20.3) 84.4 (80.6, 88.1) 70.7 (68.7, 72.7) 33.5 (32.9, 34.1) 2.7 (2.4, 2.9)
Complex continuing care 13.9 (11.2, 16.5) 10.1 (8.0, 12.3) 0.9 (0.5, 1.2) 0 0
Physician services - Capitation* 12.7 (12.4, 13.0) 14.4 (11.9, 16.9) 13.8 (12.5, 15.1) 13.6 (13.1, 14.0) 11.7 (11.3, 12.1)
Day surgery 9.7 (9.4, 10.0) 37.0 (32.1, 42.0) 36.8 (34.8, 38.8) 17.4 (16.8, 18.0) 0.1 (0, 0.1)
Acute hospital care 6.5 (6.3, 6.8) 92.0 (89.6, 94.3) 71.7 (69.7, 73.7) 6.1 (5.7, 6.5) 0
Home care 3.3 (3.2, 3.5) 68.0 (63.7, 72.4) 38.3 (36.2, 40.4) 2.5 (2.3, 2.7) 0
Any service 90.1 (89.8, 90.5) 100.0 (100, 100) 100.0 (100, 100) 100.0 (100, 100) 80.3 (79.6, 80.9)
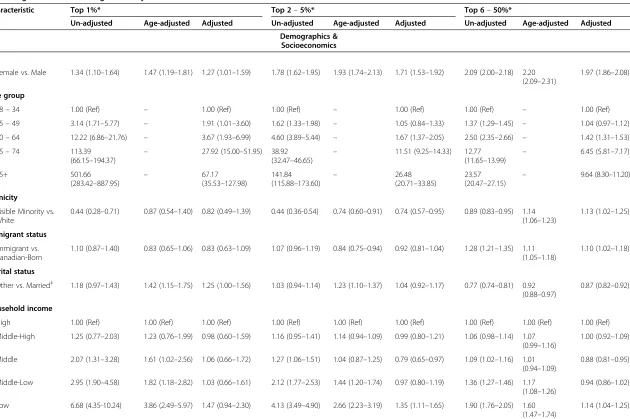
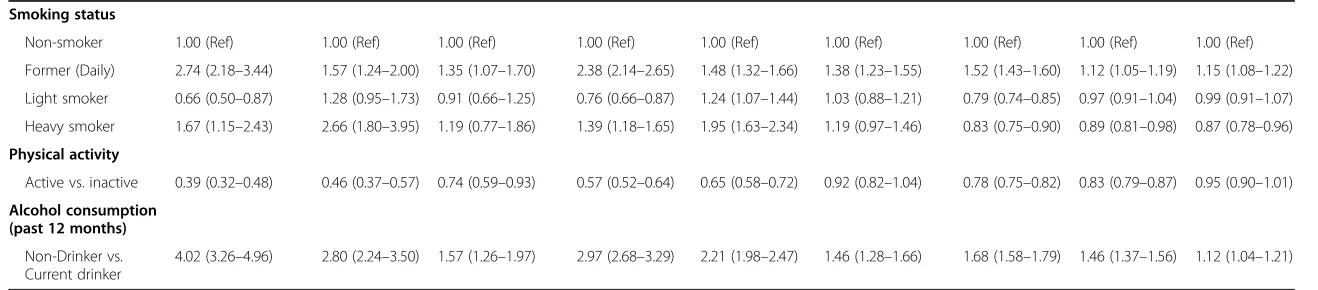
[image:7.595.59.540.500.717.2]Table 4 Weighted unadjusted, age-adjusted and adjusted odds ratios (and corresponding 95% confidence intervals) according to multinomial logistic analysis
Characteristic Top 1%* Top 2–5%* Top 6–50%*
Un-adjusted Age-adjusted Adjusted Un-adjusted Age-adjusted Adjusted Un-adjusted Age-adjusted Adjusted
Demographics & Socioeconomics
Sex
Female vs. Male 1.34 (1.10–1.64) 1.47 (1.19–1.81) 1.27 (1.01–1.59) 1.78 (1.62–1.95) 1.93 (1.74–2.13) 1.71 (1.53–1.92) 2.09 (2.00–2.18) 2.20 (2.09–2.31)
1.97 (1.86–2.08)
Age group
18–34 1.00 (Ref) – 1.00 (Ref) 1.00 (Ref) – 1.00 (Ref) 1.00 (Ref) – 1.00 (Ref)
35–49 3.14 (1.71–5.77) – 1.91 (1.01–3.60) 1.62 (1.33–1.98) – 1.05 (0.84–1.33) 1.37 (1.29–1.45) – 1.04 (0.97–1.12)
50–64 12.22 (6.86–21.76) – 3.67 (1.93–6.99) 4.60 (3.89–5.44) – 1.67 (1.37–2.05) 2.50 (2.35–2.66) – 1.42 (1.31–1.53)
65–74 113.39
(66.15–194.37) –
27.92 (15.00–51.95) 38.92
(32.47–46.65) –
11.51 (9.25–14.33) 12.77
(11.65–13.99) –
6.45 (5.81–7.17)
75+ 501.66
(283.42–887.95)
– 67.17
(35.53–127.98)
141.84 (115.88–173.60)
– 26.48
(20.71–33.85)
23.57 (20.47–27.15)
– 9.64 (8.30–11.20)
Ethnicity
Visible Minority vs. White
0.44 (0.28–0.71) 0.87 (0.54–1.40) 0.82 (0.49–1.39) 0.44 (0.36-0.54) 0.74 (0.60–0.91) 0.74 (0.57–0.95) 0.89 (0.83–0.95) 1.14 (1.06–1.23)
1.13 (1.02–1.25)
Immigrant status
Immigrant vs. Canadian-Born
1.10 (0.87–1.40) 0.83 (0.65–1.06) 0.83 (0.63–1.09) 1.07 (0.96–1.19) 0.84 (0.75–0.94) 0.92 (0.81–1.04) 1.28 (1.21–1.35) 1.11 (1.05–1.18)
1.10 (1.02–1.18)
Marital status
Other vs. Married‡ 1.18 (0.97–1.43) 1.42 (1.15–1.75) 1.25 (1.00–1.56) 1.03 (0.94–1.14) 1.23 (1.10–1.37) 1.04 (0.92–1.17) 0.77 (0.74–0.81) 0.92 (0.88–0.97)
0.87 (0.82–0.92)
Household income
High 1.00 (Ref) 1.00 (Ref) 1.00 (Ref) 1.00 (Ref) 1.00 (Ref) 1.00 (Ref) 1.00 (Ref) 1.00 (Ref) 1.00 (Ref)
Middle-High 1.25 (0.77–2.03) 1.23 (0.76–1.99) 0.98 (0.60–1.59) 1.16 (0.95–1.41) 1.14 (0.94–1.09) 0.99 (0.80–1.21) 1.06 (0.98–1.14) 1.07 (0.99–1.16)
1.00 (0.92–1.09)
Middle 2.07 (1.31–3.28) 1.61 (1.02–2.56) 1.06 (0.66–1.72) 1.27 (1.06–1.51) 1.04 (0.87–1.25) 0.79 (0.65–0.97) 1.09 (1.02–1.16) 1.01 (0.94–1.09)
0.88 (0.81–0.95)
Middle-Low 2.95 (1.90–4.58) 1.82 (1.18–2.82) 1.03 (0.66–1.61) 2.12 (1.77–2.53) 1.44 (1.20–1.74) 0.97 (0.80–1.19) 1.36 (1.27–1.46) 1.17 (1.08–1.26)
0.94 (0.86–1.02)
Low 6.68 (4.35-10.24) 3.86 (2.49–5.97) 1.47 (0.94–2.30) 4.13 (3.49–4.90) 2.66 (2.23–3.19) 1.35 (1.11–1.65) 1.90 (1.76–2.05) 1.60 (1.47–1.74)
1.14 (1.04–1.25)
Rosella
et
al.
BMC
Health
Services
Research
2014,
14
:532
Page
8
o
f
1
3
http://ww
w.biomedce
ntral.com/1
Has a regular doctor
Yes vs. No 2.63 (1.59–4.38) 1.51 (0.90–2.54) 1.22 (0.68–2.19) 3.23 (2.56–3.85) 2.07 (1.65–2.60) 1.61 (1.25–2.07) 2.59 (2.33–2.78) 2.02 (1.84–2.23) 1.55 (1.40–1.71)
Has a self-reported chronic disease
Yes vs. No 20.02 (14.43–27.77) 8.22 (5.81–11.6) 2.53 (1.75–3.67) 9.68 (8.39–11.17) 4.90 (4.24–5.66) 2.15 (1.85–2.50) 3.43 (3.27–3.59) 2.42 (2.30–2.55) 1.75 (1.66–1.85)
ADG
Score - Quintile
Q 1 (Lowest) 1.00 (Ref) 1.00 (Ref) 1.00 (Ref) 1.00 (Ref) 1.00 (Ref) 1.00 (Ref) 1.00 (Ref) 1.00 (Ref) 1.00 (Ref)
Q 2 1.30 (0.59–2.87) 0.93 (0.41–2.09) 1.07 (0.46–2.47) 0.53 (0.41–0.69) 0.42 (0.33–0.55) 0.53 (0.40–0.70) 0.49 (0.45–0.53) 0.43 (0.40–0.47) 0.57 (0.52–0.62)
Q 3 2.04 (1.03–4.03) 1.25 (0.62–2.52) 1.24 (0.60–2.53) 1.26 (0.96–1.66) 0.91 (0.69–1.20) 0.97 (0.73–1.30) 0.97 (0.90–1.05) 0.81 (0.75–0.88) 0.93 (0.85–1.01)
Q 4 4.81 (2.78–8.32) 1.97 (1.11–3.49) 1.59 (0.88–2.85) 2.96 (2.38–3.69) 1.56 (1.24–1.95) 1.43 (1.13–1.81) 1.75 (1.64–1.88) 1.22 (1.13–1.31) 1.27 (1.18–1.38)
Q 5 (Highest) 92.96 (55.55–155.58) 22.37 (12.77–39.16)
10.16 (5.77–17.90) 25.94 (21.19–31.77)
8.68 (6.99–10.78) 5.36 (4.30–6.68) 5.26 (4.90–5.66) 2.79 (2.57–3.02) 2.51 (2.31–2.74)
Body mass index
Underweight 1.97 (1.33–2.91) 2.82 (1.84–4.33) 1.40 (0.88–2.23) 1.70 (1.29–2.24) 2.28 (1.67–3.11) 1.37 (0.97–1.93) 1.06 (0.91–1.25) 1.29 (1.09–1.53) 0.99 (0.82–1.19)
Normal weight 1.00 (Ref) 1.00 (Ref) 1.00 (Ref) 1.00 (Ref) 1.00 (Ref) 1.00 (Ref) 1.00 (Ref) 1.00 (Ref) 1.00 (Ref)
Overweight 1.27 (1.01–1.60) 0.98 (0.77–1.24) 0.93 (0.73–1.19) 1.32 (1.18-1.47) 1.05 (0.93–1.18) 1.02 (0.90–1.15) 1.14 (1.08–1.19) 0.96 (0.91–1.01) 1.01 (0.95–1.07)
Obese 2.00 (1.54–2.59) 1.96 (1.50–2.57) 1.09 (0.82–1.46) 2.13 (1.90–2.39) 2.06 (1.82–2.34) 1.33 (1.15–1.53) 1.53 (1.44–1.64) 1.40 (1.31–1.50) 1.21 (1.13–1.31)
Self-perceived general health
Good 1.00 (Ref) 1.00 (Ref) 1.00 (Ref) 1.00 (Ref) 1.00 (Ref) 1.00 (Ref) 1.00 (Ref) 1.00 (Ref) 1.00 (Ref)
Fair 16.10 (13.14–19.74) 9.62 (7.76–11.9) 4.01 (3.17–5.07) 9.42 (8.30–10.68) 6.14 (5.36–7.04) 2.93 (2.53–3.40) 3.41 (3.12–3.71) 2.68 (2.44–2.94) 1.69 (1.52–1.87)
Poor 173.62
(131.35–229.50)
109.37 (81.57–146.64)
26.44
(18.93–36.94)
67.16 (54.62–82.59)
45.77 (36.62–57.20)
13.64 (10.75–17.31) 10.90 (9.04–13.13)
8.55 (7.04–10.4) 3.99 (3.24–4.91)
Self-perceived mental health
Not Good vs. Good 6.21 (4.55–8.48) 8.32 (6.03–11.5) 1.32 (0.91–1.90) 4.20 (3.57–4.94) 5.31 (4.46–6.32) 1.22 (1.00–1.49) 2.27 (2.03–2.55) 2.52 (2.23–2.83) 1.23 (1.08–1.40)
Consulted mental health professional
Yes vs. No 3.19 (2.37–4.29) 6.91 (5.07–9.42) 2.43 (1.72–3.44) 2.67 (2.33–3.05) 4.81 (4.15–5.58) 2.00 (1.69–2.37) 2.14 (1.98–2.32) 2.74 (2.52–2.97) 1.67 (1.52–1.83)
Health behavior
Life stress
High vs. Low 1.18 (0.93–1.51) 2.47 (1.90–3.20) 1.01 (0.78–1.29) 1.09 (0.98–1.21) 1.92 (1.71–2.16) 1.08 (0.95–1.23) 1.04 (0.98–1.10) 1.31 (1.24–1.39) 1.06 (0.99–1.13)
BMC
Health
Services
Research
2014,
14
:532
Page
9
o
f
1
3
ntral.com/1
[image:9.794.66.700.81.541.2]Table 4 Weighted unadjusted, age-adjusted and adjusted odds ratios (and corresponding 95% confidence intervals) according to multinomial logistic analysis(Continued)
Smoking status
Non-smoker 1.00 (Ref) 1.00 (Ref) 1.00 (Ref) 1.00 (Ref) 1.00 (Ref) 1.00 (Ref) 1.00 (Ref) 1.00 (Ref) 1.00 (Ref)
Former (Daily) 2.74 (2.18–3.44) 1.57 (1.24–2.00) 1.35 (1.07–1.70) 2.38 (2.14–2.65) 1.48 (1.32–1.66) 1.38 (1.23–1.55) 1.52 (1.43–1.60) 1.12 (1.05–1.19) 1.15 (1.08–1.22)
Light smoker 0.66 (0.50–0.87) 1.28 (0.95–1.73) 0.91 (0.66–1.25) 0.76 (0.66–0.87) 1.24 (1.07–1.44) 1.03 (0.88–1.21) 0.79 (0.74–0.85) 0.97 (0.91–1.04) 0.99 (0.91–1.07)
Heavy smoker 1.67 (1.15–2.43) 2.66 (1.80–3.95) 1.19 (0.77–1.86) 1.39 (1.18–1.65) 1.95 (1.63–2.34) 1.19 (0.97–1.46) 0.83 (0.75–0.90) 0.89 (0.81–0.98) 0.87 (0.78–0.96)
Physical activity
Active vs. inactive 0.39 (0.32–0.48) 0.46 (0.37–0.57) 0.74 (0.59–0.93) 0.57 (0.52–0.64) 0.65 (0.58–0.72) 0.92 (0.82–1.04) 0.78 (0.75–0.82) 0.83 (0.79–0.87) 0.95 (0.90–1.01)
Alcohol consumption (past 12 months)
Non-Drinker vs. Current drinker
4.02 (3.26–4.96) 2.80 (2.24–3.50) 1.57 (1.26–1.97) 2.97 (2.68–3.29) 2.21 (1.98–2.47) 1.46 (1.28–1.66) 1.68 (1.58–1.79) 1.46 (1.37–1.56) 1.12 (1.04–1.21)
*Referent group: Bottom 50% of users.‡Other: divorced, separated, widowed or single (never married); Married includes common-law.
Rosella
et
al.
BMC
Health
Services
Research
2014,
14
:532
Page
10
of
13
http://ww
w.biomedce
ntral.com/1
In the descriptive and unadjusted multinomial analyses, our study found gradients existed across multiple dimen-sions of SES and were strongly and significantly associated with increased health care costs. However, adjusting for confounders resulted in mostly non-significant associa-tions and the attenuation of the incremental relaassocia-tionship seen with household income. This demonstrates the im-portance of controlling for confounders when interpreting associations with HCU–as opposed to simply looking at descriptive characteristics, as often done in HCU studies. Unlike previous studies, which have typically described health care utilization as a binary outcome (i.e. HCU vs. non-HCU), we were able to further dissect gradients of use by applying a multinomial model. These results sug-gest that the HCU population is not homogenous and the finer separation is important to further understanding the associations. For instance, the associations among the extreme HCU (top 1%) are significantly stronger than, and in some cases differ from, that of the Top 2-5% HCU.
This current study is particularly novel in that we have investigated the effects of heath behaviors and health status in addition to multiple socio-demographics mea-sures. We confirmed health status, primarily ADG score, and increased age to be strongly associated with increas-ing levels of health care utilization. What is unique compared to other studies is that we were able to dem-onstrate the significance of this association across self-reported indicators of health status, in addition to those identified through medical claims. Findings related to self-reported health (physical and mental) provide an teresting perspective on the self-perceptions of those in-dividuals who are in the highest HCU group compared to those in the lowest. The strong associations seen, even after adjustment for multiple co-morbidities, dem-onstrate that every incremental utilization group above the bottom 50th percentile were more likely to classify their health as poor. These findings were particularly evident for self-reported general health, which demon-strated a stronger magnitude of effect than even the clinically-derived ADG score. The research on the pa-tient perspective of HCU is very limited and would be an important area of further study and may have useful implications for HCU intervention and policy.
This study uniquely enhances our understanding of HCU through the investigation of health behaviors. Behavioral factors, such as physical activity, may be more amenable to change than others, particularly SES, and thus, more likely to have implications for interven-tions or policies targeted at enabling healthy choices. We did not find that established risky health behaviors, such as smoking and alcohol consumption [25], to be overwhelming drivers of short term HCU gradients. This finding, however, is likely an artifact of the short-term follow-up period. It is reasonable that as an individual’s
health declines, medical contraindications and healthy living recommendations would affect health behavior choices. For example, HCU may be more likely to quit smoking or drinking alcohol upon recommendation by their doctor or due to contraindications of ongoing treatment. This could explain why HCU was associated with former smoker and current non-drinker status in our study. A longer follow-up examining trajectories of health care utilization is necessary to further study the health effects of such behaviors.
Limitations
This study is strengthened by the novel use of a large, linked population survey sample to more broadly characterize the non-institutionalized, community-dwelling HCU population and the use of a multinomial analysis to further dissect trends across HCU groups. However, there are some limitations that must be mentioned. Particularly, the CCHS sampling frame excludes the institutionalized, persons living on Aboriginal reserves, full-time mem-bers of the Canadian Forces and persons living in cer-tain remote areas (approximately 2% of the Canadian population) [20]. As a result, Ontarians not living in private dwellings, individuals residing in LTC or com-plex continuing care facilities, mental health institutions or hospitals at the time of interview are excluded from these analyses. It is expected that a number of Ontario’s HCU reside in these facilities, and would not be repre-sented by the CCHS. Indeed, long-term care (LTC) spending accounted for less than 5% of HCU spending in our analysis, and provincial estimates suggest this proportion to be much higher [1,26]. This would affect external generalizability to the broader Ontario popula-tion, but not the internal validity since we ranked within the CCHS population and not within the entire popula-tion so relative cost categories are accurate within the study population. Similarly, homeless Ontarians would have been excluded from the CCHS. Given the relation-ship between SES and HCU, it is likely that a portion of HCU in Ontario are homeless and are not represented in the current study. While individuals residing within these institutions or who were homeless at baseline would not be captured by the CCHS, all CCHS respon-dents who transferred into these facilities or became homeless following CCHS interview would be captured, and thus, their health care costs also captured in this study [21].
provided a valid health card number; however, among Ontarian respondents who were hospitalized, over 91% of respondents agreed to linkage and provided a valid health card number [27]. Therefore, use of the Ontario linked CCHS cohort for health services research shows acceptable coverage, but this potential for bias should be considered when interpreting estimates from the CCHS linked file. Also, because the CCHS relies on self-reported data there is potential for reporting bias, such as recall or social desirability bias. Additionally, because not every question is asked in each CCHS cycle and certain questions are only asked in select provinces, we were limited in which variables to include. For instance, the Health Utilities Index (HUI®), a health status variable incorporating both qualitative and quantitative features to provide a summary measure of individual health, was not available for all three cycles and therefore could not be included, despite its relevance [28].
Furthermore, the time frame of the study is such that we characterize patients as HCU in the year following interview, although the nature of them being high-users may have influenced some of the self-reported informa-tion, i.e. reverse causality [29]. This may explain why a weak association between HCU and health behavior was noted in this study. However, the purpose of this study is to more fully characterize this population, and not to infer causality, so this is only a minor limitation to our study design.
Lastly, the health care expenditures included in this analysis are limited to only those covered by Ontario’s universal health insurance plan, OHIP. Except for eligible members of the adult population (e.g. those over 65, receiving government assistance or with spe-cific diseases) OHIP coverage excludes prescription drug costs (outside of those received in hospital), allied health services (physiotherapy, registered massage ther-apy, etc.), dental care, eye care, and assistive devices (e.g. crutches, splints, and casts). However, compared to costs associated with acute hospital care and phys-ician services, these represent a relatively smaller pro-portion of health care spending.
Conclusion
This study has corroborated the findings of previous research, and has provided new information towards understanding a broad range of characteristics associ-ated with increased health care costs that have not been well characterized in the literature. We found that community-dwelling HCU tended to be older with multiple comorbidities and were also more likely to be white, female, and have lower household income. We also showed the importance of self-rated health, both mental and general, and the presence of self-reported chronic conditions. The findings of this study may help
guide future work to identify populations at risk of be-coming HCU and provides information that would allow for policies or interventions to be better informed by the economic, social, health status and behavioral profile of community-dwelling HCU. Further research looking at the trajectory of HCU over time will allow for a better understanding of the upstream determinants of health care utilization. This and future research will aid in identifying modifiable and addressable factors associated with becoming a HCU, and thus will assist efforts to identify populations at-risk of becoming HCU. Under-standing the broader determinants of HCU is crucial to informing policy decisions addressing the common medical and public health goal of improving population health, and reaching the health care targets of sustain-ability, better quality of care, and improved patient outcomes.
Abbreviations
HCU:High-cost user(s); CCHS: Canadian Community Health Survey; ADG: Aggregated Diagnosis Groups.
Competing interests
The authors declare that they have no competing interests.
Authors’contributions
LR and VG conceived of the study. LR guided the study design and analysis and helped draft the manuscript. AC carried out all analyses. LR and TF interpreted the results. TF contributed to the analysis and drafted the manuscript. WP, VG and HM contributed expert advice, provided feedback on the study design, interpretation and critically revised the manuscript. All authors read and approved the final manuscript.
Acknowledgements
Financial support for this study was provided by Public Health Ontario through an annual peer-reviewed competitive Project Initiation Fund (PIF) (2013-14-006). This study was also supported by the Institute for Clinical Evaluative Sciences (ICES), which is funded by an annual grant from the Ontario Ministry of Health and Long-Term Care (MOHLTC).
These datasets were linked using unique encoded identifiers and analyzed at the Institute for Clinical Evaluative Sciences (ICES). The opinions, results and conclusions reported in this paper are those of the authors and are independent from the funding sources. No endorsement by ICES or the Ontario MOHLTC is intended or should be inferred.
Author details
1Dalla Lana School of Public Health, University of Toronto, 155 College Street, Suite 600, Toronto, ON M5T 3M7, Canada.2Institute for Clinical Evaluative Sciences, Room 424, 155 College Street, Toronto, ON M5T 3M6, Canada. 3Public Health Ontario, 480 University Avenue, Suite 300, Toronto, ON M5G 1V2, Canada.4Institute of Health Management Policy and Evaluation, University of Toronto, Suite 425, 155 College Street, Toronto, ON M5T 3M7, Canada.5Toronto Rehabilitation Institute, 550 University Avenue, Toronto, ON M5G 2A2, Canada.
Received: 25 March 2014 Accepted: 17 October 2014
References
1. Wodchis WP:The Concentration of Health Care Spending: Little Ado (yet) About Much (money). Presented at the Canadian Association for Health
Services and Policy Research (CASHPR) 2012 Conference. http://www.
longwoods.com/blog/the-concentration-of-health-care-spending-little-ado-yet-about-much-money/ Accessed: Oct 23, 2014
Rosellaet al. BMC Health Services Research2014,14:532 Page 12 of 13
2. Lemstra M, Mackenbach J, Neudorf C, Nannapaneni U:High Health Care Utilization and Costs Associated with Lower Socio-Economic Status: results from a Linked Dataset.Can J Public Health2009,100:180–183. 3. Kephart G, Thomas V, MacLean D:Socioeconomic differences in the use of
physician services in Nova Scotia.Am J Public Health1998,88:800–803. 4. Calver J, Brameld K, Preen D, Alexia SJ, Boldy DP, McCaul KA:High-cost
users of hospital beds in Western Australia: a population-based record linkage study.Med J Aust2006,184:393–397.
5. Deber, RB and Lam KCK.Handling the High Spenders: Implications of the Distribution of Health Expenditures for Financing Health Care. APSA 2009
Toronto Meeting Paper.http://ssrn.com/abstract=1450788 Accessed Oct 23,
2014.
6. Berk ML, Monheit A:The concentration of health expenditures: an update.Health Aff (Millwood)1992,11:145–149.
7. Berk ML, Monheit A:The concentration of health care expenditures, revisited.Health Aff (Millwood)2001,20:9–18.
8. Conwell LJ, Cohen J. Characteristics of Persons with High Medical Expenditures in the U.S. Civilian Noninstitutionalized Population, 2002. AHRQ, 2005
9. Heslop L, Athan D, Gardner B, Diers D, Poh BC:An analysis of high-cost users at an Australian public health service organization.Health Serv
Manage Res2005,18:232–243.
10. Radcliff TA, Cote M, Duncan R:The identification of high-cost patients.
Hosp Top2005,83:17–24.
11. Roos NP, Burchill C, Carriere K:Who are the high hospital users? A Canadian case study.J Health Serv Res Policy2013,8:5–10.
12. Reid R, Evan R, Barer M, Sheps S, Kerluke K, McGrail K, Hertzman C, Pagliccia N: Conspicuous consumption: characterizing high users of physician services in one Canadian province.J Health Serv Res Policy2003,8:215–224. 13. Rais S, Nazerian A, Ardal S, Chechulin Y, Bains N, Malikov K:High-cost users
of Ontario’s Healthcare services.Healthc Policy2013,9:44–51.
14. Droomers M, Westert G:Do lower socioeconomic groups use more health services, because they suffer from more illnesses?Eur J Public Health 2004,14:311–313.
15. Dunlop S, Coyte P, McIssac W:Socio-economic status and the utilisation of physicians’services: results from the Canadian National Population Health Survey.Soc Sci Med2000,51:123–133.
16. Naessens JM, Baird M, Van Houten H, Vanness DJ, Campbell CR:Predicting persistently high primary care use.Ann Fam Med2005,3:324–330. 17. Wodchis WP, Coralio A, Ma X, Simeonov D, Stamplecoski M, White P, Purdy I,
Jeffs L, Iron K, de Nobrega P, McGillis Hall L:Health Outcomes for Better
Information and Care (HOBIC): Acute Care in Ontario 2012, ICES Investigative
Report. Toronto: The Institute for Clinical Evaluative Sciences (ICES); 2013. 18. Billings J, Mijanovich T:Improving the management of care for high-cost
medicaid patients.Health Aff (Millwood)2007,26:1643–1654. 19. Morgan MW, Zamora N, Hindmarsh M:An inconvenient truth: a
sustainable healthcare system requires chronic disease prevention and management transformation.Healthc Pap2007,7:6–23.
20. Statistics Canada. Canadian Community Health Survey - Annual Component (CCHS). www23.statcan.gc.ca/imdb/p2SV.pl?Function=getSurvey&SDD-S=3226&Item_Id=144171&lang=en. Accessed: Nov 29, 2013
21. Wodchis WP, Bushmeneva K, Nikitovic M, McKillop I:Guidelines on Person-level Costing Using Administrative Databases in Ontario. Working Paper Series.
Vol 1.Toronto: Health System Performance Research Network; 2013.
22. Austin PC, van Walraven C, Wodchis WP, Newman A, Anderson GM:Using the Johns Hopkins Aggregated Diagnosis Groups (ADGs) to predict mortality in a general adult population cohort in Ontario, Canada.Med Care2011,49(10):932–939.
23. Brant R:Assessing proportionality in the proportional odds model for ordinal logistic regression.Biometrics1990,46(4):1171–1178. 24. Thomas S, Wannell B:Combining cycles of the Canadian Community
Health Survey.Stat Can Health Rep2009,20(1):55–60.
25. Manuel DG, Perez R, Bennett C, Rosella L, Taljaard M, Roberts M, Sanderson R, Meltem T, Tanuseputro P, Manson H:Seven More Years: The Impact of Smoking, Alcohol, Diet, Physical Activity and Stress on Health and Life Expectancy in
Ontario. An ICES/ PHO Report.Toronto: Institute for Clinical Evaluative Sciences
and Public Health Ontario Report; 2012.
26. Wodchis, WP. Driving Value with a Patient-Centered Health System. Presented at: OACCAC Knowledge and Inspiration 2012 Conference. http://www.crncc.ca/knowledge/events/pdf-healthyconnections2013/Wodchis.pdf Accessed: Aug 5, 2013
27. Rotermann M, Nadeau C:Evaluation of the coverage of the linked Canadian Community Health Survey and hospital inpatient records.
Health Rep2009,20(1):45–51.
28. Horsman J, Furlong W, Feeny D, Torrance G:The Health Utilities Index (HUI®): concepts, measurement properties and applications.Health Qual
Life Outcomes2003,1:54.
29. Lawlor DA, Hart CL, Hole DJ, Smith GD:Reverse causality and confounding and the Associations of Overweight and Obesity with Mortality.Obesity 2012,14(12):2294–2304.
doi:10.1186/s12913-014-0532-2
Cite this article as:Rosellaet al.:High-cost health care users in Ontario, Canada: demographic, socio-economic, and health status characteristics.
BMC Health Services Research201414:532.
Submit your next manuscript to BioMed Central and take full advantage of:
• Convenient online submission
• Thorough peer review
• No space constraints or color figure charges
• Immediate publication on acceptance
• Inclusion in PubMed, CAS, Scopus and Google Scholar
• Research which is freely available for redistribution