M E T H O D O L O G Y
Open Access
Multiplex serum biomarker assessments: technical
and biostatistical issues
Lisa H Butterfield
1,2,3,4,5*, Douglas M Potter
1,2,6and John M Kirkwood
1,2,3†Abstract
Background:Identification of predictive and prognostic biomarkers for patients with disease and undergoing different therapeutic options is a very active area of investigation. Many of these studies seek biomarkers among circulating proteins accessed in blood. Many levels of standardization in materials and procedures have been identified which can impact the resulting data.
Methods:Here, we have observed unexpected variability in levels of commonly tested analytes in serum which were processed and stored under standardized conditions. We have identified apparent changes in cytokine, chemokine and growth factor levels detected by multiplex Luminex assay in melanoma patient and healthy donor serum samples, over storage time at -80°C. Controls included Luminex kit standards, multiplexed cytokine standards and WHO cytokine controls. Data were analyzed by Wilcoxon rank-sum testing and Spearman’s test for correlations. Results:The interpretation of these changes is confounded by lot-to-lot kit standard curve reagent changes made by a single manufacturer of Luminex kits.
Conclusions:This study identifies previously unknown sources of variation in a commonly used biomarker assay, and suggests additional levels of controls needed for identification of true changes in circulating protein levels.
Keywords:serum, biomarkers, melanoma, cytokine, Luminex
Background
To improve the clinical efficacy of immunotherapies and our ability to stratify patients rationally for therapeutic intervention, biomarkers are critical to progress. The FDA’s Critical Path prioritizes development of biomar-kers, including a focus on aspects of: Biospecimens, Analytical Performance, Standardization and Harmoni-zation and Bioinformatics. Accurate biomarkers offer the prospect for earlier diagnosis, improved precision of application of expensive and toxic therapies on the opti-mal patient populations, monitoring disease progression and therapeutic benefits as well as accelerating drug development and discovery. Guidelines for incorporation of biomarker studies in early clinical trials of novel agents have been published [1].
There is a critical need for development and validation of biomarkers to identify patients who can benefit from
a particular form of immunotherapy. Only a fraction of patients benefit from IFN-atreatment [2], only a frac-tion of patients can achieve durable regressions in response to antigen vaccination [3], or antibody thera-pies, and we do not yet know the mechanisms responsi-ble for therapeutic benefit. Despite substantial efforts from many groups, we do not know which parameters of immune response (and which assays used to assess these parameters) yield optimal results for efficacy ana-lysis [4-7]. A major reason for this has been that objec-tive clinical response rates are often below 10%, confounding the measurement of significant correlations between biomarkers and clinical responses in studies of modest size. Another important issue is that assay results may depend on biological specimen handling before assessment, and on methodological differences in complex, high throughput assays.
A number of studies in melanoma have identified can-didate biomarkers of response to therapy. These range from circulating cytokines and growth factors [8,9], gene expression profiles in tumors [10], circulating tumor
* Correspondence: butterfieldl@upmc.edu
†Contributed equally
1
University of Pittsburgh Cancer Institute, 5117 Centre Avenue, suite 1.27, Pittsburgh, PA 15213, USA
Full list of author information is available at the end of the article
cells [11], serum autoantibody profiling [12] and tumor specific T cell IFN-gproduction [13] to molecular sig-naling pathways in tumors [14] and the nature of tumor infiltrating cells [15]. The vast majority of candidate bio-markers have not yet achieved routine clinical use due to lack of reproducibility, need for new technology and equipment, need for high quality tumor samples or high cost. The relative ease of collecting, processing, storing and shipping blood has made it a common resource for biomarker testing.
Several reports have identified phenotypic and func-tional changes in blood cells and serum components when the blood is held for hours or days and at differ-ent temperatures before processing [16-18]. These time-dependent and temperature-time-dependent effects should be controlled for to the extent possible before blood pro-cessing. Standardized processing procedures by trained and competency-tested personnel can also improve immunologic assay data consistency [19]. In addition, use of freezers for sample storage that are monitored for temperature stability and that have 24 hours-a-day alarm response eliminates concerns that samples might undergo freeze-thaw cycles or be otherwise compro-mised by temperature changes during storage. Many of these central laboratory procedures for processing, sto-rage and equipment maintenance are mandated by accreditation groups such as CLIA and FACT, and are described in resources from CLSI [20-22].
During an investigation of biomarkers of prolonged survival after IFN-a treatment in banked melanoma patient serum samples, we discovered a number of both technical and biostatistical analysis issues [23]. Our pre-liminary results identified a large number of serum cyto-kines that appeared to correlate significantly with survival. However, further dissection of the data revealed a number of technical issues that made interpretation of the data impossible.
Here, we have performed a time course analysis of cytokines, chemokines and growth factors measured in the banked serum of healthy donors and melanoma patients stored for various intervals, and analyzed by multiplex Luminex assay. We find that a number of these analytes appear to be unstable during storage. We have also tested several aspects of the Luminex assay performance and identified a number of concerns with these multiplexed assays. Biostatistical tests indicate that despite several layers of procedural standardization and levels of controls, reliable multiplexed cytokine and che-mokine determinations may be compromised by length of time in storage and/or by the changes regularly made by assay kit manufacturers to different lots and the ana-lyte standards included. These results raise concerns about serum biomarker studies and suggest that addi-tional controls may be required to confidently compare
levels over time and between lots of reagents from the same manufacturer.
Methods Study subjects
All serum samples were obtained after written informed consent, and under IRB approved protocols of investiga-tion at the University of Pittsburgh. The samples received in 2005 were obtained from 23 patients at two clinical sites (Pennsylvania and Indiana). The UPCI #96-099 banking protocol was utilized for the five 2010 mel-anoma patient sera tested. The UPCI #04-001 healthy donor blood collection protocol was used for the blood obtained from 10 healthy donors in 2010.
Blood processing and banking
For serum collection, red top vaccutainer tubes (no anticoagulant) provided by our laboratory (Becton Dick-inson #6430) in kits were used. Upon arrival in the lab, the samples are checked for proper identification, given accession numbers, and either processed immediately or (if received after 4 pm) put in the refrigerator (at 4°C) for processing the next morning. All samples were pro-cessed within 24 hours, including those drawn at exter-nal sites and shipped at ambient temperature overnight in insulated shipping containers. All processing was per-formed by technologists who received the same training, and the laboratory SOP #0108 was followed. Technolo-gists also undergo annual competency training. Samples were centrifuged for 10 min at 2, 500 rpm in a refriger-ated centrifuge at 4°C, then the serum was aliquoted into polypropylene freezer vials at 1.1 mL per vial and immediately placed in a -80°C freezer. All samples were stored in a monitored freezer until testing, freezer tem-peratures did not fluctuate above -55°C (during brief periods of high use). Samples were thawed before testing and repeated testing was performed on separate aliquots to eliminate variability from freeze-thaw cycles. The laboratory is certified under the Pennsylvania Depart-ment of Health, College of American Pathologists (CAP) and Clinical Laboratory Improvement Amendments (CLIA for Histocompatibility and General Immunology). The laboratory is registered with the FDA, and main-tains a facilities master file (BB-MF-12244). The exploratory Luminex assay reported here is not used for clinical decision making, and is not a CLIA-certified assay.
Luminex assay and controls
refrigerator overnight (healthy donor controls, < 12 hours total time) or at room temperature the day of the assay (patient samples), clarified in a microfuge for 10 min at 1, 000 g, then diluted with the assay diluent pro-vided per assay manufacturer’s instructions. Healthy donor and control samples were run in duplicate, but large numbers of patient sera were run in singlets. The same trained technologist performed all of the assays reported herein, according to the same laboratory SOP #0037). The software used for all assays was the BioPlex System BioPlex Manager 4.0, which uses 5-parameter logistic regression. Each sample acquired ≥ 100 bead events, per manufacturers’instructions. Analytical sensi-tivity was calculated based on two standard deviations from the background MFI of the standard curve. There were no changes in the antibodies used for the analytes of interest reported here, and the standards were bench-marked in the same way over the time period tested here. R&D QC controls (R&D Systems QC02) are reconstituted with assay diluent from the Hu Extracellu-lar buffer kit LHB0001 (BioSource). Each lot provides expected values for several commonly tested cytokines (as measured by R&D Systems ELISA assays). Additional kit details are presented in Additional File 1, Table S1.
To address potential inter-analysis variability, 770 data points from 2005 and 430 data points from 2010 were re-analyzed at the same time (2011) with version 6.0 software, on the original machine. There were 0/1, 200 changes in the resulting absolute values obtained.
WHO cytokine standards
WHO cytokine standards were resuspended as follows: 117187 GM-CSF WHO 88/646 10, 000 IU: contents of the ampoule were dissolved with 0.5 mL sterile distilled water and brought up to 1 mL with PBS. Further 1:10 dilution was performed with AIM V (Invitrogen) med-ium. 117173 IL-4 WHO 88/656 0.1μg = 1, 000 arbitrary units per ampoule: contents of the ampule were resus-pended with PBS/1% BSA, and the 1:10 dilution was performed with AIM V. 117184 IL-10 WHO 92/516 1
μg = 5, 000 RU per ampoule: contents of the ampoule were dissolved with 0.5 mL sterile distilled water and then brought up to 1 mL with PBS. Further 1:10 dilu-tion was performed with AIM V. 117177 IL-8 WHO 89/ 520 1μg = 1, 000 RU per ampoule = 1, 000, 000 pg/mL: contents of the ampoule were resuspended with PBS/1% BSA and the 1:10 dilution was performed with AIM V. To assay the WHO standards, each was diluted 1:10 (20
μL WHO standard dilution (above) + 180μL assay dilu-ent) and 1:50 (10 μL WHO + 490 μL assay diluent). The dilutions were treated as samples in the assay, such that the final dilutions were 1:20 and 1:100, relative to the Luminex kit standard curve (the assayed well con-tains 50μL of the dilution + 50μL of assay diluent).
Biostatistical Methods
Analyte concentrations were compared at two time points with a one-sample Wilcoxon rank-sum test on the ratio of the two concentrations. Correlation was assessed with Spearman’s test. All p-values are two-sided. Assay results below the lower limit of detection or above the upper limit of quantitation were not used in the analysis.
Results and Discussion
During the analysis of a retrospective biomarker study conducted with a set of banked sera from melanoma patients [23], we discovered a potential correlation between the levels of analytes measured by Luminex and the time that the sera were stored at -80°C. There-fore, we examined several aspects of serum storage and the Luminex assay.
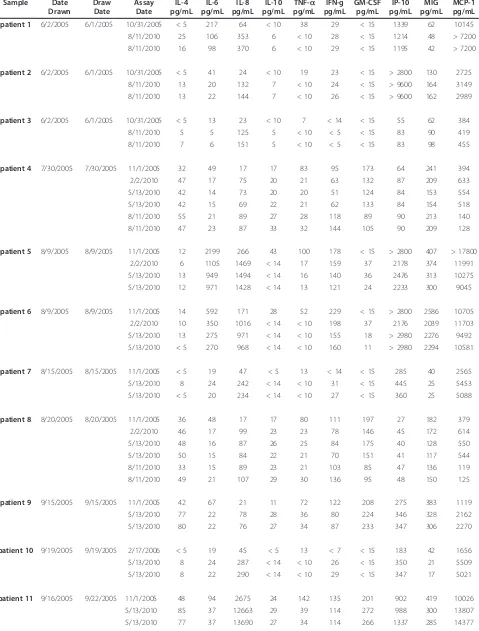
Repeat testing in 2010 of sera stored in 2005
Our first sample set consisted of 23 melanoma patient sera (the“old patients”) who had a blood sample drawn in 2005, and had a Luminex assay performed on serum samples, on either 10/31/2005, 11/01/2005 or 2/17/2006; we refer to these as the“early”assays. To determine any changes over storage time, we thawed aliquots (not pre-viously thawed) and tested a subset of the analytes origin-ally tested, again by Luminex (Table 1). Unexpectedly, we identified a number of apparent changes in analyte levels. We repeated these measurements up to three times (depending on the number of previously untouched ali-quots remaining) for these 23 samples: (2/02/10, 5/13/ 2010 and 8/11/2010)–the“late”assays. Seven of the 10 analytes we examined had highly significant changes dur-ing the approximately 5 years of storage at -80°C.
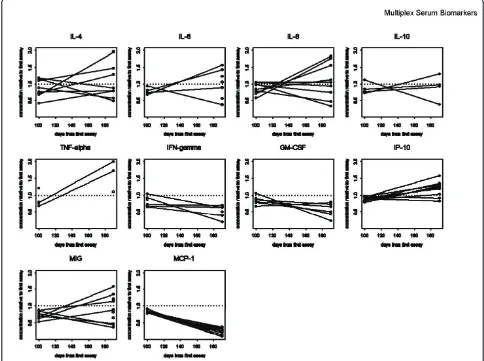
There were different patterns seen for different groups of analytes, some of which were relatively stable over time (IL-4, change over time: p = 0.28) while others were found to change (IL-10, p = 0.093; GM-CSF, p = 0.11). Levels of some of the analytes decreased over the storage time (IL-6, p = 0.00021; decreasing in 21/23 samples; TNFa, p = 0.0078, decreasing in 20/23). Surprisingly, the IL-8 levels were significantly increased from the initial test to the subsequent tests 5 years later (IL-8, p = 0.000030, approximately 5-fold increased in 23/23 patient samples). MCP-1 levels also increased in a majority of samples (MCP-1, p = 0.00012) (Table 1/Figure 1). Each p-value was computed with a one-sample Wilcoxon test on the ratio of the 5/13/2010 assay result (for which we had the most data) to the result of the early assay.
Healthy donor and melanoma patient serum time course in 2010
Table 1 Old patient Serum Samples Sample Date
Drawn
Draw Date
Assay Date
IL-4 pg/mL
IL-6 pg/mL
IL-8 pg/mL
IL-10 pg/mL
TNF-a pg/mL
IFN-g pg/mL
GM-CSF pg/mL
IP-10 pg/mL
MIG pg/mL
MCP-1 pg/mL
patient 1 6/2/2005 6/1/2005 10/31/2005 < 5 217 64 < 10 38 29 < 15 1339 62 10145
8/11/2010 25 106 353 6 < 10 28 < 15 1214 48 > 7200
8/11/2010 16 98 370 6 < 10 29 < 15 1195 42 > 7200
patient 2 6/2/2005 6/1/2005 10/31/2005 < 5 41 24 < 10 19 23 < 15 > 2800 130 2725
8/11/2010 13 20 132 7 < 10 24 < 15 > 9600 164 3149
8/11/2010 13 22 144 7 < 10 26 < 15 > 9600 162 2989
patient 3 6/2/2005 6/1/2005 10/31/2005 < 5 13 23 < 10 7 < 14 < 15 55 62 384
8/11/2010 5 5 125 5 < 10 < 5 < 15 83 90 419
8/11/2010 7 6 151 5 < 10 < 5 < 15 83 98 455
patient 4 7/30/2005 7/30/2005 11/1/2005 32 49 17 17 83 95 173 64 241 394
2/2/2010 47 17 75 20 21 63 132 87 209 633
5/13/2010 42 14 73 20 20 51 124 84 153 554
5/13/2010 42 15 69 22 21 62 133 84 154 518
8/11/2010 55 21 89 27 28 118 89 90 213 140
8/11/2010 47 23 87 33 32 144 105 90 209 128
patient 5 8/9/2005 8/9/2005 11/1/2005 12 2199 266 43 100 178 < 15 > 2800 407 > 17800
2/2/2010 6 1105 1469 < 14 17 159 37 2178 374 11991
5/13/2010 13 949 1494 < 14 16 140 36 2476 313 10275
5/13/2010 12 971 1428 < 14 13 121 24 2233 300 9045
patient 6 8/9/2005 8/9/2005 11/1/2005 14 592 171 28 52 229 < 15 > 2800 2586 10705
2/2/2010 10 350 1016 < 14 < 10 198 37 2176 2039 11703
5/13/2010 13 275 971 < 14 < 10 155 18 > 2980 2276 9492
5/13/2010 < 5 270 968 < 14 < 10 160 11 > 2980 2294 10581
patient 7 8/15/2005 8/15/2005 11/1/2005 < 5 19 47 < 5 13 < 14 < 15 285 40 2565
5/13/2010 8 24 242 < 14 < 10 31 < 15 445 25 5453
5/13/2010 < 5 20 234 < 14 < 10 27 < 15 360 25 5088
patient 8 8/20/2005 8/20/2005 11/1/2005 36 48 17 17 80 111 197 27 182 379
2/2/2010 46 17 99 23 23 78 146 45 172 614
5/13/2010 48 16 87 26 25 84 175 40 128 550
5/13/2010 50 15 84 22 21 70 151 41 117 544
8/11/2010 33 15 89 23 21 103 85 47 136 119
8/11/2010 49 21 107 29 30 136 95 48 150 125
patient 9 9/15/2005 9/15/2005 11/1/2005 42 67 21 11 72 122 208 275 383 1119
5/13/2010 77 22 78 28 36 80 224 346 328 2162
5/13/2010 80 22 76 27 34 87 233 347 306 2270
patient 10 9/19/2005 9/19/2005 2/17/2006 < 5 19 45 < 5 13 < 7 < 15 183 42 1656
5/13/2010 8 24 287 < 14 < 10 26 < 15 350 21 5509
5/13/2010 8 22 290 < 14 < 10 29 < 15 347 17 5021
patient 11 9/16/2005 9/22/2005 11/1/2005 48 94 2675 24 142 135 201 902 419 10026
5/13/2010 85 37 12663 29 39 114 272 988 300 13807
Table 1 Old patient Serum Samples(Continued)
8/11/2010 93 41 14814 26 59 72 219 716 340 > 7200
8/11/2010 110 48 12823 30 58 80 238 793 364 > 7200
patient 12 9/28/2005 9/28/2005 2/17/2006 62 92 27 39 82 183 328 51 270 436
2/2/2010 46 22 92 36 20 118 222 88 200 909
5/13/2010 43 18 75 35 20 109 221 76 125 741
5/13/2010 34 18 88 35 22 124 208 78 165 755
patient 13 10/6/2005 10/5/2005 11/1/2005 28 67 51 8 80 77 131 877 326 6818
8/11/2010 83 42 342 29 55 64 225 725 332 > 7200
8/11/2010 116 44 335 33 72 79 228 802 356 7345
patient 14 10/7/2005 10/6/2005 11/1/2005 42 67 24 18 66 122 156 353 711 1266
8/11/2010 89 39 118 35 66 59 237 314 906 1088
8/11/2010 70 35 114 30 53 52 189 328 891 1057
patient 15 10/12/2005 — 2/17/2006 51 76 26 32 86 180 276 63 257 395
2/2/2010 38 21 113 48 23 146 255 107 245 801
5/13/2010 35 17 95 44 23 116 205 89 170 601
5/13/2010 28 15 100 42 20 107 224 82 168 576
patient 16 10/17/2005 — 2/17/2006 < 5 54 60 < 5 34 < 7 < 15 434 55 3950
5/13/2010 5 41 368 < 14 < 10 39 < 15 780 25 10159
5/13/2010 11 43 373 < 14 < 10 39 < 15 846 23 10552
8/11/2010 21 52 402 6 < 10 6 15 464 35 4616
8/11/2010 8 29 391 < 5 < 10 < 5 < 15 465 35 4777
patient 17 11/3/2005 11/3/2005 2/17/2006 23 52 11 < 5 49 75 111 155 283 686
5/13/2010 72 23 57 24 31 67 221 198 288 1734
5/13/2010 17 9 27 < 14 < 10 14 53 186 218 1706
8/11/2010 90 36 63 28 60 67 222 203 370 757
8/11/2010 85 30 60 24 52 56 213 202 325 705
patient 18 11/16/2005 – 2/17/2006 7 18 14 < 5 20 29 44 41 79 327
2/2/2010 16 15 74 < 14 < 10 34 51 59 93 807
5/13/2010 10 12 71 < 14 < 10 20 24 57 50 611
5/13/2010 8 10 72 < 14 < 10 24 30 52 48 617
patient 19 11/16/2005 — 2/17/2006 10 48 18 < 5 41 39 67 144 96 1143
2/2/2010 16 30 116 < 14 < 10 43 75 248 108 2812
5/13/2010 13 22 100 < 14 10 35 67 202 75 2101
5/13/2010 11 24 108 < 14 < 10 38 61 220 67 2304
patient 20 12/8/2005 12/8/2005 2/17/2006 27 31 10 < 5 62 73 149 35 162 452
2/2/2010 49 17 61 24 24 89 146 60 162 1422
5/13/2010 43 12 48 19 24 70 137 52 108 1114
5/13/2010 41 12 50 21 21 77 137 55 106 1234
patient 21 12/12/2005 12/9/2005 2/17/2006 < 5 24 41 < 5 16 < 7 < 15 537 35 1236
5/13/2010 8 22 235 < 14 < 10 29 < 15 682 25 3153
5/13/2010 10 23 233 < 14 < 10 27 < 15 789 25 3457
8/11/2010 14 29 235 11 < 10 7 < 15 518 34 1423
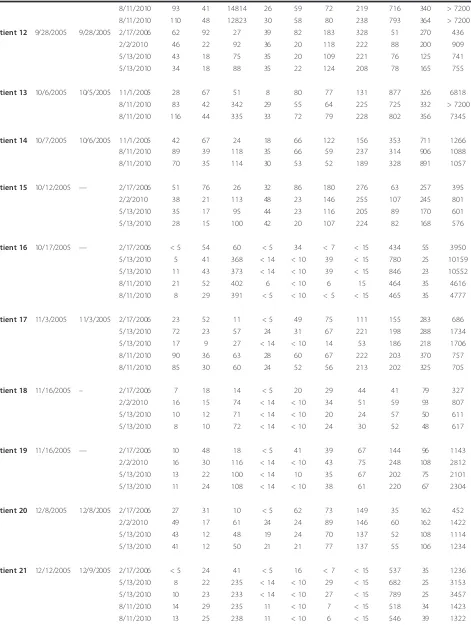
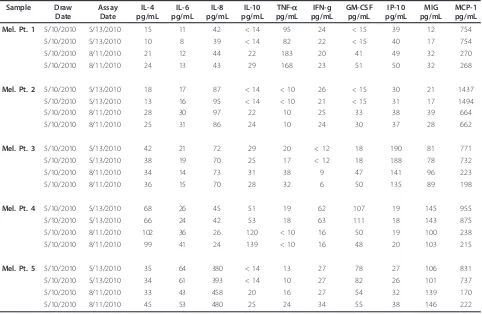
donors (HD, Additional File 2, Table S2, Table 2 data) and 5 melanoma patients ("new patients”) (Additional File 3, Table S3, Table 3 data). HD samples were tested initially 2 months after processing and freezing, and then twice more, at 5 and 8 months of storage on the same dates as the old patient sample described above. The melanoma patient samples were tested 2 days after processing and cryopreservation, and again 3 months later.
As expected, HD samples had low circulating levels of many analytes tested. These HD control samples also showed changes in analyte levels, even after short-term storage. Again, some analytes were stable, others were much less stable. IL-8 increased in 3/10 HD, at the 8
[image:6.595.56.542.101.213.2]month timepoint (n.s.), but not by 5 months. IP-10 also began to increase in 5/10 HD at 8 months (p = 0.01). Several analytes decreased in the relatively short storage time interval, including IFNg (p = 0.06 at 5 mo., p = 0.03 at 8 mo., decreasing in 6/10 HD), and MCP-1, which showed the most dramatic decreases in 10/10 donors, by 8 mo. (p = 0.002). These changes, between the first assay and the second and third assays (100 and 190 days apart), are shown graphically in Figure 2. The melanoma patient samples did not show significant changes within the short storage time, with the excep-tion of MCP-1, which decreased in 5/5 samples within 3 months (p = 0.06). When the ratios of the concentra-tions of the different analytes measured at different Table 1 Old patient Serum Samples(Continued)
patient 22 1/26/2006 1/25/2006 2/17/2006 8 30 4 < 5 24 24 40 706 216 24
8/11/2010 47 22 44 17 45 37 196 332 283 888
8/11/2010 56 26 47 19 53 42 223 318 283 959
patient 23 1/26/2006 1/25/2006 2/17/2006 8 56 68 < 5 75 20 < 15 8705 266 75
8/11/2010 75 3953 534 19 56 50 202 650 339 > 7200
8/11/2010 76 4542 525 19 58 48 210 695 318 > 7200
223
1 10 100 1000 10000 100000
Nov-05 Aug-10 Nov-05 Aug-10 Feb-06 Feb-10 May-10 Feb-06 May-10 Aug-10 Feb-06 May-10 Aug-10 Feb-06 Feb-10 May-10 Feb-06 Feb-10 May-10 Feb-06 Feb-10 May-10 Feb-06 May-10 Aug-10 Feb-06 Aug-10 Feb-06 Aug-10
13 14 15 16 17 18 19 20 21 22 23
IL-8
IL-10
MCP-1
Assay dates and patient codes
pg/ml analyte
[image:6.595.56.540.413.702.2]Table 2 Healthy Donor Sera Analysis
Sample Date
Drawn
Assay Date
IL-4 pg/mL
IL-6 pg/mL
IL-8 pg/mL
IL-10 pg/mL
TNF-a pg/mL
IFN-g pg/mL
GM-CSF pg/mL
IP-10 pg/mL
MIG pg/mL
MCP-1 pg/mL
Healthy donor 1 12/14/2009 2/2/2010 57 43 25 21 16 44 90 28 143 324
2/2/2010 58 48 22 25 16 49 94 30 143 319
5/13/2010 50 39 19 22 13 31 87 25 103 263
5/13/2010 52 29 18 17 11 29 78 25 100 254
8/11/2010 36 42 11 25 < 10 20 40 31 71 30
8/11/2010 29 39 11 20 < 10 16 39 29 64 31
Healthy donor 2 12/16/2009 2/2/2010 57 61 44 41 20 160 179 31 96 632
2/2/2010 59 59 40 42 18 163 151 31 105 589
5/13/2010 44 48 29 31 15 109 129 28 70 529
5/13/2010 41 49 34 33 15 109 128 27 69 521
8/11/2010 82 80 63 37 42 100 84 40 151 160
8/11/2010 67 91 68 39 34 105 81 35 165 138
Healthy donor 3 12/17/2009 2/2/2010 17 < 8 18 < 14 < 10 < 12 < 15 23 20 977
2/2/2010 21 < 8 19 < 14 < 10 < 12 < 15 23 13 921
5/13/2010 22 < 8 21 < 14 < 10 < 12 < 15 22 < 12 803
5/13/2010 20 < 8 18 < 14 < 10 < 12 < 15 23 < 12 763
8/11/2010 24 < 3 18 < 5 < 10 < 5 < 15 19 11 241
8/11/2010 32 < 3 21 < 5 < 10 < 5 < 15 23 16 258
Healthy donor 4 12/18/2009 2/2/2010 111 29 88 51 50 189 253 39 196 577
2/2/2010 121 31 90 51 56 212 262 37 216 579
5/13/2010 81 20 66 38 39 147 211 30 128 468
5/13/2010 76 21 60 36 33 142 201 30 133 440
8/11/2010 232 48 160 65 90 137 173 49 277 171
8/11/2010 222 46 167 68 92 141 167 48 276 183
Healthy donor 5 12/21/2009 2/2/2010 12 9 33 < 14 < 10 18 33 20 32 194
2/2/2010 < 5 < 8 30 < 14 < 10 14 25 20 13 192
5/13/2010 5 < 8 34 < 14 < 10 14 < 15 19 < 12 177
5/13/2010 < 5 < 8 32 < 14 < 10 < 12 < 15 20 12 174
8/11/2010 7 7 26 8 < 10 > 5 < 15 25 20 16
8/11/2010 12 12 33 10 < 10 < 5 23 27 20 17
Healthy donor 6 12/21/2009 2/2/2010 19 8 24 < 14 < 10 < 12 37 22 50 496
2/2/2010 < 5 < 8 28 < 14 < 10 < 12 17 22 37 558
5/13/2010 19 < 8 15 < 14 < 10 < 12 18 19 40 434
5/13/2010 10 < 8 < 12 < 14 < 10 < 12 18 18 36 413
8/11/2010 12 12 47 12 14 7 21 27 48 111
8/11/2010 18 11 45 13 13 7 21 28 51 108
Healthy donor 7 12/22/2009 2/2/2010 16 < 8 38 < 14 < 10 35 56 19 66 1040
2/2/2010 17 9 40 < 14 10 35 62 19 66 1019
5/13/2010 19 < 8 35 < 14 < 10 40 51 17 50 843
5/13/2010 20 < 8 41 < 14 < 10 33 51 18 53 848
8/11/2010 13 6 28 28 < 10 19 37 21 24 245
8/11/2010 16 10 30 41 11 25 49 24 24 246
Healthy donor 8 12/23/2009 2/2/2010 54 15 39 29 17 82 135 40 188 926
times were plotted together (Figure 3), the trends in concentration changes observed were not significantly different between the serum sample data sets (old patients, HD, new patients) (Table 1, Table 2, Table 3).
Cytokine Controls used in assays
We purchased our Luminex kits from a single source, however, that source changed ownership between Oct.
[image:8.595.58.543.101.322.2]‘05 and Aug. ‘10 (from Biosource to Invitrogen to Life Table 2 Healthy Donor Sera Analysis(Continued)
5/13/2010 64 15 37 32 21 76 144 38 160 815
5/13/2010 65 15 35 33 20 72 129 36 160 742
8/11/2010 23 < 3 10 8 < 10 9 22 34 71 144
8/11/2010 32 6 14 14 < 10 21 36 34 96 130
Healthy donor 9 12/24/2009 2/2/2010 < 5 9 17 < 14 < 10 < 12 < 15 21 13 969
2/2/2010 < 5 8 15 < 14 < 10 < 12 < 15 20 20 928
5/13/2010 < 5 < 8 13 < 14 < 10 < 12 < 15 17 < 12 784
5/13/2010 < 5 < 8 14 < 14 < 10 < 12 < 15 19 < 12 813
8/11/2010 8 11 19 9 < 10 6 < 15 29 20 332
8/11/2010 7 10 17 8 < 10 < 5 < 15 26 20 331
Healthy donor 10 12/28/2009 2/2/2010 < 5 8 < 12 < 14 < 10 < 12 < 15 37 13 1034
2/2/2010 < 5 < 8 < 12 < 14 < 10 16 < 15 37 13 990
5/13/2010 < 5 < 8 < 12 < 14 < 10 < 12 < 15 34 < 12 845 5/13/2010 < 5 < 8 < 12 < 14 < 10 < 12 < 15 36 < 12 802
8/11/2010 < 5 4 < 3 < 5 < 10 < 5 < 15 57 6 374
8/11/2010 5 5 < 3 < 5 < 10 8 < 15 59 11 385
Table 3 New Melanoma Patient Sera Analysis
Sample Draw
Date
Assay Date
IL-4 pg/mL
IL-6 pg/mL
IL-8 pg/mL
IL-10 pg/mL
TNF-a pg/mL
IFN-g pg/mL
GM-CSF pg/mL
IP-10 pg/mL
MIG pg/mL
MCP-1 pg/mL
Mel. Pt. 1 5/10/2010 5/13/2010 15 11 42 < 14 95 24 < 15 39 12 754
5/10/2010 5/13/2010 10 8 39 < 14 82 22 < 15 40 17 754
5/10/2010 8/11/2010 21 12 44 22 183 20 41 49 32 270
5/10/2010 8/11/2010 24 13 43 29 168 23 51 50 32 268
Mel. Pt. 2 5/10/2010 5/13/2010 18 17 87 < 14 < 10 26 < 15 30 21 1437
5/10/2010 5/13/2010 13 16 95 < 14 < 10 21 < 15 31 17 1494
5/10/2010 8/11/2010 28 30 97 22 10 25 33 38 39 664
5/10/2010 8/11/2010 25 31 86 24 10 24 30 37 28 662
Mel. Pt. 3 5/10/2010 5/13/2010 42 21 72 29 20 < 12 18 190 81 771
5/10/2010 5/13/2010 38 19 70 25 17 < 12 18 188 78 732
5/10/2010 8/11/2010 34 14 73 31 38 9 47 141 96 223
5/10/2010 8/11/2010 36 15 70 28 32 6 50 135 89 198
Mel. Pt. 4 5/10/2010 5/13/2010 68 26 45 51 19 62 107 19 145 955
5/10/2010 5/13/2010 66 24 42 53 18 63 111 18 143 875
5/10/2010 8/11/2010 102 36 26 120 < 10 16 50 19 100 238
5/10/2010 8/11/2010 99 41 24 139 < 10 16 48 20 103 215
Mel. Pt. 5 5/10/2010 5/13/2010 35 64 380 < 14 13 27 78 27 106 831
5/10/2010 5/13/2010 34 61 393 < 14 10 27 82 26 101 737
5/10/2010 8/11/2010 33 43 458 20 16 27 54 32 139 170
[image:8.595.58.540.418.732.2]Technologies). Each kit includes reagents to generate an 8-point standard curve from which all values are deter-mined. For the custom kits we requested, to test a speci-fic array of analytes of interest, the manufacturer pre-tests the specific antibodies together, to confirm lack of cross-reactivity. The manufacturer indicates that the kits are not released unless the following criteria are met:“ < 10% cross-reactivity to related recombinant protein at the highest point of the standard curve”(Life Technolo-gies). We requested the specific cross-reactivity testing data performed for the kits we used in this study, but were repeatedly informed that company policy prohibits QC data release to customers.
As an additional control, we included“Multiplex QC” controls, which are complex mixtures of recombinant cytokines, chemokines and growth factors prepared by the manufacturer at 3 concentrations (low, medium and high). We have established the reproducibility of this control (Additional File 4, Table S4) when tested via
[image:9.595.55.539.91.452.2]exceeded 10% of that of the standard. IL-6, IFN-g and GM-CSF also showed evidence of minor cross-reactivity. The apparent cross-reactivity seen for MCP-1 and MIG might be caused by a medium additive present in the AIM V medium (a serum-free lymphocyte culture medium) used in a dilution step for these proteins. We tested several commonly used culture medias (AIM V, RPM1640, Iscoves and CellGenix DC media) in a 30-plex Luminex assay which also included a repeat test of the WHO standards. The results did identify low levels (3-62 pg/mL) of several analytes in the culture medias (HGF, FGF basic, RANTES, IL-17 and IL2R) but not MCP-1 or MIG (data not shown). The MCP-1 was again detected in the IL-8 and GM-CSF WHO stan-dards and MIG in the IL-10 standard (as well as HGF, FGF basic and RANTES). We are investigating other possible sources of low levels of other cytokines and growth factors in the WHO standards.
As a test of the day-to-day reproducibility of two of the cytokines of particular interest, IL-6 and IL-8, a set of samples and controls were run in two different cus-tom kits one day apart (with samples kept thawed, at 4° C overnight), in which both IL-6 and IL-8 were included
in both kits. Notably, these two kits also had different standard curves and upper limits of detection. For IL-6, the 10-plex kit upper limit was 7, 400 pg/mL, while in the 8-plex, it was 13, 800 pg/mL (1.8 fold higher). For IL-8, the 10-plex upper limit was 24, 800 pg/mL and in the 8-plex, 10, 160 pg/mL (2.4 fold lower). When the values for the 38 samples were compared between the two kits, the ratio of the IL-6 values was 1.0 (median & mean), showing excellent concordance. For IL-8, where the upper limits were more disparate, the ratio of the values was 0.80, which was a small but significant differ-ence (Figures 4A and 4B). These data indicate that the assay with the higher upper limit has larger measured values.
Upper limit problem
[image:10.595.59.539.88.401.2]detection range. However, if the concentration determi-nations were affected, that would confound our inter-pretation of the observed changes in analyte concentration over time, and therefore we investigated that possibility. Data from assays done on 5/13/2010 ("late”assay) were compared to data from assays on 10/ 31/2005, 11/1/2005 or 2/17/2006 ("early” assays). Kits used in 2005 and 2006 had the same upper limits, and because no samples had assays done on the same date, results were combined. Figure 5 is a scatter plot of the late-to-early ratio of analyte concentrations versus the late-to-early ratio of assay upper limits assays with a smooth curve is superimposed. The late-to-early ratio of upper limits was different for each of the 10 analytes. Typically, 12 samples were assessed for each analyte. The correlation of the two ratios is highly significant (p < 10-15, Spearman’s test). Therefore, we are concerned
that assays performed at different times with different kits may not be comparable.
[image:11.595.60.541.100.508.2]In this report, we detail reproducibility problems we encountered testing circulating cytokines, chemokines and growth factors by Luminex in serum samples which were stored over months to years under highly con-trolled conditions. Some of these changes were very dra-matic: IL-8 increased 4-6 fold in old patient samples; MCP-1 decreased 4-6 fold in new patient samples, and up to 10-fold in healthy donor samples; IL-10 changed from negative to positive or positive to negative within the same old patient serum dataset (Figure 1). Our initial hypothesis was that the changes were entirely bio-logical, and that despite standardized blood handling procedures and temperature-controlled freezer storage, some analytes became unstable over time or upon thaw. Two recent reports testing cytokine stability found most Table 4 WHO Cytokine Standards
Lab Number Assay Date
IL-4 pg/mL
IL-6 pg/mL
IL-8 pg/mL
IL-10 pg/mL
TNF-a pg/mL
IFN-g pg/mL
GM-CSF pg/mL
IP-10 pg/mL
MIG pg/mL
MCP-1 pg/mL
117173 IL-4
1:10 40311 17497 N/A N/A N/A N/A N/A N/A N/A N/A N/A
1:10 40401 11364 N/A N/A N/A N/A N/A N/A N/A N/A 196
1:10 40401 10956 N/A N/A N/A N/A N/A N/A N/A N/A 114
1:50 40311 10945 N/A N/A N/A N/A N/A N/A N/A N/A N/A
1:50 40401 1350 N/A N/A N/A N/A N/A N/A N/A N/A 392
1:50 40401 1321 N/A N/A N/A N/A N/A N/A N/A N/A 1220
117177 IL-8
1:10 40311 N/A N/A 216983 N/A N/A N/A N/A N/A N/A N/A
1:10 40401 N/A N/A 153880 N/A N/A N/A N/A N/A N/A 563
1:10 40401 N/A N/A 153707 N/A N/A N/A N/A N/A N/A 509
1:50 40311 N/A N/A QA N/A N/A N/A N/A N/A N/A N/A
1:50 40401 N/A N/A 45621 N/A N/A N/A N/A N/A N/A 2169
1:50 40401 N/A N/A 46708 N/A N/A N/A N/A N/A N/A 1445
117184 IL-10
1:10 40311 N/A N/A N/A 119338 N/A N/A 180 N/A 1813 N/A
1:10 40401 N/A 230 N/A 72096 N/A N/A N/A N/A 3621 318
1:10 40401 N/A 226 N/A 95800 N/A N/A N/A N/A 3891 389
1:50 40311 N/A N/A N/A 95462 N/A N/A N/A N/A 3836 N/A
1:50 40401 N/A 340 N/A 39419 N/A N/A N/A N/A 4488 1855
1:50 40401 N/A 179 N/A 30223 N/A N/A N/A N/A 4053 1308
117187GM-CSF
1:10 40401 N/A N/A N/A N/A N/A 373 75824 N/A N/A 875
1:10 40401 N/A N/A N/A N/A N/A 272 70453 N/A N/A 721
1:10 40311 N/A N/A N/A N/A N/A N/A 47332 N/A N/A N/A
1:10 40311 N/A N/A N/A N/A N/A N/A 78882 N/A N/A 769
1:50 40311 N/A N/A N/A N/A N/A N/A 59603 N/A N/A N/A
1:50 40311 N/A N/A N/A N/A N/A N/A 76623 N/A N/A 1063
tested cytokines to be stable over 1-2 years at -80°C, and a subset (including IL-8 and IL-10) became unstable after 2-4 years [24,25]. Many of the proteins became unstable after repeated freeze-thaw cycles. If these were the only mechanisms, then the analytes we tested should have behaved consistently between our three datasets, because the change would be analyte-specific. This is not the only
explanation, because, for example, MCP-1 increased over time in the majority of old patient samples and decreased over time in both HD and new patient sets.
[image:12.595.60.538.85.320.2]Our study has a number of limitations. The more recently acquired HD and new patient data sets were tested within months of blood draw. A better analysis of the impact of storage time on analyte stability would require a large number of patients and HD samples stored for longer periods with costly repeated multiplex testing. We also limited the diversity of analytes we examined. Another variable was the time from blood draw to serum separation and freezing. Some of our samples were drawn within the laboratory and at our nearby clinic and processed within a few hours, while other old patient samples were shipped overnight and processed the following morning. However, the nature of these blood handling procedures reflects the unavoid-able limitations inherent in transferring patient blood from the clinic to a central laboratory capable of stan-dardized processing, as well as for multi-institutional trials where large numbers of patients can be treated and tested, but overnight shipping is required. Lastly, some of our healthy donor and control samples were run in duplicate, but to reduce costs, large numbers of patient sera were run in singlets. Due to the small aver-age % CVs determined for many duplicates (Additional File 1, Table S1) this may have minimal impact on the trends we observed.
Figure 4Two plates run together compared for A) IL-6 and B) IL-8 values. A set of 38 cell culture samples were run on both an 8-plex and a 10-plex plate. The values for IL-6 and IL-8 are compared on a log scale. Each plate had a unique upper limit. The values for IL-6 show excellent concordance, and the 8-plex upper limit was 1.8 times the upper limit. The IL-8 values were reproducibly higher (1.25×) in the 10-plex plate where the upper limit was 2.4 times higher.
[image:12.595.57.290.500.671.2]The Luminex assay has been shown (by ourselves [26] and others [27]) to show good correspondence to ELISA platform assays. In addition, the Luminex assay has good reproducibility from well-to-well, and from day-to-day (Figure 4). Also, our use of the R&D QC controls (Additional File 4, Table S4) indicate good reproducibil-ity of recombinant analytes when mixed together. This may indicate that the serum matrix may impact repro-ducibility, and/or the biological impact of a tumor may lead to systemic changes (including altered glycosyla-tion) which impact the assay.
This study also suggests that the changes in the upper limits of detection, which can vary substantially from kit to kit, month to month, and analyte to analyte from a single manufacturer, may impact the ability to deter-mine analyte concentration. This impacts kit-to-kit reproducibility, and greatly increases the importance of comparing samples with the identical lot of kits with identical standard curve ranges. We attempted to dissect this further by requesting access to manufacturer QC data, but we were repeatedly denied access to any addi-tional information specific to the testing performed on the kits we used.
We do not understand why the assay kit upper limits seem to affect assay performance in the systematic way that is evident in Figure 5. However, we have to con-clude that the results of assays done with different kits cannot be directly compared. Therefore, the apparent changes in analyte levels over time that we observe may arise from the kit-to-kit variability: we cannot claim to observe changes in analyte levels over storage time at -80°C.
Conclusions
In conclusion, the multiplex Luminex platform offers the opportunity to test a wide variety of analytes in the same sample, with minimal volume requirements, and good well-to-well and day-to-day reproducibility. These attributes are important when broadly searching for serum biomarkers. However, we find that a number of commonly tested candidate immunologic biomarkers show evidence of unexpected, large variability when tested retrospectively, after long storage times. This variability can be reduced by 1) performing assays with kits from a single lot, and potentially 2) minimizing sto-rage time before retrospective analysis of banked serum.
Additional material
Additional file 1: Table S1: Luminex kit details. This table includes upper and lower limits of detection and %CVs.
Additional file 2: Table S2: Healthy Donor Demographics. This table includes age, race and gender information.
Additional file 3: Table S3: New Melanoma Patient Demographics. This table includes age, race, gender and treatment information.
Additional file 4: Table S4: R&D Systems QC Control Data. This table includes control sample values and %CVs.
List of Abbreviations
IL: interleukin; TNF: tumor necrosis factor; GM-CSF: granulocyte-macrophage colony stimulating factor; PBMC: peripheral blood mononuclear cells; FDA: Food and Drug Administration; FBS: fetal bovine serum.
Acknowledgements and funding
We acknowledge Sharon Sember (IML) for conduct of the Luminex assays (UPCI IML), and Dr. Theresa L. Whiteside (University of Pittsburgh) for helpful discussions.
This study was supported in part by the University of Pittsburgh Cancer Institute and the NIH Cancer Center Support Grant P30 CA047904; NCI RO1 CA138635 (LHB); Developmental Research Funds of the SPORE in Skin Cancer P50 CA121973 (JMK); Frontier Science and Technology Research Foundation and ECOG Central Laboratory Support (LHB).
Author details
1University of Pittsburgh Cancer Institute, 5117 Centre Avenue, suite 1.27,
Pittsburgh, PA 15213, USA.2University of Pittsburgh School of Medicine, 5117 Centre Avenue, suite 1.27, Pittsburgh, PA 15213, USA.3Department of
Medicine, University of Pittsburgh, 5117 Centre Avenue, suite 1.27, Pittsburgh, PA 15213, USA.4Department of Surgery, University of Pittsburgh,
5117 Centre Avenue, suite 1.27, Pittsburgh, PA 15213, USA.5Department of Immunology, University of Pittsburgh, 5117 Centre Avenue, suite 1.27, Pittsburgh, PA 15213, USA.6Depament of Biostatistics, University of
Pittsburgh, 5117 Centre Avenue, suite 1.27, Pittsburgh, PA 15213, USA.
Authors’contributions
LHB designed experiments, reviewed data, supervised assay conduct and wrote sections of the manuscript; DMP helped design experiments, designed and performed all statistical analyses and wrote sections of the manuscript; JMK provided many patient blood samples, reviewed data and wrote sections of the manuscript. All authors read and approved the final manuscript.
Competing interests
The authors declare that they have no competing interests.
Received: 15 June 2011 Accepted: 11 October 2011 Published: 11 October 2011
References
1. Dancey JE, Dobbin KK, Groshen S, Jessup JM, Hruszkewycz AH, Koehler M, Parchment R, Ratain MJ, Shankar LK, Stadler WM, True LD, Gravell A, Grever MR, Biomarkers Task Force of the NCI Investigational Drug Steering Committee:Guidelines for the development and incorporation of biomarker studies in early clinical trials of novel agents.Clin Cancer Res
2010,16:1745-55.
2. Kirkwood JM, Manola J, Ibrahim J, Sondak V, Ernstoff MS, Rao U, Eastern Cooperative Oncology Group:A pooled analysis of eastern cooperative oncology group and intergroup trials of adjuvant high-dose interferon for melanoma.Clin Cancer Res2004,10:1670-1677.
3. Rosenberg SA, Restifo NP, Yang JC, Morgan RA, Dudley ME:Adoptive cell transfer: a clinical path to effective cancer immunotherapy.Nat Rev Cancer2008,8:299-308.
5. Tahara H, Sato M, Thurin M, Wang E, Butterfield LH, Disis ML, Fox BA, Lee PP, Khleif SN, Wigginton JM, Ambs S, Akutsu Y, Chaussabel D, Doki Y, Eremin O, Fridman WH, Hirohashi Y, Imai K, Jacobson J, Jinushil M, Kanamoto A, Kashani-Sabet M, Kato K, Kawakami Y, Kirkwood JM, Kleen TO, Lehmann PV, Liotta L, Lotze MT, Malyguine A, Masucci G, Matsubara H, Nakamura K, Nishikawa H, Palucka AK, Petricoin EF, Pos Z, Ribas A, Rivoltini L, Sato N, Shiku H, Slingluff CL, Streicher H, Stronchek DF, Takeuchi H, Toyota M, Wada H, Wu X, Wulfkuhle J, Yaguchi T, Zeskind B, Zhao Y, Zocca M-B, Marincola FM:Emerging concepts in biomarker discovery: The US-Japan workshop on immunological molecular markers in oncology.J Transl Med2009,7:45.
6. Butterfield LH, Disis ML, Khleif SN, Balwit JM, Marincola F: Immuno-oncology biomarkers 2010 and beyond: Perspectives from the iSBTc/ SITC Biomarker Task Force.J Transl Med2010,8:130.
7. Butterfield LH, Palucka AK, Britten CM, Dhodapkar MV, Hakansson L, Janetzki S, Kawakami Y, Kleen T-O, Lee PP, Macalli C, Maecker HT, Maino VC, Maio M, Malyguine A, Masucci G, Pawelec G, Potter DM, Rivoltini L, Salazar LG, Schendel DJ, Slingluff CL Jr, Song W, Stroncek DF, Tahara H, Thurin M, Trinchieri G, van Der Burg SH, Whiteside TL, Wigginton JM, Marincola F, Khleif S, Fox BA, Disis ML:Recommendations from the iSBTc-SITC/FDA/NCI Workshop on Immunotherapy Biomarkers.Clin Cancer Res
2011,17:3064-3076.
8. Yurkovetsky ZR, Kirkwood JM, Edington HD, Marrangoni AM,
Velikokhatnaya L, Winans MT, Gorelik E, Lokshin AE:Multiplex analysis of serum cytokines in melanoma patients treated with interferon-alpha2b.
Clin Cancer Res2007,13:2422-2428.
9. Hutchinson PE, Osborne JE, Pringle JH:Higher serum 25-hydroxy vitamin D3 levels at presentation are associated with improved survival from melanoma, but there is no evidence that later prevailing levels are protective.J Clin Oncol2010,28:e492-493.
10. Gajewski TF, Fuertes M, Spaapen R, Zheng Y, Kline J:Molecular profiling to identify relevant immune resistance mechanisms in the tumor microenvironment.Curr Opin Immunol2011,23:286-292.
11. Ma J, Lin JY, Alloo A, Wilson BJ, Schatton T, Zhan Q, Murphy GF, Waaga-Gasser AM, Waaga-Gasser M, Stephen Hodi F, Frank NY, Frank MH:Isolation of tumorigenic circulating melanoma cells.Biochem Biophys Res Commun
2010,402:711-717.
12. Liu Y, He J, Xie X, Su G, Teitz-Tennenbaum S, Sabel MS, Lubman DM:
Serum autoantibody profiling using a natural glycoprotein microarray for the prognosis of early melanoma.J Proteome Res2010,9:6044-6051. 13. Kirkwood JM, Lee S, Moschos SJ, Albertini MR, Michalak JC, Sander C,
whiteside TL, Butterfield LH, Weiner L:Immunogenicity and antitumor effects of vaccination with peptide vaccine+/-granulocyte-monocyte colony-stimulating factor and/or IFN-alpha2b in advanced metastatic melanoma: Eastern Cooperative Oncology Group Phase II Trial E1696.
Clin Cancer Res2009,15:1443-1451.
14. Gould Rothberg BE, Rimm DL:Biomarkers: the useful and the not so useful–an assessment of molecular prognostic markers for cutaneous melanoma.J Invest Dermatol2010,130:1971-1987.
15. Hodi FS, Dranoff G:The biologic importance of tumor-infiltrating lymphocytes.J Cutan Pathol2010,37(Suppl 1):48-53.
16. Bull M, Lee D, Stucky J, Chiu YL, Rubin A, Horton H, McElrath MJ:Defining blood processing parameters for optimal detection of cryopreserved antigen-specific responses for HIV vaccine trials.J Immunol Meth2007,
322:57-69.
17. Kierstead LS, Dubey S, Meyer B, Tobery TW, Mogg R, Fernandez VR, Long R, Guan L, Gaunt C, Collins K, Sykes KJ, Mehrotra DV, Chirmule N, Shiver JW, Casimiro DR:Enhanced rates and magnitude of immune responses detected against an HIV vaccine: effect of using an optimized process for isolating PBMC.AIDS Res Hum Retroviruses2007,23:86-92.
18. McKenna KC, Beatty KM, Bilonick RA, Schoenfield L, Lathrop KL, Singh AD:
Activated CD11b+CD15+ granulocytes increase in the blood of patients with uveal melanoma.Invest Ophthalmol Vis Sci2009,50:4295-4303. 19. Boaz MJ, Hayes P, Tarragona T, Seamons L, Cooper A, Birungi J, Kitandwe P,
Semaganda A, Kaleebu P, Stevens G, Anzala O, Farah B, Ogola S, Indangasi J, Mhlanga P, Van Eeden M, Thakar M, Pujari A, Mishra S, Goonetilleke N, Moore S, Mahmoud A, Sathyamoorthy P, Mahalingam J, Narayanan PR, Ramanathan VD, Cox JH, Dally L, Gill DK, Gilmour J:
Concordant proficiency in measurement of T-cell immunity in human immunodeficiency virus vaccine clinical trials by peripheral blood
mononuclear cell and enzyme-linked immunospot assays in laboratories from three continents.Clin Vacc Immunol2009,16:147-155.
20. Clinical Laboratory Improvement Amendments (CLIA) Brochures.[http:// www.cms.hhs.gov/CLIA/].
21. International Conference on Harmonisation of Technical Requirements for Registration of Pharmaceuticals for Human Use (ICH).[http://www.ich. org].
22. FDA Food and Drug Administration: Draft Guidance for Industry: Potency Tests for Cellular and Gene Therapy Products.[http://www.fda. gov/BiologicsBloodVaccines/GuidanceComplianceRegulatoryInformation/ Guidances/CellularandGeneTherapy/ucm072571.htm].
23. Potter DM, Butterfield LH, Divito SJ, Sander C, Kirkwood JM:Pitfalls in retrospective analyses of biomarkers: a case study with metastatic melanoma patients.2011.
24. de Jager W, Bourcier K, Rijkers GT, Prakken BJ, Seyfert-Margolis V:
Prerequisites for cytokine measurements in clinical trials with multiplex immunoassays.BMC Immunol2009,10:52.
25. Zhou XB, Fragala MS, McElhaney JEB, Kuchel GA:Conceptual and methodological issues relevant to cytokine and inflammatory marker measurements in clinical research.Curr Opin Clin Nutr Metabolic Care
2010,13:541-547.
26. Butterfield LH, Gooding W, Whiteside TL:Development of a potency assay for human dendritic cells: IL-12p70 production.J Immunother2008,
31:89-100.
27. Khan SS, Smith MS, Reda D, Suffredini AF, McCoy JP Jr:Multiplex bead array assays for detection of soluble cytokines: comparisons of sensitivity and quantitative values among kits from multiple manufacturers.Cytometry B Clin Cytom2004,61:35-39. doi:10.1186/1479-5876-9-173
Cite this article as:Butterfieldet al.:Multiplex serum biomarker assessments: technical and biostatistical issues.Journal of Translational Medicine20119:173.
Submit your next manuscript to BioMed Central and take full advantage of:
• Convenient online submission
• Thorough peer review
• No space constraints or color figure charges
• Immediate publication on acceptance
• Inclusion in PubMed, CAS, Scopus and Google Scholar
• Research which is freely available for redistribution