This is a repository copy of
Graph Spectral Domain Watermarking for Unstructured Data
from Sensor Networks
.
White Rose Research Online URL for this paper:
http://eprints.whiterose.ac.uk/130529/
Version: Accepted Version
Proceedings Paper:
Al-Khafaji, H. and Abhayaratne, C. orcid.org/0000-0002-2799-7395 (2017) Graph Spectral
Domain Watermarking for Unstructured Data from Sensor Networks. In: Digital Signal
Processing (DSP), 2017 22nd International Conference on. Digital Signal Processing
(DSP), 2017 22nd International Conference on, 23-25 Aug 2017, London, UK. IEEE .
https://doi.org/10.1109/ICDSP.2017.8096148
eprints@whiterose.ac.uk https://eprints.whiterose.ac.uk/
Reuse
Items deposited in White Rose Research Online are protected by copyright, with all rights reserved unless indicated otherwise. They may be downloaded and/or printed for private study, or other acts as permitted by national copyright laws. The publisher or other rights holders may allow further reproduction and re-use of the full text version. This is indicated by the licence information on the White Rose Research Online record for the item.
Takedown
If you consider content in White Rose Research Online to be in breach of UK law, please notify us by
Graph Spectral Domain Watermarking for
Unstructured Data from Sensor Networks
Hiba Al-khafaji
∗, Charith Abhayaratne
†Department of Electronic and Electrical Engineering The University of Sheffield
Sheffield, S1 3JD, United Kingdom
Email:∗h.alkhafaji@sheffield.ac.uk,†c.abhayaratne@sheffield.ac.uk
Abstract—The modern applications like social networks and sensors networks are increasingly used in the recent years. These applications can be represented as a weighted graph using irregular structure. Unfortunately, we cannot apply the techniques of the traditional signal processing on those graphs. In this paper, graph spread spectrum watermarking is proposed for networked sensor data authentication. Firstly, the graph spectrum is computed based on the eigenvector decomposition of the graph Laplacian. Then, graph Fourier coefficients are obtained by projecting the graph signals onto the basis functions which are the eigenvectors of the graph Laplacian. Finally, the watermark bits are embedded in the graph spectral coefficients using a watermark strength parameter varied according to the eigenvector number. We have considered two scenarios: blind and non-blind watermarking. The experimental results show that the proposed methods are robust, high capacity and result in low distortion in data. The proposed algorithms are robust to many types of attacks: noise, data modification, data deletion, rounding and down-sampling.
I. INTRODUCTION
Recent years have seen a growth of using various sensors to sense and measure various data. As these sensors are located at arbitrary locations, without following a Cartesian grid, the data recorded using a network of sensors can be represented in a graph, with vertices (nodes) representing the locations of sensors. The connectivity between nodes can be defined by considering the relationship among sensors. In this paper we are concerned with protection and authentication of such data captured via a network of sensors. However, there have been limited works on this aspect of addressing irregular graph structures.The most common approaches for protecting graph-type are: adding extra edges between a set of pairs of nodes, which have different colours based on the binary message; Maximal Independent Set (MIS) based on choosing one or more set(s) from the original graph such that the set is independent [1]; inserting new nodes to the original graph and connect them depending on the binary message [2] and hiding a sub-graph which is generated from a watermark [3]. Since these works are based on vertex domain, they are not robust to data processing, noise removal or geometrical attacks, such as, adding new nodes, edges or sub-graphs. In addition, these methods are not secure, if the original graph is available the watermark can be detected by comparing the two graph topologies. Finally, the embedding capacity is very
small due to the embedding process is depended on the graph topology, not the correlation of its data.
On the other hand, spread spectrum watermarking has proven to be very successful in image protection, mainly due to advances in signal transforms, such as, the Discrete Cosine Transform (DCT) and the Discrete Wavelet Transform (DWT) [4].
However, such transforms are not applicable for graph data, where the nodes are spread at arbitrary locations, as opposed to uniform sampling grid in images and other signals. In this paper, we propose a new spread spectrum watermark-ing methodology for graph data by exploitwatermark-ing the spectral decomposition of graph data. In this work, we exploit the recent advances in graph signal processing on graph spectral decomposition of the graph Laplacian matrix, which captures the connectivity of the nodes. [5], [6]. The resulting basis func-tions are stable and invariant to the geometric changes. Also, the embedding algorithms are dependent on some parameters which can be considered as a secret key, leading to more secured watermarking algorithms. Moreover, the embedding capacity is bigger than the existing methods because most of the graph nodes are used to hide the watermark on the spectral domain. The main contributions of the proposed work are:
1) The first work on graph spread spectrum watermark hiding.
2) Propose novel blind and non-blind watermarking for networked sensor data.
3) Using unfixed (graph connectivity adapted) basis func-tions for watermark hiding.
The rest of the paper is organized as follows: Section II provides a brief introduction to the related work. Section III presents the proposed method, followed by the results and discussions are presented in section IV. Finally, the conclusions are presented in section V.
II. RELATEDWORK
This section includes two parts: watermarking on sensor networks and watermarking on graph domain for mesh data.
A. Watermarking of sensor data
by Fang et al. [7] for copyright ownership by hiding the authorship signatures in the sensor data during network pro-cessing. However, it can be used with limited applications. Similar work was suggested by Koushanfar et al. [8] to hide the watermark during the data acquisition process, it is robust against signature removal and desynchronization. Sion et al. [9] proposed watermarking algorithm based on least significant bits to protect the data stream owners and the authorized users. Similar works were proposed by Kamel et al. [10].
B. Watermarking on graph domain
Most of the watermarking methods on a graph are related to mesh. The main idea is to hide the watermark bits on the mesh coordinates or mesh coefficients. In mesh data watermarking, the watermark has been embedded on the mesh coordinates have been projected on to the eigenvectors of Laplacian matrix of the mesh connectivities [11]. However, it requires a high computational cost (O(N3)) and it is sensitive to any modification in the connectivity of the mesh. In another work [12], a blind hiding method has been proposed for mesh data, by reorganising these projected coordinates. This method causes a visual distortion of the mesh (graph topology) and has a limited robustness. Similar works based on the manifold harmonics in [13], [14] for meshes. These methods used eigen decomposition of Lapalacian matrix of mesh graphs and applied them onto the node coordinates, as opposed to considering the spread spectrum hiding methods for the data recorded at these mesh nodes.
III. THE PROPOSED GRAPH SPREAD SPECTRUM WATERMARKING
The graph spectral theory is an important aspect of the graph theory, which is related with the eigenvalues and eigenvectors. Eigenvalues and eigenvectors are the most significant invariant vectors of the graph spectral decomposition. The main goal of the spectral graph theory is to conclude the structure and principal attributes of the graph using its spectrum. Our pro-posed watermarking framework starts with the graph spectral decomposition, which we call the Graph Fourier Transform (GFT). Then we analyses the spectral coefficients to propose a new embedding process, followed by the inverse GFT to reconstruct the watermarked graph data. We consider two watermarking scenarios: blind and non-blind. The watermark extraction algorithm starts with the GFT followed by the extraction process and authentication. The non-blind scenario uses the original graph for extracting the watermark. The embedding and extraction framework is shown in Fig. 1.
A. Graph Preliminaries
Let Gbe undirected graph without self-loops and multiple links between nodes. It can be represented asG= (V, E, W), whereV represents graph nodes withN length, |V|=N <
[image:3.612.342.535.50.144.2]∞ ,E represents the edges, i.e., the connection between the nodes and W is a weight matrix, which gives the weights for
Fig. 1: The block diagram of the proposed watermarking framework.
each node. The adjacency matrix A of a graph G is defined as:
A=
(
Wi,j,if there is an edge between vi and vj,
0 ,otherwise.
(1) Graph signals can be represented as a vector f =
[f(1), f(2), ..., f(N)], such as f : V → R. The
non-normalized Laplacian Lcan be given as:
L=D−A, (2)
whereD is a diagonal matrix of vertex degree, which repre-sents the sum of weights of all links connected to a given vertex. The Laplacian matrix is symmetric and it has real and non-negative eigenvalues λℓ with associated real and
orthonormal eigenvectorsuℓ. The decomposition of eigenvalue
of non-normalized Laplacian matrix such that
L=UΛUt=
N X
i=1
λiuiuti (3)
where u1, u2, ..., uN are the eigenvectors corresponding to
eigenvalues{0≤λ1≤λ2...≤λN}.
B. Graph Fourier Transform
The classical Fourier transform on R can be given as:
F(w) =< eiwx, f >=
Z
R
f(x)e−iwxdx. (4)
0.35
V1 V2
V5 V6
V3 V4
V7 V8
1 2 3 4 5 6 7 8 1 2 3 4 5 6 7 8
0.5 0.5
0
-0.5 1 2 3 4 5 6 7 8
0.5
0.5
0.5 0.5 0.5
0 0
0 0
0 0
1 2 3 4 5 6 7 8 1 2 3 4 5 6 7 8 1 2 3 4 5 6 7 8 1 2 3 4 5 6 7 8
1 2 3 4 5 6 7 8-0.5 -0.5 -0.5 -0.5 -0.5
[image:4.612.349.526.49.159.2]-0.5
Fig. 2: The basis functions of path graph.
can be computed as in the following equation:
ˆ
f(λℓ) =huℓ, fi= N X
i=1
f(i)uℓ(i). (5)
The inverse Graph Fourier Transform can be defined as the following:
f(i) =
N−1 X
ℓ=0 ˆ
f(λℓ)utℓ(i). (6)
The Graph Fourier transform satisfies the Parseval’s theorem, which means the sum of the square graph signals is equal to the sum of the square graph Fourier coefficients as follows:
||f||2
ℓ =
N X
i=1
|f(i)|2=
N−1
X
ℓ=0
|fˆ(λℓ)|2=||fˆ||2ℓ (7)
Most of the energies are in the first half of the coefficients (1 : N/2)which represents the low frequency corresponding to smaller eigenvalues while the high frequency coefficients are associated to the larger eigenvalues [5].
C. Non-Blind Watermarking
Magnitude based multiplicative watermarking widely forms as the basis for non-blind watermarking [15] [16]. We embed the watermark in to the graph Fourier coefficientsfˆas follows:
ˆ
fw= ˆf(1 +wα), (8)
where α is the watermark strength and w is the watermark value computed as w=bM, where the binary watermark bit,
b = {0,1} and M is the length of watermark sequence. In order to provide a balance between the robustness and error distortion in the spectral coefficients,αcan be adapted to the increasing frequency. Our experiments suggest by choosing
αl∝l, wherel is the eigenvector number is a good approach
to achieve this balance. For the simulations shown in this paper, we group, eigenvalues into3groups: low, mid, and high frequencies. Each frequency group uses a different αvalue as
αlow < αmid < αhigh, respectively for low, mid and high
frequencies.
In the extraction process, the watermark bitsˆb extracted as shown as follows:
ˆb=
(
1, if wˆ ≥M/2,
0, if w < M/ˆ 2, (9)
where
ˆ
w= fˆw/fˆ−1
α . (10)
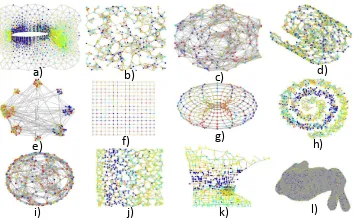
[image:4.612.73.278.51.142.2]a) b) l) f) e) k) j) i) g) d) h) c)
Fig. 3:12types of graphs. a: Air foil. b: David sensor network. c: Cube. d: Swiss-roll. e: Community. f: 2D-grid. g: Torus. h: Spiral. i: Sphere. j: Sensor. k: Minnesota. l: Bunny.
D. Blind Watermarking
The graph Fourier coefficients fˆ are modified as given in the following equation:
ˆ
fw= ˆf+c, (11)
wherefˆw is the watermarked graph Fourier coefficient and c
is the watermark parameter which is computed as follows:
c=
(
β/2 −s , if b= 0
3β/2 −s , if b= 1 , where β >0 (12)
where β is a watermark strength parameter and s =
mode( ˆf ,2β) [17]. The watermark strength parameter plays an important role to balance the watermarking robustness and distortion. In this case also, for the simulations shown in this paper, we group, eigenvalues into 3 groups: low, mid, and high frequencies and βlow < βmid < βhigh, respectively for low,
mid and high frequencies.
In the extraction process, the watermark is extracted from the watermarked coefficients as shown in the following equa-tion:
ˆb=
(
0 , if 0≤p≤β
1 , if β≤p≤2β , (13)
wherep=mode( ˆfw,2β).
E. Authentication Process
The extracted watermark is authenticated by comparing the Hamming Distance(D).
IV. RESULTS AND DISCUSSION
The methods are tested on a set of 12types of graphs (as shown in Fig. 3) and2watermark types: set of5binary logos (as shown in Fig. 4) and pseudo-random binary sequences. The performance of watermarking is investigated in terms of error distortion, robustness and capacity.
A. Experimental Results
a) b) c) d) e)
Fig. 4: 5 binary watermark logos. a: ieee. b: logo-inverse. c: medicine. d: logo-university. e: arrow.
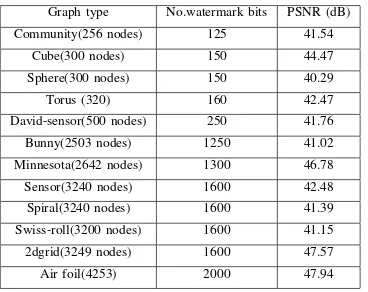
TABLE I: PSNR of various graphs (non-blind)
Graph type No.watermark bits PSNR (dB) Community(256 nodes) 125 41.54
Cube(300 nodes) 150 44.47 Sphere(300 nodes) 150 40.29 Torus (320) 160 42.47 David-sensor(500 nodes) 250 41.76 Bunny(2503 nodes) 1250 41.02 Minnesota(2642 nodes) 1300 46.78 Sensor(3240 nodes) 1600 42.48 Spiral(3240 nodes) 1600 41.39 Swiss-roll(3200 nodes) 1600 41.15 2dgrid(3249 nodes) 1600 47.57 Air foil(4253) 2000 47.94
A.1. Non-blind Watermarking Experiments
To investigate the effect of many factors on the proposed method performance such as: increasing the number of graph nodes, graph type, watermark type, dynamic range of graph signals and various attacks, the sensor graph with 3240nodes and dynamic range[1,28]is used to hide the binary watermark bits. For all experiments, the watermark strengths αlow = 0,
αmid = 0.01 and αhigh = 0.1 were used. Table I shows
the embedding error distortion for pseudo-random binary se-quence with different number of bits is embedded in different graphs. It can be seen that the graph type has affect on the watermarking performance in spite of using the same number of nodes. For example, cube has the same number of nodes as the sphere but it has a higher PSNR value. This is mainly due to the different connectivities present in various graphs.
Another factor is dynamic range of the graph signals. The sensor graph with N nodes and 3 dynamic ranges: [1,24] ,[1,28]and[1,212]are used to hide the pseudo random binary sequence with length M =N/2. The results (Table II) show that the best performance of the proposed method when the graph signals are in dynamic range [1,212]. This is mainly due to the modified value due to embedded watermark in low dynamic range data is large compared to the upper value of the dynamic range.
[image:5.612.383.487.74.128.2]Also, to show the effect of using different types of binary watermark logos, 5 binary logos are embedded in the Sensor graph with dynamic range of graph signals [1,28]. Table III shows the proposed method yields the best performance when the logo-Inverse is used because it has more zeros which means the modified coefficients are less than the other logos. Also, the watermark type affect the watermarking perfor-mance, for example, if the watermark is pseudo random binary sequence, the better performance is achieved when the sequence has more zeros compared to other watermark
TABLE II: PSNR of watermarked Sensor graph using 3 dynamic ranges of graph signals (non-blind)
Dynamic range PSNR(dB)
[1,24]
48.29
[1,28]
51.40
[1,212]
[image:5.612.83.267.141.287.2]57.59
TABLE III: PSNR of sensor graph using different watermark logos (non-blind)
No.Sensor nodes Binary logo PSNR (dB) 3240 ieee(40×40) 42.22 10000 arrow(70×74) 40.77 10000 medicine(77×76) 41.21 8100 logo-university(64×64) 41.23 8100 logo-inverse(64×64) 43.88
TABLE IV: PSNR of watermarked Air foil using different frequencies (non-blind)
[image:5.612.404.468.368.440.2]Frequency bands PSNR(dB) Low frequency coefficients 42.89 Middle frequency coefficients 44.41 High frequency coefficients 47.14
TABLE V: PSNR of watermarked sensor using different watermark strength parameterβ (blind)
β PSNR(dB) 1 53.58 2 47.70 3 44.10 4 41.60
sequences.
The most important factor is the embedding frequency band which is used to hide the watermark bits. Table IV shows the best performance of watermarking when the high frequency coefficients are used because the distortion in these coefficients is low compared to the low frequency band coefficients, due to most of the graph energy is in the low frequency components.
A.2. Blind Watermarking Experiments
To investigate the effect of the watermark strength parameter on the performance of the watermarking method. The binary watermark logo ieee is embedded in the middle and high frequency coefficients of the sensor with (3240) nodes and dynamic range signals[1,28]using various watermark strength valuesβ. As shown in Table V, the proposed method yields the best performance whenβ= 1. Therefore, for all experiments, the watermark strengths βlow = 0,βmid= 1 andβhigh= 2.
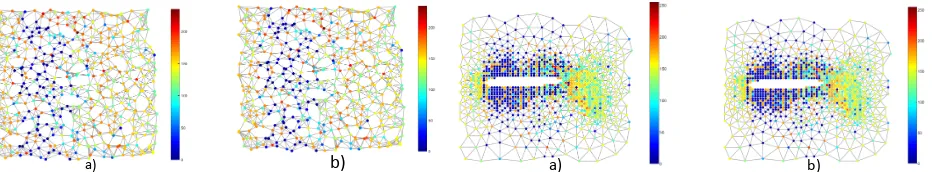
a) b) a) b)
[image:6.612.66.285.206.354.2]Fig. 5: Sensor and Airfoil graphs after applied the proposed method. a: original graphs. b: watermarked graphs.
TABLE VI: PSNR of Sensor graph using 3 dynamic ranges of graph signals (blind)
Dynamic range PSNR(dB)
[1,24] 27.78
[1,28]
52.80
[1,212]
76.63
Delete nodes Data modification
Rounding Downsampling
Non-blind
Blind
Fig. 6: Extracted watermark after various attacks.
achieves the best performance when the graph signals are in the range[1,212].
To evaluate the robustness of the proposed methods, various attacks, such as, adding random noise withσ= 0.2, rounding, data modification, nodes deletion and down-sampling were considered. Fig.6 shows the watermark after various attacks. Blind algorithm shows more robustness to noise and rounding compared to the non-blind algorithm
V. CONCLUSIONS
In this paper, we have proposed graph spread spectrum watermarking for authentication of networked sensor data. The proposed method represents the sensor data as a graph and explores its connectivity to derive the Laplacian matrix whose eigenvectors are used as the transform basis to define the graph Fourier transform. Then the properties of these coefficients are explored to hide the watermark. We have considered both blind and non-blind watermarking scenarios. In order to balance the distortion and robustness performance, we have varied the watermarking strength parameter according to the increasing eigenvector number. We have evaluated the embedding performance for various graph data, comprising of graph structures, number of nodes, dynamic ranges of the data, various watermark types and the watermark strength parameters. The results show that the watermark can be survived after various attacks: noise, data modification, data deletion, rounding and down-sampling.
REFERENCES
[1] G. Qu and M. Potkonjak, “Analysis of watermarking techniques for graph coloring problem,” inProc. of the int. conf. on Computer-aided design, 1998, pp. 190–193.
[2] A. Saha, D. Bhaumik, and S. Pathak, “Signature hiding and recovery in a graph coloring solutions using modified genetic algorithm,” inInt. Conf. on Computer and Inf. Technology (ICCIT), 2011, pp. 50–55. [3] X. Zhao, Q. Liu, H. Zheng, and B. Y Zhao, “Towards graph
water-marks,” in Proc. of the Conf. on Online Social Networks, 2015, pp. 101–112.
[4] D. Bhowmik and C. Abhayaratne, “Quality scalability aware watermark-ing for visual content,” IEEE Transactions on Image Processing, vol. 25, no. 11, pp. 5158–5172, 2016.
[5] D. I. Shuman, S. K. Narang, P. Frossard, A. Ortega, and P. Van-dergheynst, “The emerging field of signal processing on graphs: Extending high-dimensional data analysis to networks and other irregular domains,”IEEE Signal Processing Magazine, vol. 30, no. 3, pp. 83–98, 2013.
[6] D. K. Hammond, P. Vandergheynst, and R. Gribonval, “Wavelets on graphs via spectral graph theory,”Applied and Computational Harmonic Analysis, vol. 30, no. 2, pp. 129–150, 2011.
[7] J. Fang and M. Potkonjak, “Real-time watermarking techniques for sensor networks,” inElectronic Imaging, 2003, pp. 391–402. [8] F. Koushanfar and M. Potkonjak, “Watermarking techniques for sensor
networks: foundation and applications,” Security in Sensor Networks, 2006.
[9] R. Sion, M. Atallah, and S. Prabhakar, “Resilient rights protection for sensor streams,” inProc. of int. conf. on Very large data bases, 2004, vol. 30, pp. 732–743.
[10] I. Kamel and H. Juma, “A lightweight data integrity scheme for sensor networks,” Sensors, vol. 11, no. 4, pp. 4118–4136, 2011.
[11] R. Ohbuchi, S. Takahashi, T. Miyazawa, and A. Mukaiyama, “Water-marking 3D polygonal meshes in the mesh spectral domain,” inGraphics interface, 2001, vol. 2001, pp. 9–17.
[12] F. Cayre and B. Macq, “Data hiding on 3-D triangle meshes,” IEEE Trans. on signal Processing, vol. 51, no. 4, pp. 939–949, 2003. [13] Y. Liu, B. Prabhakaran, and X. Guo, “A robust spectral approach for
blind watermarking of manifold surfaces,” inProc. of the workshop on Multimedia and security, 2008, pp. 43–52.
[14] K. Wang, M. Luo, A. G. Bors, and F. Denis, “Blind and robust mesh watermarking using manifold harmonics,” inInt. Conf. on Image Processing (ICIP), 2009, pp. 3657–3660.
[15] M. Oakes, D. Bhowmik, and C. Abhayaratne, “Global motion compen-sated visual attention-based video watermarking,” Journal of Electronic Imaging, vol. 25, no. 6, pp. 061624–061624, 2016.
[16] D. Bhowmik, M. Oakes, and C. Abhayaratne, “Visual attention-based image watermarking,” IEEE Access, vol. 4, pp. 8002–8018, 2016. [17] C. Jin, Z. Zhang, Y. Jiang, Z. Qu, and C. Ma, “A blind watermarking
algorithm based on modular arithmetic in the frequency domain,” in