ζ
o
Q
LU O Oo
r\ä
Our mission is to provide the European Union
with a high-quality statistical information service
E u r o s t a t ' s c o l l e c t i o n s are adapted to the needs of all users.
You will find them in each of the nine themes proposed by Eurostat.
1 General statistics
2 Economy and finance
3 Population and social conditions
4 Industry, trade and services
5 Agriculture and fisheries
<*§:
£
:o
6 External trade
7 Transport
8 Environment and energy
9 Research and development
C o n t e n t
Press releases:
Eurostat publishes around 100 press releases every year in
connection with the release of new data. The press releases include the key figures
on the EU, the Member States and their partners. They are provided free of charge.
They are also available on the Internet as soon as they are published:
www.europa.eu.int/comm/eurostat/
F o r m a t
Paper
Html
Statistics in focus:
This collection is published regularly by Eurostat and provides
up-to-date summaries of the main results of statistical surveys, studies and analyses.
It covers all themes and consists of about four to eight pages per issue. Eurostat issues
around 150
Statistics in Focus
per year. Available as single copies or on subscription.
mm
Paper
Key indicators:
This collection provides the main indicators on a theme or
sub-theme in an easy-to-carry booklet of up to 100 pages. Available as single
copies or on subscription.
IB
Paper
Html
Panorama of the European Union:
This collection highlights the features
and trends of a multi-sectoral theme or a sectoral sub-theme. The publications
consist of around 200 pages and include analysis as well as tables and graphs.
Available as single copies or on subscription.
HB
Paper
CD-ROM
Methods and nomenclatures
are intended for specialists who want to
consult the methodologies and nomenclatures used for a theme, a sub-theme or a
sector. Available as single copies.
Paper
CD-ROM
Detailed tables
are intended for specialists. They present part, or all, of the
statistical data compiled on a theme, sub-theme or sector. Available as single
copies or on subscription.
Paper
CD-ROM
Studies and research
summarise the results of European statistical studies
and research and are intended for specialists. Available as single copies or on
subscription.
Paper
CD-ROM
ζ
o
Q
LU O
o
o
<N¡
Immediate access to harmonised statistical data
E u r o s t a t D a t a S h o p s
J
A personalised data-retrieval service
In order to provide the greatest possible number of people with access to high-quality statistical
infor-mation, Eurostat has developed an extensive network of Data Shops 0).
Data Shops provide a wide range of tailor-made services:
* immediate information searches undertaken by a team of experts in European
statistics;
* rapid and personalised response that takes account of the specified search
requirements and intended use;
* a choice of data carrier depending on the type of information required.
Information can be requested by phone, mail, fax or e-mail.
(') See list of Eurostat Data Shops at the end of the publication.
I n t e r n e t
)
Essentials on Community statistical news
* Euro indicators: more than 100 indicators on the euro-zone; harmonised, comparable,
and free of charge;
* About Eurostat: what it does and how it works;
* Products and databases: a detailed description of what Eurostat has to offer;
* Indicators on the European Union: convergence criteria; euro yield curve and further
main indicators on the European Union at your disposal;
* Press releases: direct access to all Eurostat press releases.
For further information, visit us on the Internet at: VvAAAA/.europa.eu.int/COmm/eurOStat/
A great deal of additional information on the European Union is available on the Internet.
It can be accessed through the Europa server (http://europa.eu.int).
Cataloguing data can be found at the end of this publication.
Luxembourg: Office for Official Publications of the European Communities, 2000
ISBN 92-827-9809-7
© European Communities, 2000
eurostat
EUROSTAT
L-2920 Luxembourg — Tel. (352) 43 01-1 — Telex COMEUR LU 3423
Rue de la Loi 200, B-1049 Bruxelles — Tel. (32-2) 299 11 11
Eurostat is the Statistical Office of the European Communities. Its task is to provide the
European Union with statistics at a European level, that allow comparisons to be made
between countries and regions. Eurostat consolidates and harmonizes the data collected by
the Member States.
To ensure that the vast quantity of accessible data is made widely available, and to help
each user make proper use of the information, Eurostat has set up a publications and
services programme.
This programme makes a clear distinction between general and specialist users and
particular collections have been developed for these different groups. The collections Press
releases, Statistics in focus, Panorama of the European Union, Key indicators and
Catalogues are aimed at general users. They give immediate key information through
analyses, tables, graphs and maps.
The collections Methods and nomenclatures, Detailed tables and Studies and research suit
the needs of the specialist who is prepared to spend more time analysing and using very
detailed information and tables.
All Eurostat products are disseminated through the Data Shop network or the sales agents
of the Office for Official Publications of the European Communities. Data Shops are
available in 12 of the 15 Member States as well as in Switzerland, Norway and the United
States. They provide a wide range of services from simple database extracts to tailor-made
investigations. The information is provided on paper and/or in electronic form via e-mail, on
diskette or CD-ROM.
As part of the new programme Eurostat has developed its website. It includes a broad range
of on-line information on Eurostat products and services, newsletters, catalogues, on-line
publications as well as indicators on the euro-zone.
eurostat
INTRODUCTION 7
SYMBOLS AND ABBREVIATIONS 8
METHODOLOGICAL NOTES
1. General 9
2. Legal basis 10
3. Survey unit and field of observation 10
4. Survey date 16
5. Sampling plan .-. 17
6. Community farm structure survey 1997 18
7. Geographical breakdown 18
8. Community typology for agricultural holdings 18
8.1 The basis of the Community typology: standard gross margins 19
8.2 Use of standard gross margins 20
8.3 Interpretation of the typology 21
8.4 Non-classifiable holdings 21
8.5 The monetary aspect of SGMs 22
9. Livestock units (LSU) 23
10. List of characteristics 24
TOTAL HOLDINGS
1. -Structure of agricultural holdings 28
- number of holdings, agricultural area, standard gross margin
- land use
2. - Holdings by size classes of the
agricultural area
29
- number of holdings
- agricultural area
3. Holdings by
economic size
classes 30
- number of holdings
- agricultural area
4.
Type of tenure
by size classes of the agricultural area (AA) 31
- agricultural area owner-farmed
- agricultural area tenant farmed
- agricultural area share farmed
Holdings by crops
5. - Holdings with
cereals
(D/01 - D/08) 32
- number of holdings
- agricultural area
6. - Holdings broken down by area under
cereals
(D/01 - D/08) 33
- number of holdings
- area with cereals
7. - Holdings broken down by area under
common wheat
(D/01) 34
- number of holdings
- area with common wheat
8. - Holdings broken down by area under
grain maize
(D/06) 35
- number of holdings
- area with grain maize
9. - Holdings broken down by area under
potatoes
(D/09) 36
- number of holdings
- area with potatoes
10. - Holdings broken down by area under
sugar-beet
(D/l 1) 37
- number of holdings
- area with sugar-beet
11.- Holdings broken down by area under
industrial plants
(D/13) 38
- number of holdings
- area with permanent pasture and meadow
[m
eurostat
13. - Holdings broken down by area under
permanent pasture and meadow
(F) 40
- number of holdings
- area with permanent pasture and meadow
14. - Holdings broken down by area under
fruit and berry plantations
(G/01) 41
- number of holdings
- area with fruit and berry plantations
15. -Holdings broken down by area under vineyards (J/04) 42
- number of holdings
- area with vineyards
16. - Holdings broken down by area under woodland (H/02) 43
- number of holdings
- area with woodland
17. - Holdings with fresh vegetables, melons and strawberries by size classes of the agricultural area (D/14 - D/15) 44
- number of holdings
- area outdoor (D/14)
- area under glass (D/15)
18. - Holdings with flowers
and
ornamental plants by size classes of the agricultural area (D/16 - D/17) 45
- number of holdings
- area outdoor (D/l 6)
- area under glass (D/17)
19. - Holdings with forage plants by size classes of the agricultural area (D/l 8) 46
- number of holdings (D/l 8)
- area with temporary grass (D/l 8a)
- area with other forage plants (D/l 8b)
Holdings with livestock
20. - Holdings with livestock (J/01 - J/17) 47
- number of holdings
- number of livestock units
21. - Livestock units by size classes of the agricultural area 4S
- livestock units
- livestock units per 100 ha AA
22. - Holdings with
cattle
by size classes of livestock units (J/02 - J/08) 49
- number of holdings
- livestock units
23. - Holdings with dairy cows broken down by number of dairy cows (J/07) 50
- number of holdings
- number of dairy cows
24. - Holdings with other cows broken down by number of other cows (J/08) 51
- number of holdings
- number of other cows
25. -Holdings with
sheep
broken down by number of sheep (J/09) 52
- number of holdings
-number of sheep
26.-Holdings with goats by number of goats (J/10) 53
- number of holdings
- number of goats
27. - Holdings with
breeding
sows broken down by number of breeding sows (J/12) 54
- number of holdings
- number of breeding sows
28. - Holdings with
broilers
by number of broilers (J/14) 55
- number of holdings
- number of broilers
29. -Holdings with
laying hens
broken down by number of laying hens 56
- number of holdings (J/15)
- number of laying hens
Labour force
30. Agricultural
labour force
57
- family labour force (L/01 - L/03)
- non-family labour force (L/04 - L/06)
=Ξ
eurostat
32. Holders
who are a
natural person
59
-male
-female
33.
Holding managers
60
- by age classes
- by working time
34.
Holding managers
61
-male
-female
35. Holding managers by other gainful activity 62
-male
-female
36. Labour force, excluding non-family labour force that is employed on a non-regular basis by AA size classes.. 63
- number of persons
- annual work units
37.
Labour force,
excluding non-family labour force that is employed on a non-regular basis ESU size classes 64
- number of persons
- annual work units
Farm type
38. Holdings by
farm type
65
- number of holdings
- agricultural area
- total labour force
Specialist field crops (1)
39. Specialist field crops by size classes of the agricultural area 66
- number of holdings
- agricultural area
40. Specialist field crops by economic size classes 67
- number of holdings
- agricultural area
41. Specialist field crops,
number of holdings
68
-by type of cereals
-by type of crops
- by type of set-aside
42. Specialist field crops,
area
69
-by type of cereals
-by type of crops
- by type of set-aside
43. Specialist field crops,
labour force
70
- family labour force (L/01 - L/03) and non-family labour force (L/04 - L/06)
- holders being a natural person
- holders being also the manager
Specialist horticulture (2)
44. Specialist horticulture, by AA size classes 71
- number of holdings
- agricultural area
45. Specialist horticulture, by ESU size classes 72
- number of holdings
- agricultural area
46. Specialist horticulture,
labour force
73
- family labour force and non-family labour force
- holders being a natural person
- holders being also the manager
Specialist permanent crops (3)
47. Specialist permanent crops by size classes of the
agricultural area
74
- number of holdings
- agricultural area
48. Specialist permanent crops by
economic size classes
75
'm
eurostat
- holders being also the manager
Specialist grazing livestock (4)
50. Specialist
grazing
livestock by size classes of the agricultural area 77
- number of holdings
- agricultural area
51. Specialist grazing livestock by economic size classes 78
- number of holdings
- agricultural area
52. Specialist grazing livestock, arable land - other areas 79
- number of holdings
- area
53. Specialist grazing livestock, by type of livestock 80
- number of holdings
- livestock units
54. Specialist grazing livestock, labour force 81
- family labour force (L/01 - L/03) and non-family labour force (L/04 - L/05)
- holders being a natural person
- holders being also the manager
Specialist granivores (5)
55. Specialist granivores by size classes of the agricultural area 82
- number of holdings
- agricultural area
56. Specialist granivores by economic size classes 83
- number of holdings
- agricultural area
57. Specialist granivores, by type of livestock 84
- number of holdings
- number of heads
58. Specialist granivores, labour force 85
- family labour force (L/01 - L/03) and non-family labour force (L/04 - L/06)
- holders being a natural person
- holders being also the manager
Mixed cropping (6)
59. Mixed cropping by size classes of the agricultural area 86
- number of holdings
- agricultural area
60. Mixed cropping by economic size classes 87
- number of holdings
- agricultural area
61. Mixed cropping, number of holdings 88
-by type of cereals
-by type of crops
- by type of set-aside
62. Mixed cropping, area 89
- by type of cereals
-by type of crops
- by type of set-aside
63. Mixed cropping, by type of livestock 90
- number of holdings
- livestock units
64. Mixed cropping,
labour
force 91
- family labour force (L/01 - L/03) and non-family labour force (L/04 - L/06)
- holders being a natural person
- holders being also the manager
Mixed livestock holdings (7)
65. Mixed livestock, by AA size classes 92
- number of holdings
- agricultural area
66. Mixed livestock, by ESU size classes 93
- number of holdings
- agricultural area
'm
eurostat
68. Mixed livestock, by
type of livestock
95
- number of holdings
- livestock units
69. Mixed livestock,
labour force
96
- family labour force (L/01 - L/03) and non-family labour force (L/04 - L/06)
- holders being a natural person
- holders being also the manager
Mixed crops - livestock (8)
70. Mixed crops - livestock by size classes of the
agricultural area
97
- number of holdings
- agricultural area
71. Mixed crops - livestock by economic size classes 98
- number of holdings
- agricultural area
72. Mixed crops - livestock,
number of holdings
99
- by type of cereals
-by type of crops
- by type of set-aside
73. Mixed crops - livestock,
area
100
-by type of cereals
-by type of crops
- by type of set-aside
74. Mixed crops - livestock, by type of livestock 101
- number of holdings
- livestock units
75. Mixed crops - livestock,
labour force
102
- family labour force and non-family labour force
- holders being a natural person
- holders being also the manager
HOLDINGS IN LESS-FAVOURED AREAS
76. - Structure of agricultural holdings 103
- number of holdings, agricultural area, standard gross margin
- land use
77. - Holdings by size classes of the
agricultural area
104
- number of holdings
- agricultural area
78. - Holdings with
cereals
(D/01 - D/08) 105
- number of holdings
- agricultural area
Holdings with livestock
79. Holdings with
livestock
106
- number of holdings
- number of livestock units
80. Livestock units by size classes of the
agricultural area
107
- number of holdings
- livestock units per 100 ha AA
81. - with
cattle
broken down by number of livestock units 108
- number of holdings
- number of livestock units
82. - with
dairy cows
broken down by number of dairy cows 109
- number of holdings
- number of dairy cows
83. - with
other cows
broken down by number of other cows 110
- number of holdings
- number of other cows
84. - with
sheep
broken down by number of sheep 111
- number of holdings
- number of sheep
aa
eurostat
86. - with
breeding sows
broken down by number of breeding sows 113
- number of holdings
- number of breeding sows
87. - with
broilers
broken down by number of broilers 114
- number of holdings
- number of broilers
88. - with
laying hens
broken down by number of laying hens 115
- number of holdings
- number of laying hens
89. Agricultural
labour force
116
- family labour force (L/01 - L/03)
- non-family labour force (L/04 - L/06)
90.
Holders
who are a
natural person
117
- by age classes
- by working time
91. Holdings by
type of farming
118
- number of holdings
- agricultural area
- standard gross margin
HOLDINGS IN MOUNTAIN AREAS
92. - Structure of agricultural holdings 119
- number of holdings, agricultural area, standard gross margin
- land use
93. - Holdings by size classes of the
agricultural area
120
- number of holdings
- agricultural area
94. - Holdings with cereals 121
- number of holdings
-area
Holdings with livestock
95. Holdings with
livestock
122
- number of holdings
- number of livestock units
Labour force
96. Agricultural
labour force
123
- family labour force (L/01 - L/03)
- non-family labour force (L/04 - L/06)
97.
Holders
who are a
natural person
124
- by age classes
-by working time
Glossary 126
Maps
Agricultural area (AA) by holding and by region (NUTS 2) 132
Standard gross margin (SGM) by holding and byregion
(NUTS
2) 133
Standard gross margin per ha of agricultural area by holding and by region (NUTS 2) 134
eurostat
INTRODUCTION
The purpose of the Community farm structure surveys is to obtain reliable data on the structure of agricultural holdings in the
European Union of the Fifteen, particularly as regards land use, livestock farming and labour force.
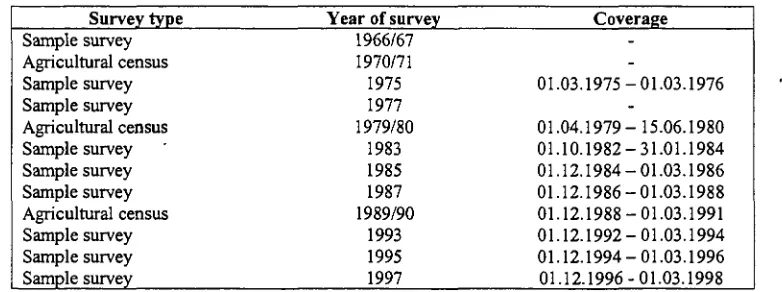
Community structure surveys are carried out regularly at roughly two-yearly intervals, the first being conducted in 1966/67,
followed by surveys in 1970/71, 1975, 1977, 1979/80, 1983, 1985, 1987, 1989/90, 1993, 1995 and 1997. Approximately every
ten years (1970/71, 1979/80 and 1989/90), a full survey is carried out in the form of an agricultural census.
The 1997 farm structure survey was the twelfth in the series of Community surveys and the second for the Community of the
Fifteen. It was carried out as a sample survey in the majority of the Member States, and provides results at regional as well as
national level. Only Belgium, Luxembourg and the Netherlands carried out a full survey.
It should be noted that for some characteristics and some countries, the results of this survey might differ significantly from
those obtained from other sources. The problems inherent in designing multi-purpose samples such as those used in some parts
of the survey on the structure of agricultural holdings make such differences inevitable, especially where characteristics are
relatively uncommon or apply very specifically to specialised holdings. Needless to say, everything possible has been done to
ensure accurate results, and we consider that the tables give a reliable picture of farm structure in the Community.
eurostat
SYMBOLS AND ABBREVIATIONS
Symbols
0.0 data value less than one tenth of half a unit
None
Abbreviations
Ha : hectares
AA : agricultural area
ESU : European size unit (ESU 1= ECU 1200)
LSU : livestock unit
AWU: annual work unit
SGM : standard gross margin
Mill. : million
% : percent
ROUNDING ERROR
In general the figures have been rounded up or down without reference to the total, so the sum of the individual data may differ
from the total.
ADDITIONAL INFORMATION
The main results of the Community's farm structure surveys are published by the Statistical Office of the European
Communities (Theme 5, Series C). At irregular intervals, the Statistical Office of the European Communities publishes special
reports on specific aspects of the Community's agricultural structure.
Further information and suggestions about the Community structure surveys can be addressed to the following address:
Eurostat, Division F-l
Bâtiment Jean Monnet
Rue Alcide de Gasperi
L- 2920 Luxembourg
Tel.: (+352)4301-37229
Fax: (+352)4301-37317
\m
eurostat
METHODOLOGICAL NOTES
1. General
Community farm structure surveys have been carried out at regular intervals since 1966. They provide comparable
data on farm structure in the European Union
Council Regulation (EEC) No 571/88 of 1 December 1988
1) provides the basis for the implementation of the surveys
[image:15.587.105.496.192.338.2]between 1988 and 1997.
Table 1: Community structure surveys, 1966/67 - 1997
Survey type
Sample survey
Agricultural census
Sample survey
Sample survey
Agricultural census
Sample survey
Sample survey
Sample survey
Agricultural census
Sample survey
Sample survey
Sample survey
Year of survey
1966/67
1970/71
1975
1977
1979/80
1983
1985
1987
1989/90
1993
1995
1997
Coverage
-01.03.1975-01.03.1976
-01.04.1979-15.06.1980
01.10.1982-31.01.1984
01.12.1984-01.03.1986
01.12.1986-01.03.1988
01.12.1988-01.03.1991
01.12.1992-01.03.1994
01.12.1994-01.03.1996
01.12.1996-01.03.1998
[image:15.587.43.509.419.805.2]However, in years when an agricultural census was carried out, Member States were allowed to use sample surveys for
certain characteristics (e.g. labour force). Member States, which carried out a full census for national purposes in
sample survey years, were allowed to transmit the results in census format (see Table 2).
Table 2: Survey types used for the 1997 structure survey
Member State
Belgium
Denmark^)
Germany
*)
Greece
Spain
France
Ireland
Italy
Luxembourg
Netherlands
Austria
Portugal
Finland
Sweden
United Kingdom
4)
Survey type
Census
Sample survey
Sample survey
Sample survey
Sample survey
Sample survey
Sample survey
Sample survey
Census
Census
Sample survey
Sample survey
Sample survey
Sample survey
Sample survey
Sampling rate
(in
%)
100.0
41,0
17.5
10.0
3.8
7.8
35.2
3.2
100.0
100.0
16.4
13.0
36.6
35.3
100.0
!
) OJ L 56,2.3.1988, p. 1
im
eurostat
2. Legal basis
A set of regulations, directives and decisions published in the Official Journal of the European Communities provide
the legal basis for the survey on the structure of agricultural holdings. The legal basis governs:
• the organisation of the survey
• the deadlines for ttansmitting survey results to Eurostat
• the list of survey characteristics
• the definitions of the characteristics and of the agricultural products for the survey
• the Community programme of tables to be stored in the Tabular Data Bank (BDT) of the Eurofarm system
• the Community typology for agricultural holdings.
The following documents constitute the legal basis of the 1997 Community structure survey:
Table 3: Legal basis
Description
Organisation of the survey
Transmission of results
Survey characteristics
Definitions
Tabular results
Typology
Legal basis
Council Regulation (EEC)
Commission Decision
Commission Decision
Commission Decision
Commission Decision
Commission Decision
Number
571/88/EEC
97/407EC
96/170/EC
89/651/EEC
97/341/EC
85/377/EEC
Official
Journal
N°
L 56/88
LI 69/97
L 47/96
L 391/89
L 149/97
L 220/85
Date
2.3.1988
18.7.1997
15.2.1996
26.10.1989
20.3.1997
7.6.1985
3. Survey unit and field of observation
3.1 Community farm structure survey
For the purposes of the Community farm structure survey, a holding is defined as a technical-economic unit under
single management engaged in agricultural production.
The field of observation of the Community farm structure surveys extends to the following survey units:
agricultural holdings with a utilised agricultural area of 1 ha or more;
agricultural holdings with an utilised agricultural area of less than 1 ha if they produce on a certain scale for sale or
if their production unit exceeds certain natural thresholds.
Member States may introduce thresholds if certain conditions are met.
3.2 National features
Belgium
All natural and legal persons whose holdings were established in Belgium and who belonged to one of the following
categories on 15 May 1997 are required to provide information:
1. All persons whose main occupation is farming and/or stockbreeding.
2. All persons whose main occupation is market gardening.
3. All persons not mentioned under 1 and 2 who, in addition to other activities, produce crop and animal products on a
commercial basis. Persons doing contract work on holdings are not required to provide information.
4. Penal institutions, boarding schools, convalescent and retirement homes and similar establishments, religious and
other communities, experimental and research establishments, public authorities' cultivation departments which
produce for their own requirements, and holdings attached to educational establishments, provided they have at least
one are of utilised agricultural area (UAA), or keep any of the animals referred to in the questionnaire, whether or
not the products are marketed.
eurostat
6. Persons, firms or establishments whose main or subsidiary activity is to do agricultural or horticultural work for
farmers or market gardeners, or to provide them with agricultural or horticultural machinery or equipment, whether
or not they produce crop or animal products for commercial purposes.
7. Agricultural and horticultural machinery co-operatives.
Denmark
In its field of observation, Denmark includes holdings with a minimum of 5 ha AA or an economic size of at least ECU
4 000 at 1990 prices.
Denmark submitted a sample survey for landuse and livestock. For Labour force characteristics, a sub-sample has been
taken from the first.
Germany
The survey units are holdings:
1. with an utilised agricultural area (UAA) of at least one hectare.
2. with natural production units which correspond to the average annual value of the market production of one
hectare of utilised agricultural area.
The production units that correspond to the average annual value of the market production of one hectare of utilised
agricultural area are as follows:
Land categories
Animal
categories
30 are vineyard (producing or not producing) 8 heads of cattle of any age
30 are orchards (producing or not producing) 8 pigs of any weight
30 are hops 50 sheep of any age
30 are tobacco 200 laying hens
30 are tree nurseries 200 chickens for fattening, broilers and other
30 are fresh vegetables, outdoor chickens
10 are flowers and ornamental plants outdoor 200 geese, ducks and turkeys
1 are cultivation under glass of vegetables for
commercial purposes
1 are cultivation under glass of flowers and
ornamental plants for commercial purposes
1 are aromatic and culinary plants or horticultural
seeds for commercial purposes
Greece
The survey units are agricultural holdings:
1. with an utilised agricultural area (UAA) of at least one stremma (0.1 hectare). Utilised agricultural area includes
arable land, kitchen gardens, permanent pasture and permanent crops.
2. with a utilised agricultural area of less than one stremma (0.1 hectare) provided that the holding has at least 0.5
stremma under glass of vegetables, flowers, ornamental plants or permanent crops, or at least one cow or two
heads of other large livestock, or at least 5 heads of small livestock (sheep, goats or pigs), or more than 50 heads
of poultry, or more than 20 beehives.
Spain
The survey units are agricultural holdings:
1. with an utilised agricultural area of at least one hectare.
2. with an utilised agricultural area of at least 0.2 hectares for the cultivation of vegetables and flowers, crops under
glass, irrigated fruit or nurseries.
\m
eurostat
France
The survey units are agricultural holdings that meet one of the three conditions below:
1. The utilised agricultural area must be one hectare or more.
2. The area under specialised crops must be 20 are or more.
3. There must be a minimum output of one of the following animal species or crops, whatever the area of the holding:
3.1 A minimum number of animals of the following species
1 reproductive male covering females on a regular basis (stallion, bull, ram, boar, he-goat, etc.)
1 breeding mare or mule
1 cow
2 cattle of two years or older
1 breeding sow
6 breeding ewes
6 goats
10 breeding rabbits
100 laying hens
10 beehives
incubation capacity for 1 000 eggs.
3.2 Existence of at least one of the following livestock activities:
horse breeding with at least one breeding mare
fur fanning (mink, coypu, chinchillas, etc.)
game breeding in captivity for slaughter or sale.
3.3 Annual output must amount to:
2 horses for slaughter
5 battery calves
10 sheep for slaughter
10 goats for slaughter
- 5 pigs
200 rabbits for meat
500 poultry for meat
50 force-fed poultry
- 10 000 eggs.
3.4 Existence of a
minimum
area under one of the following crops:
20 are of asparagus
20 are of cabbage for sauerkraut
15 are of strawberries
5 are of fresh vegetables (not for self-consumption)
5 are of flowers or ornamental plants
10 are of vineyards (wine with appellation of origin)
5 are of Champagne vineyards
5 are of nurseries (viticulture, ornamental plants, forestry or fruit trees)
40 single fruit trees yielding fruit
3.5 Actual output in the previous agricultural year of:
2 tonnes of chicory
aa
eurostat
Ireland
The survey units are agricultural holdings with an utilised agricultural area (UAA) of at least one hectare or holdings
engaged in intensive production (e.g. pig and poultry farming)
Utilised agricultural area (UAA) includes:
arable land
areas for the production of silage or hay
permanent pasture and meadow
rough grazings.
Italy
The survey units are agricultural holdings:
with a utilised agricultural area (UAA) of at least one hectare
engaged in livestock farming or combining livestock farming with forestry
with less than 1 hectare of utilised agricultural aTea (UAA) if the marketed output is normally valued at 2 millions
lira or more per farming year.
Luxembourg
The survey units are:
holdings with 1 hectare or more of cultivated area (including arable land, meadows and pastures, kitchen gardens,
fruit and berry plantations, vineyards, nurseries and osiers)
all holders of commercially operated units producing vegetables, fruit or flowers, and owners of nurseries and
osiers, even if the cultivated area is less than 1 hectare
all holders of vineyards with a total area of at least 10 are
all holders of commercial livestock- or poultry-breeding establishments.
The survey does not cover holdings with less than 1 hectare of cultivated area which:
possess woodland and "Lohhecken" (coppice woodland with a high proportion of oak)
keep riding horses
fatten pigs for their own requirements
grow vegetables, strawberries, etc. for their own requirements.
Netherlands
The survey units are holdings with an economic size class of more than 3 NGE (Dutch units of measurement).
These holdings together account for more than 99 percent of total agricultural production.
One NGE is valued at ECU 1 400.
Austria
The survey unit is the holding having:
- a utilised agricultural area (UAA) of at least 1 hectare
- a utilised agricultural area (UAA) of less than 1 hectare if the following minimum thresholds are exceeded :
25 are of commercial vineyards
15 are of orchards
10 are of berries, strawberries, vegetables, flowers or ornamental plants, vine or tree nurseries, 1 greenhouse on
the holding
mushrooms
eurostat
Portugal
The survey unit is the holding having:
an utilised agricultural area (UAA) of at least 1 hectare;
an utilised agricultural area (UAA) of less than 1 hectare if the holding includes one of the following units:
Characteristics
Potatoes, horticultural and floricultural crops, hops, tobacco, seed and
seedlings, vines, orchards, olive groves and nurseries
Flowers and ornamental plants
Greenhouses
Nurseries
Horticultural crops
Intensive horticultural crops
Flowers/pots of flowers for sale
Banana plantations
Seeds and seedlings
Hops
Tobacco
Orchards
Vines
Bulls for rearing
Cows
Bovines of 2 years and older
Pigs for fattening
Breeding sows
Ewes
Goats
Rabbits for breeding
Hens for laying and/or breeding
Beehives
Production during the reference year of:
Cattle
Pigs
Turkeys
Chickens
Ducks
Geese
Guinea-fowl
Continent
50 are
5 are
5 are
5 are
-10 are
-10 are
20 are
20 are
20 are
20 are
1
1
2
3
1
6
6
10
100
10
5
5
250
500
500
250
250
Açores
_
-1 are
-5 are
-5 are
5 are
1
1
2
3
1
6
6
10
100
10
5
5
-500
-Madeire
-1 are
-1 are
-1 are
1 are
1 are
-1 are
1 are
1
1
2
3
1
3
3
10
100
3
5
5
250
500
500
-Finland
The survey covers:
Holdings with at least 1 hectare of utilised arable land
holdings with an economic size class of at least 1 ESU.
Sweden
The survey covers:
holdings with more than 2 hectares of arable land
- holdings with at least 50 milking cows or 250 bovines or 50 sows, or 250 pigs or 50 ewes or 1 000 hens/chicks
(whether or not the holding has arable land)
ΞΈ.
eurostat
United Kingdom
The survey unit is the agricultural holding. The guideline definition is pragmatic and operational and subject to
agreement with the individual farmer. An agricultural holding comprises the land on which agricultural activities are
carried out and which is farmed as one unit, as far as supplies such as machinery, livestock, fodder crops, labour force
and the distance between any separate areas of land and their type of fanning are concerned. The farm business is run
by a fanner, who is a person, a partnership of individuals, a limited company or an institution of some kind. Some
farm businesses occupy more than one holding.
A distinction is made between "main" and "minor" holdings. Only main holdings are covered in the Community
structure survey. Minor holdings are defined differently in England, Northern Ireland, Scotland and Wales.
In
England
and
Wales
a holding is classified as minor if it meets the following five conditions:
the total area of the holding is less than 6 hectares
there is no regular full-time farmer or worker
the estimated annual labour requirement is less than 100 days
the greenhouse area is less than 100 m2
the occupier does not farm any other holding.
In
Northern Ireland
a holding is classified as minor if it meets the three conditions below:
the total area of the holding owned or taken on long-term lease is less than 6 hectares
the economic size (SGM) of the holding is less than ECU 2000 as expressed in 1980 standard gross margins
there is no regular full-time worker other than the owner.
In
Scotland
a holding is classified as minor if it meets the following conditions:
the total area of the holding is less than 1 hectare or the economic size of the holding is less than ECU 2 000 as
expressed in 1980 standard gross margins
there is no regular full-time farmer
the holder does not farm any other holding
the holding is not a large poultry unit.
im
eurostat
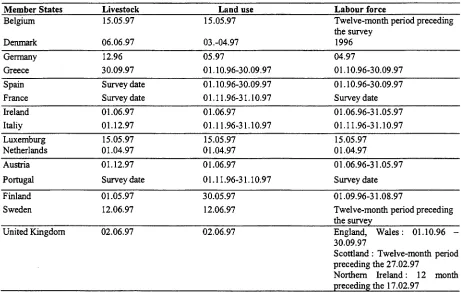
4. Survey date
Council Regulation (EEC) No 571/88 of 29 February 1988
1) lays down the time period for carrying out the 1997 farm
[image:22.587.66.527.164.460.2]structure survey. It states that the 1997 agricultural structure survey shall be carried out in one or more stages in the form
of full or sample surveys between 1 December 1996 and 1 March 1998, covering the crop year conesponding to the crop
to be harvested in 1997.
Table 4: Reference/period
Member States
Belgium
Denmark
Germany
Greece
Spain
France
Ireland
Italiy
Luxemburg
Netherlands
Austria
Portugal
Finland
Sweden
Livestock
15.05.97
06.06.97
12.96
30.09.97
Survey date
Survey date
01.06.97
01.12.97
15.05.97
01.04.97
01.12.97
Survey date
01.05.97
12.06.97
Land use
15.05.97
03.-04.97
05.97
01.10.96-30.09.97
01.10.96-30.09.97
01.11.96-31.10.97
01.06.97
01.11.96-31.10.97
15.05.97
01.04.97
01.06.97
01.11.96-31.10.97
30.05.97
12.06.97
Labour force
Twelve-month period preceding
the survey
1996
04.97
01.10.96-30.09.97
01.10.96-30.09.97
Survey date
01.06.96-31.05.97
01.11.96-31.10.97
15.05.97
01.04.97
01.06.96-31.05.97
Survey date
01.09.96-31.08.97
Twelve-month period preceding
the survey
United Kingdom
02.06.97
02.06.97
England, Wales: 01.10.96
-30.09.97
Scottland : Twelve-month period
preceding the 27.02.97
Northern Ireland : 12 month
preceding the 17.02.97
m
eurostat
5. Sampling plan
Three Member States, Belgium, Luxembourg and the Netherlands carried out a full survey for the 1997 structure survey,
while the remaining Member States did a sample survey.
The table provides an overview of the sampling plans of the various Member States for the 1997 Community structure survey.
SAMPLING PLANS OF THE INDIVIDUAL MEMBER STATES
Member
States '
DK
D
GR
E
F
IRL
I
Ρ
A
FIN
sv
UK
Sampling base
1989 agricultural census, updated by the 199094 sample surveys
Agricultural report 1993
General agricultural and livestock census 1991
1989 agricultural census
1990 agricultural census
Corrected list of agricultural holdings from 1991 survey
1990 agricultural census
1989 agricultural census
Agricultural structure survey 1995
1997 agricultural census
1997 census of agriculture
Sampling method
Stratified random sampling
Combination of systematic and random sample
Multi stage stratified random sampling of area
Stratified random sampling
Stratified random sampling
Combination of systematic and random sampling within strata
Stratified random sampling
Systematic random sampling within strata Random sampling
within strata
Stratified random sampling
Stratified random sampling
Stratified random sampling within strata
Geographical stratification
Counties
By "Lander"
NUTSffl
Autonomous communities
Departements
County (NUTS IV)
19 regions and 2 provinces autonomous
Regions
Bundesländer
Survey districts
England, Wales Scotland Northern Ireland
Other stratification criteria
A ^
Number '
8
20
3
19
9
10
12
17
59 per Bundesland
7
3
9 9 8 6
Description
Economic size class of holding
Size class of UAA
Holding having a specific type of production
Urban character
Principal farm type
Farm type
Size classes of AA : > l h a
1 h a < 2 h a 2 h a < 5 h a 5 ha < 10 ha 10 ha < 20 ha 20 ha < 30 ha 3 0 h a < 5 0 h a 5 0 h a < 1 0 0 h a 100 ha + specialised holdings
Bovines animals: 0 19 1049 50 and more Pigs: 0
1499 500999 1000 and more Sheep : 0249
250499 500 and more
Principal farm type
Combination of size classes of total area and arable area
Type of farming (main and individual types)
Principal farm type
Economic size class of holding
B*>
Number'5·'
12
3
6
17
7
3
3 7
6
11 4
18
40 40
Description
Type of fanning
Lessfavoured areas and others
Size in terms of SGM, AWU, AA, LSU
Economic size class of holding
Size classes of AA 0
>0<l 16 510 1050 50100 100 and more
Size classes of AA
Sizeclasses of livestock
Economic size class of holding
Type of fanning Size of the holding
Type of farming
*)
D=Germany, F=France, UK=United Kingdom, IRL=Ireland, DK=Denmark, GR=Greece, E=Spam, Wtaly, P=Portugal, FIN=Füiland , SV=Sweden
'
A and Β represent independent sampling criteria.
ia
eurostat
6. Community farm structure survey 1997
All Member States apart from Germany sent Eurostat individual data from which the tabular results were compiled.
Germany drew up its own tabular results.
To ensure the confidentiality of individual data, the tabular results are processed before publication.
The data are treated as follows:
- table cells representing fewer than 5 holdings are given a value of zero,
- table cells in which dominance is apparent (where one or two holdings account for at least 85% of the value of the
cell) and which represent fewer than 9 holdings, are given a value of zero.
- the remaining table cells are rounded to the nearest ten.
The overall totals are calculated from the individual data, meaning that they may differ from the totals obtained from
the individual columns.
7. Geographical breakdown
As is the case for all previous sample surveys, the results of the 1997 structure survey are produced at two
geographical levels: for national and regional level. The results of the 1989/90 basic survey, on the other hand, are
available for the regions and districts of each Member State.
8. Community typology for agricultural holdings
From
the
very first survey on the structure of agricultural holdings in 1966/67 it was clear that in order to facilitate and
develop the interpretation of results, a typology was needed to classify holdings into uniform groups according to their
production structure. Such a typology, which was also intended to facilitate comparisons between the different
Member States, could not be based on physical criteria alone, particularly as the link between area and production
capacity was becoming less rigid as a result of the expansion of indoor livestock production.
A typology of this kind has become even more necessary with the development of the common agricultural policy,
since information on specific groups of holdings is very often required. This has led to a rapid proliferation of stadies
and research on Community agriculture, for which homogeneous groups are required for sampling and estimation
purposes.
A Community typology was therefore developed, first of all on an experimental basis for the 1966/67 survey, then on a
new basis as from the 1975 survey. A first holding classification system was established by Commission Decision
78/463/EEC of 7 April 19781) and was used to analyse the 1975, 1977, 1979/80 and 1983 surveys. The system was
revised by Commission Decision 85/377/EEC of 7 June 1985^), and the new typology was applied as from the 1985
survey. Changes to this last Decision were made by Commission Decision 94/376/EEC of 30 May 1994·^) leaving the
typology unaltered. To take into account the measures introduced in the 1992 common agricultural policy reform,
further changes were necessary. Amendments had to be made to the list of survey characteristics. As the list of
characteristics is the basis for the classification of agricultural holdings, it was necessary to amend Commission
Decision 85/377/EEC of 7 June 1985 to take into account the altered list of characteristics. The Decision 85/377/EEC
was therefore amended by Commission Decision 96/393 (EC) of 13 June 1996^), in this context the classification
system was also modified. (See paragraph 8.2).
im
eurostat
8.1 The basis of the Community typology: standard gross margins
Most classification systems for agricultural holdings currently applicable are based on two essential economic
characteristics·, the type of farming and the economic size class of the holding. It is also generally accepted that the
standard used to measure size should be the same as that used for classification purposes, although this is not
compulsory. The Community typology respects both these principles, which are clearly set out in Article 1 of these
Commission Decisions.
There is a wide choice of measuring standards: some classifications are based on labour force requirements, some on
output value, and others on the concept of value-added. The Community typology has opted for a concept close to the
latter: that of gross margin.
Gross margin is the difference between the monetary value of agricultural output (gross output) and the main
proportional specific costs associated with the output concerned. It is therefore an indicator of the potential net income
of the holding, and also has the advantage of not favouring input-intensive types of production.
However, directly measuring the gross margins of each agricultural holding is a very complicated operation,
particularly as a very large volume of data must be processed. Consequently, it was decided to measure the gross
margin indirectly, using standard coefficients calculated by applying uniform definitions in each country. Standard
gross margins (SGM) thus conespond to an average for each type of production within a given region.
The basis for estabhshing the SGM is therefore the value of gross output. This comprises sales, payments in kind,
increases in stocks and the inputs necessary for certain types of production within the holding (intra-branch
consumption). In principle, it is based on ex-farm prices net of VAT.
The products to be considered are not just agricultural products in the strictest sense, but also include packaged and
processed products where packaging or processing generally takes place on the farm in the region in question. The
more advanced the packaging or processing stage of the products leaving the holding, the higher the ex-farm prices and
the costs to be deducted.
In addition to the value of the main products, gross output also includes the value of any by-products and
product-linked subsidies.
Proportional specific costs are costs, which can be directly attributed to a type of production. They therefore exclude
general operating costs, labour, and machinery, buildings and contract work (with a few exceptions).
In practice, the proportional specific costs deducted from gross output are as follows:
- crop production: seeds and planting stock, fertilisers purchased, crop protection products and various specific costs
(water for irrigation, heating, drying, marketing, insurance),
- livestock production: livestock replacement costs, animal feed and various specific costs (veterinary fees, milk
testing, animal selection, heating, marketing, insurance).
The costs of means of production originating on the holding are in principle calculated on the basis of ex-farm prices;
for those purchased on the market the purchase price is used. Calculations are net of VAT, and any input-linked
subsidies are deducted.
The output figure used to calculate SGMs is for a period of 12 months, and the costs involved are those which relate to
this output. However, SGMs are calculated from the arithmetic averages for three calendar or marketing years. Thus,
for example, the SGMs for 1994 are calculated either on the basis of the calendar years 1993, 1994 and 1995 or on the
basis of the marketing years 1992/93, 1993/94 and 1994/95.
SGMs are first calculated in national currency, then converted into ecus using the average exchange rate for the
reference period.
m
eurostat
8.2 Use of standard gross margins
Economic size of holdings
SGMs calculated in this way take account of every hectare and every animal belonging to a holding. The aggregate of
the results obtained for each type of production is used to determine the total standard gross margin of the holding.
This is refened to as the "economic size of the holding".
Economic size is expressed in European size units (ESU). Until 1983 one ESU conesponded to a standard gross
margin of ECU 1 000. For the 1985 survey its value was fixed at ECU 1 100, for the 1987 survey at ECU 1 200 and in
the future it will be adjusted regularly to take account of overall agro-economic trends throughout the Community.
The value of the ESU was ECU 1 200 for the 1989/90, 1993, 1995 and 1997 surveys.
Type
of
farming
In the Commission decisions the type of farming of a holding is determined by the relative contribution of the various
types of production to its total standard gross margin.
This means that for each holding the contribution of each type of animal or crop production to the total standard gross
margin has to be established. The provisions of the decision2) are then applied to the results in order to classify the
holding under a type of farming. For example, if the gross margin for cereals accounts for more than two-thirds of the
total gross margin, the holding will be classified under "cereals".
The classification scheme used has a four-level tree structure:
- Level 1 comprises eight general types of farming, i.e. four types of crop farming (field crops, horticulture, permanent
crops and mixed cropping), three types of animal farming (grazing livestock, granivores and mixed livestock
holdings) and one crop-livestock mix.
- Level 2 comprises 17 principal types of farming, which are subdivisions of the general types of farming. This is the
level at which Community surveys on the structure of agricultural holdings are usually processed and to which most
of the results in this publication refer.
- Level 3 comprises around 50 particular types of farming, which are subdivisions of the principal types of farming.
Structure surveys provide only limited information at this level, which is already very specific, i.e. number of
holdings, total gross margin and utilised agricultural area (UAA).
- The final level is used only by certain Member States to subdivide particular types of fanning that are of importance
to their agriculture.
\m
eurostat
In amending the typology, however, care was taken to maintain the continuity of series wherever possible, particularly
with regard to the principal types of farming. The following table summarises the old and new classifications:
Type of farming
Decision 78/463/EEC
11
12
21
31
32
41
42
43
44
51
52
61
62
71
72
81
82
Decision 85/377/EEC
11
12
20
31
32 + 33 + 34
41
42
43
44
501
502 + 503
601
602 + 603 + 604 + 605 + 606
71
72
81
82
Decision 96/393/EC
13
14
20
31
32 + 33 + 34
41
42
43
44
501
502 + 503
601
602 + 603 + 604+605 + 606
71
72
81
82
8.3 Interpretation of the typology
The Community typology of agricultural holdings allows relatively homogeneous groups of holdings to be constituted,
with the application of identical rules in all Member States. However, a number of problems have to be pointed out, as
to a certain extent they affect the results obtained.
8.4 Non-classifiable d holdings.
Some holdings cannot be classified, as the SGM for each of their production types is zero, meaning that their total
standard gross margin is also zero. The following table gives the number of holdings (in thousands) in each Member
State, which could not be classified for the purposes of the 1987, 1989/90,1993,1995 and 1997 surveys.
Member
State
¡HÜÉ
DK
D
GR
F
IRL
I
τ
■- . | ¡ . % 2 S .
NL
p,'^^"^-'
Ρ
i'^^Ëjj^^SS
Number of classified holdings
(in 1000)
1987
89/90
1993
1995
1997
'~32¿6_
-$S.O
"763
71.0 _ _ 67.]
86.9
81.3
73.8
68.8
63.1
tE*Mj¿
665;L ;:606Í - 566:9-: 5JS,9'
953.3
923.5
819.2 802.4 821.4
1791J6_ 1593.6i:.;l'373:6 J 2 7 7 ^ 1 2 0 Í 2 ;
981.7 1017.0
801.3 734.8
679.5
217.0
170.6 159.5 153.4 147.8
2784.1 2664.6 2488.4 2482.1 2288.8
¿}$&*Z
4Λ
;'; 3.4
132.0
124.8 119.7
rr , . —
635.5
..--..'
:
59
; .3:2
3.0:
113.2 107.9
■'■'■■:■■■;■ -'·''".
8.7 489.0
450.6 416.3
'
'
- "¿
■' ■; :
-' " " - -'
" '*
-88.8
88.0
Non-classified holdings
Number
(in WOO)
1987
^£$2,
5.0
19.0
0.2
1.0
10.2
0
·£
¿■l.V'iË'i·:
4.1
89/90
1993
0.2
0:2
0.0
0.0
_ . M — ; 0 i 0 _
0.0
0.0
12.7,';'
4.8
0.9
0.3
. : :04:νΜΕ11
25.5
34.1
0.0
o:o
0.1
0.2
0.2
■ ■:='■ ' :
-1995
1997
0.2
0.1
0.0
0.0
0:0
ΛΑ
0.2
0.0
12.3
6.0
0.3
0.45
0.3 . 0,1
30.3
26.5
0.Ó
10.1
O.O
0.1
HWHBW
0.2
0.4
0.1
1.6
Percentage
1987
89/90
50.2% 0 . 3 %
0.5 %
. '_
w~îa
-1993
0 3 %
0.0 %
1995
1997
0:4% 0.2%
0.0 % 0.0 %
}Q&% 40%
OÍ33%i
0.0 % 0.0 % 0.0 %
1.1 % 0.8 % 0.4 % L0;% . 0 . 5 %
0.0% 0 . 1 % 0.0%
-
0 . 1 %
, 0 . 5 %
0.4 %
0-1 % '. : ^ - - „ 0-0·%
1.06%
1.4%
1.2% 1.1%
„;.0.7% 0.8% 0.8% 0:9%; 0.7%
0.0 % 0.1 % 0.0 %
0:2%
O:K%0.7 % 0.0 % 0.0 % 0.0 % 0.1 %
^ - w : > ■'■