http://eprints.whiterose.ac.uk/130721/
Version: Accepted Version
Article:
Johnston, R., Rossiter, D., Hartman, T.K. orcid.org/0000-0001-9136-2784 et al. (3 more
authors) (2018) Exploring constituency-level estimates for the 2017 British general
election. International Journal of Market Research, 60 (5). pp. 463-483. ISSN 1470-7853
https://doi.org/10.1177/1470785318778247
Johnston, R. et al, Exploring constituency-level estimates for the 2017 British general
election, International Journal of Market Research, 60 (5) pp. 463-483. Copyright © 2018
The Authors. DOI: https://doi.org/10.1177/1470785318778247
[email protected] https://eprints.whiterose.ac.uk/ Reuse
Items deposited in White Rose Research Online are protected by copyright, with all rights reserved unless indicated otherwise. They may be downloaded and/or printed for private study, or other acts as permitted by national copyright laws. The publisher or other rights holders may allow further reproduction and re-use of the full text version. This is indicated by the licence information on the White Rose Research Online record for the item.
Takedown
If you consider content in White Rose Research Online to be in breach of UK law, please notify us by
For Peer Review
Exploring Constituency-Level Estimates for the 2017 British General
Election
Most opinion polls conducted during British general election campaigns report on each party’s estimated national vote share. Although of considerable interest, these data do not put the spotlight on the marginal seats, the constituencies targeted by the parties for intensive canvassing; these are where the contest for a majority in the House of Commons is won and lost. There have been some polls covering those constituencies as a whole, but very few of individual constituencies so there was very little reporting of the outcome for each party in those individual constituencies. That changed with the 2017 general election, when three analysts published estimates on the internet of each party’s vote share separately for each constituency and with those data predicted which party would win each seat. This paper explores the veracity of those estimates, finding that although in general terms they accurately represented the relative position of each constituency in the share of each party’s votes, nevertheless their estimates of which marginal seats would be won by each were not as accurate. The implications of such polls, especially as their predictive ability is improved, is discussed.
Keywords: opinion polling, constituencies, general elections, Great Britain
Opinion polling is a major feature of British parliamentary election campaigns. Despite some clear failures – to identify the winning party correctly let alone each party’s percentage of the votes (see Sturgis et al. 2016, 2017) – it is widely used by the print and broadcast media, often as their main stories, to chart a campaign’s progress as well as to assess the relative popularity of government and opposition throughout a parliament’s existence (on the polls generally, see the various chapters in Wring et al., 2017). Most of the reported polls relate to the national situation, but a major
innovation during the 2017 general election campaign is a harbinger of a probable future development that could have a major impact in a number of ways.
Although a national picture of each party’s vote share – at the time when the poll was taken and generally used as an indicator of the likely outcome on polling day – is presented by most polls, it is widely appreciated that, important though those shares are as representing each party’s standing, they are not necessarily a good indicator of the number of MPs it is likely to have returned to the House of Commons. Predicting the number of seats a party will get with a given share of the votes is difficult. The interaction of several different geographical factors – the spatial concentration of each party’s supporters and the placing of constituency boundaries, for example (Gudgin and Taylor, 1979) – with a party’s number of votes received can have a major influence on how many seats are won. Most UK election results show both substantial disproportionality in the ratio of seats to votes and bias (see Table 1); with the latter, different parties get a different share of the seats even with the same vote share (Johnston et al., 2001). Further, because of those geographical factors a substantial number of constituencies is almost certain to be won by the strongest party there by a wide majority: the local result is foregone and, save a major inter-election shift in a party’s support, in many seats the national vote share is irrelevant. Elections are determined in a relatively small number of marginal seats, those – no more than about one-fifth of the total – won at the previous contest by only a modest majority and which could be lost with relatively small changes in two or more parties’ vote shares.
For Peer Review
Those marginal seats are the parties’ targets during election campaigns – and increasingly in the months and even years before an election is called and the official campaign commences. Parties now identify which constituencies to target well in advance of the election being called, candidates and their local organisations raise money to finance their efforts to mobilise support among their potential voters (Johnston and Pattie, 2014), and central party organisations focus much of their activity on the voters there – alongside the national campaigns promoting their policies.
While knowing the national situation in likely vote shares is important to party morale and campaign strategy, therefore, tactically the situation in the marginal constituencies is of most interest to parties, especially in the final weeks and days of a campaign when every vote garnered in those locales can be crucial to whether the election is won not only there but also nationally. For this purpose traditional opinion polls are little more than a general guide to the local situation. This was the situation at all elections until relatively recently. Parties – especially well-organised local parties with substantial financial and, especially, human resources – conducted their own (usually face-to-face) canvasses seeking to identify their potential supporters and then encouraged them to vote, but these were rarely comprehensive (parties tend to focus their canvassers in parts of a constituency where they know their potential supporters are concentrated) and unlikely to give a representative sample of the electorate. Many post-election ‘inquests’ involve candidates and their agents reporting that their ‘polling’ suggested they were winning, but when the votes were cast they had lost.
In general, polling organisations – and even the parties’ own private polling – could not fill this lacuna in needed information, though some pollsters, usually with one or more media customers, conducted polls on a sample of voters across all marginal seats, but not individual constituencies. Until the twenty-first century most polling involved face-to-face questioning by interviewers, which was both time-consuming and expensive. Very few constituency parties could undertake large enough polls to get a clear picture of the local situation, and national parties could not afford a large number of polls across all – or even a significant proportion of – their target seats. There were some exceptions to this, largely involving the Conservative party. Before the 2005 general election, Lord Ashcroft – at different times the party’s Deputy Chairman and Treasurer – provided substantial funds to a small number of constituency parties in marginal seats on the basis of their campaigning business plans, and a few used the money to commission local polls (Johnston and Pattie, 2007). This scheme was expanded by him from within Conservative national headquarters in the years leading up to the 2010 election, and again some of the money was used for polling – though in a minority of seats only (Cutts et al., 2012). Before the 2015 election, however, he capitalised on recent
developments in online polling – as a private enterprise independent of the party’s organisational structures – to conduct separate polls in a large number of marginal constituencies (Cowley and Kavanagh, 2015, 242-244; Goot, 2017), visiting some of them on more than one occasion: the results – covering 167 constituencies in total – were all published on the web and subsequent research showed that the information provided had a significant impact on the intensity of local campaigns in the seats that were polled (Hartman et al., 2017; Barwell, 2016).
A major shift took place with the 2017 election. By then, many polling organisations were collecting their information not through face-to-face interviews with a sample of voters selected to provide a nationally representative picture but rather through internet questionnaire instruments directed to a sample of volunteers registered with them as willing respondents. These were not representative samples of the national electorate, but various weighting mechanisms were deployed to provide an approximate representation of the national vote shares. This procedure had several major
advantages over the traditional polling methods – both those involving face-to-face interviews and those with respondents questioned in telephone conversations. It was relatively cheap; large numbers of respondents could be polled in a short period; and because the data were collected 2
For Peer Review
electronically they could be rapidly processed and reported. Results could be released and published within a day of the data being collected, allowing up-to-date estimates of the state of the parties as a campaign proceeded.
For the 2017 election YouGov – a pioneer of online polling – decided to realise the potential of the large amount of data they were collecting (they were polling at least daily) to produce estimates of the likely outcome in each constituency; Lord Ashcroft did the same. By combining recent polling data, they had a substantial amount of information from respondents in most, if not all,
constituencies. These were not representative samples of each constituency’s electorate, but experimentation showed that by combining them with other available data, such as the constituency result at the last election (full details of the methodologies are given below), they could produce reasonable estimates of each party’s likely vote share – and thus of the likely winner – in each seat. Further, as more polling data were obtained those estimates could be updated, allowing them to provide current estimates not only of vote shares but also of the number of seats each party would probably win, rather than those derived from one survey at a particular date. Alongside them, a third set of estimates was produced by an academic – Chris Hanretty: he lacked access to the wealth of contemporary polling data available to the other two, but developed a methodology combining available individual-level data (e.g. from the British Election Study) with a range of other material to produce a further set of estimates for each constituency.
These developments – combining large amounts of polling and other data to produce readily-accessible, freely-available estimates of the likely outcome in each constituency – have considerable potential value, for the media, the parties and their local organisations, and the voters. So how accurate were they? Did they provide reasonable estimates of the outcome by constituency in 2017? This paper presents the results of addressing those questions through analyses of the three sets of estimates compared with the actual outcome.
The Three Methods
Forecasting election outcomes is exceptionally difficult in the UK because of its large number of parliamentary constituencies and First Past the Post (i.e., ‘winner take all’) electoral system. Most pollsters assess vote intentions among likely voters at the national level to determine which party leads the race. Sample sizes for pre-election surveys typically contact between 1-2,000 respondents,1 allowing pollsters to strike an acceptable balance between minimizing sampling error (ca. 3% - though see below) while managing the recruitment costs. Given that there were 650 parliamentary constituencies in the UK at the 2017 General Election, most polls would include fewer than five respondents from each constituency; with such minimal information, it is impossible for them to reliably estimate constituency-level vote shares.
That problem of small subsamples could be tackled by drastically increasing the number of respondents. Before the 2017 election, for example, YouGov polled approximately 7,000
respondents daily—nearly 50,000 per week right up to the eve of the election—about their voting intentions,2 and Lord Ashcroft used responses from about 40,000 individuals per week to feed into his seat projections.3 While a sample of 40-50,000 respondents has a very small margin of sampling error nationally (ca. 1%), the constituency-level subsamples average 60-80, which corresponds to considerably higher degrees of uncertainty (ca. 12%). Even with these large weekly polls, therefore,
1
Polling data are available at UK Polling Report: ukpollingreport.co.uk.
2
Details about the YouGov polling and modelling are available at their website: https://yougov.co.uk/news/ 2017/05/31/how-yougov-model-2017-general-election-works/
3
Details about the Ashcroft polling and modelling are available at his website: http://lordashcroftpolls.com /2017/05/election-2017-ashcroft-model/
For Peer Review
it would take months to accumulate a sufficiently large sample to directly generate reliable
constituency-level vote intentions. The third of the analysts, Hanretty, was not associated with such large-scale daily polling and relied upon data from the 2014-2018 British Election Study Internet Panel (which coincidentally was undertaken by YouGov) combined with all publicly released national pre-election polls to increase the proportion of respondents in each constituency.4
To correct for the high degree of uncertainty due to small subsamples at the constituency scale, YouGov, Ashcroft, and Hanretty all used a statistical method called Multilevel Regression and Post-stratification (MRP), or ‘Mister P’ as it is affectionately known by its users (Gelman and Little, 1997; Ghitza and Gelman, 2013; Park et al., 2004).5 MRP works by combining known geographic and demographic proportions (e.g., age, gender, education, race, and ethnicity) from the UK Census in each constituency, plus the result in each constituency at the previous election, with individual polling responses (Hanretty et al., 2016).6 This allows forecasters to match the vote intentions of different geo-demographic profiles to the proportion of people for each profile in a given
constituency. Constituency-level estimates are thus improved by partially pooling the subsamples with aggregate data from the survey itself, which is known as global smoothing, plus contextual information (e.g., past election outcomes, demographics, population, etc.: Hanretty et al., 2016). The higher the R2 between the constituency-level predictors and true vote shares, the more the
estimates produced from MRP will improve.
Despite the sophisticated methodology, one major concern of the approach adopted by all three analysts relates to the polling data deployed in their models. Most UK pollsters now recruit potential respondents via self-selected internet panels or other non-probability methods; their ‘samples’ are not drawn from the population with equal or known probabilities of selection, which makes it impossible to know for certain whether a given sample will reflect the views of the larger population, regardless of whether post-stratification weights are applied to adjust the final estimates. A task force on online panels for the American Association of Public Opinion Research cautions that pollsters ‘should avoid nonprobability online panels when one of the research objectives is to accurately estimate population values’ (AAPOR, 2010, 5), as these can be unrepresentative of the electorate as a whole; and the British Polling Council’s inquiry into the industry’s 2015 failings raised similar concerns (Sturgis et al., 2016, 2017) – which undoubtedly accounts for the very different constituency-level estimates produced by the three analysts and explored here.
MRP therefore uses local estimates derived from aggregate level survey data—regardless of whether they are representative of the local population—combined with constituency level covariates; this delivers a partial pooling approach designed to provide more accurate constituency estimates of each party’s vote share than the relatively small sub-sample sizes would otherwise generate (Gelman et al., 2017; Wang et al., 2015). The approach’s main disadvantage, however, is that it assumes that the demographics in the surveys matched to contextual covariates are predictive of that particular subgroup whereas if the individuals in the survey have different latent attitudes than is the case for the (local) population which they have been selected to represent, then the
constituency-level estimates can be biased. In general, MRP will provide far better estimates than naïve models, but it is not a panacea to the shrinking response rates that pollsters have recently experienced and their consequential growing reliance on self-selected Internet panels. Furthermore,
4
Details about the Hanretty model are available at his website: http://electionforecast.co.uk/
5
Andrew Gelman refers to the MRP method as ‘secret sauce’ at his website: http://andrewgelman.com /2013/10/09/mister-p-whats-its-secret-sauce/
6
The approach has been used in the health field to predict local behaviours based on combining information from individual surveys and census data about small areas (Twigg et al., 2000); it has been found to work well for some outcomes but not others (e.g., good at cigarette consumption but not so good at alcohol
consumption). 2
For Peer Review
as Buttice and Highton (2013) demonstrate, MRP can produce wildly different results depending on several factors (e.g., the degree to which geographic covariates actually explain variation on the outcome of interest, the ratio of opinion variation across geographic units relative to opinion variation within units, etc.). Because these things are unknown and unknowable, it is difficult to assess the accuracy of these models prior to the event in question. The remainder of this paper thus assesses the performance of the three sets of estimates against the 2017 result to gain some insight into their long-term potential value.
The Baseline
A generally-accepted feature of British general elections is that the national changes between contests in support for each party – especially the two largest that have dominated British politics since 1945 – are reflected in each constituency. The geography of each party’s support is relatively consistent in its topography – the highs and lows are the same at each contest – and the main inter-election change is in that topography’s elevation. A party whose vote share increases nationally between two elections tends to enjoy a comparable experience – with some relatively minor variation – in each constituency, a pattern brought to wide attention by David Butler’s introduction of the concept of uniform swing (e.g., see Butler and Stokes, 1974; for a comprehensive review see Butler and Van Beek, 1990) and his refinement of the ‘swingometer’ (invented by Peter Milne for the 1955 general election7) has been used in media presentations (especially by the BBC) in election night broadcasts, plus other discussions of the changing geography of party support.
Given that general pattern, it is relatively straightforward to predict the outcome across the constituencies at one election from the result at the previous contest with considerable accuracy – assuming that constituency boundaries were not redrawn in the interim. Such a prediction forms the baseline for the current exploration; if the poll-based estimates are of value, they should predict the outcome better than the result of the previous contest because they are able to identify variations from the uniform swing and point to the constituencies where a relatively-unanticipated shift is occurring. That baseline is presented here, with separate analyses for England and Wales and for Scotland, reflecting the very different party composition of votes cast in the latter compared to the former in both 2015 and 2017. (The analysts did not provide estimates for Northern Ireland’s eighteen constituencies.) For England and Wales the focus is on support for the Conservative and Labour parties, who dominated the 2017 outcome with 87 per cent of the votes cast there, winning 559 of the 573 seats, though the results for the Liberal Democrats are included; for Scotland, the performance of all four large parties is analysed.
Table 2 reports the results of linear regressions for each party, with its 2017 vote share as the dependent variable and its 2015 share as the independent, across all constituencies in the relevant countries. The r2 values (the squared correlation coefficients indicating the proportion of the variation in the dependent variable accounted for by that in the independent) are all very high, indicating a very close fit – as illustrated in Figure 1 for the Conservative and Labour parties in England and Wales. Only one r2 value is less than 0.80 – for the SNP, which experienced not only a substantial loss of support between the two elections (as indicated by the relatively small b
coefficient in the regression equation) but also considerable geographical variation in that decline – as illustrated by Figure 2.
For the great majority of constituencies in all three countries the result in 2017 could have been readily predicted from the outcome two years earlier, therefore. Could the analysts’ estimates for the later election outperform those predictions, especially for the constituencies lying some distance
7
For example, see https://www.telegraph.co.uk/news/general-election-2015/11511608/Meet-the-man-who-invented-the-Swingometer.html.
For Peer Review
from the regression lines (as in Figure 1) where a party’s performance was substantially better or worse in 2017 than in 2015?
The Analysts’ Estimates
England and Wales
Table 3 reports regressions comparable to those in Table 2, except that the independent (predictor) variables are each of the three analysts’ predictions of the relevant party’s share of the votes cast in 2017. In general, the r2 values indicate that they out-predicted the baseline models, although there are instances where this is not the case. For instance, Hanretty’s r2 was lower than the baseline models predicting the Conservatives and Labour performance (by 4 and 2 percentage points, respectively) than when the predictor variable was 2015 performance.
An initial conclusion, therefore, is that the analysts’ methods were better at estimating each party’s performance across constituencies in England and Wales than was simple reliance on the result of the previous election, only two years earlier. It is probably more accurate to claim they were slightly better, however, in that the baseline models correctly predicted between 82 and 95 per cent of the variation in the 2017 outcome. Nevertheless, at first glance the analysts’ methods appear superior.
A caveat to that conclusion is indicated by the graphs in Figure 3, however, which show each set of estimates for the Conservative and Labour performances against the actual outcomes. (On these graphs the diagonals are not regression lines; they indicate equality where the predicted and actual values should be the same.) Although in all six cases the points representing the individual
constituencies are clustered along a diagonal trajectory indicative of a close fit to regression lines (those in Table 3), their positions relative to the line indicating equality between the two values raise some problems. With YouGov’s estimates, for example, there is a clear tendency for the 2017 Conservative vote share to be under-estimated where that share is high (i.e., most of the points where the estimated value is 40 per cent or more are above the diagonal), whereas it is over-estimated where the Conservative share is relatively small (i.e., most of the points where the estimated value is less than c.30 per cent are below the diagonal). A similar pattern is even clearer in the graph for Labour; its performance is under-estimated, substantially so in some constituencies, where it obtained half or more of the votes cast.8
With Ashcroft’s estimates, the graph for the Conservatives shows that, although again there is a tight fit to a diagonal trajectory, in the great majority of constituencies the party’s performance was under-estimated – in almost every seat where the estimated percentage was less than 40. For Labour, on the other hand, apart from some constituencies where the actual percentages were below 20, the party’s performance was quite considerably under-estimated, especially where Labour won more than half of the votes. Hanretty’s estimates are more widely scattered around the
equality diagonal line for the Conservatives (consistent with the lower r2 value for his estimates compared to the other two), but with an even division above and below that line. For Labour, on the other hand, like Ashcroft he considerably under-estimated Labour’s performance across virtually all constituencies.9
8
One probable reason why the Conservative and Labour vote shares are over-estimated in many constituencies is that polls – and especially internet polls based on non-representative samples – almost invariably under-estimate the number of non-voters. This may particularly be the case in safe seats where the incentive for less-committed voters to turn out is smaller than in marginal seats.
9
One problem that analysts had to face in estimating the 2017 outcome relative to that in 2015 was not only the very substantial decline in support for UKIP between the two contests (it won 12.6 per cent of the votes at the first of those elections but only 1.8 per cent at the second). In general, the Conservatives were the main 2
For Peer Review
Although, as the regression equations in Table 3 indicate, each set of estimates is closely related to the actual outcomes, therefore, inspection of the graphs suggests that while the ordering of the parties in terms of their relative vote shares is accurately predicted, the actual shares may not be. This can introduce problems of interpretation – particularly of which party is going to win each seat, to which we return in a later section.
Scotland
The 2017 election saw a considerable shift in support for two of the four parties compared to their 2015 performance: the SNP’s vote share fell from 50 to 37 per cent while the Conservatives’ almost doubled from 15 to 29; Labour’s share increased slightly – from 24 to 27 per cent – and the Liberal Democrats’ fell by one point to 7. Given that volatility, how accurate were the analysts’ estimates of the result in each constituency?
Table 4 indicates that they were comparable to their success rate in England for the Conservative, Labour and Liberal Democrat parties, with all but one of the r2 values exceeding 0.85: YouGov performed best overall and Hanretty least well. But they were much less successful in estimating the SNP’s performance. That varied considerably across the 59 constituencies, with a mean decline in support of 13.1 percentage points and a standard deviation of 3.9 points; whereas the fall in support was less than 10 points in seventeen constituencies it was over 15 points in twenty-six others. The analysts’ models were clearly less able to handle such a substantial change and its spatial variability (see also Johnston et al., 2017).
Which Seats Would Be Won and Lost?
Although the analyses reported so far suggest considerable success for the analysts’ modelling, one aspect of their estimates – emphasised by the graphs in Figure 3 – raises queries regarding their utility. Although they can predict each party’s relative success in getting vote share in every constituency with considerable accuracy (though less so for the SNP) – i.e. they can put the
constituencies in the right order – can they successfully predict which party will win each seat? Given that for most constituencies the winner is usually certain – Great Britain has relatively few marginal seats and their number has been declining recently (Curtice, 2015, 2018) – the real value of the estimating procedures will be whether they can successfully identify trends in the marginal seats where uncertainty regarding the outcome is the norm and canvassing most intense.
Table 5 provides an overview of each analysts’ ‘success rate’. YouGov correctly estimated the winning party in 93.3 per cent of the 631 constituencies in Great Britain (the 632nd, Buckingham, which was being defended by the incumbent Speaker, is excluded) as did Ashcroft in 87.8 per cent and Hanretty in 85.6. Both Ashcroft and Hanretty were much less successful in predicting which seats would be won by Labour rather than the Conservatives than was YouGov; Ashcroft predicted that the Conservatives would win 355 seats, for example, as against their actual total of 317.
Labour-Conservative Marginals in England and Wales
To explore these predictions further, the three graphs in Figure 4 focus on the Labour-Conservative marginals in England and Wales, which Labour won or lost in 2015 by a margin of 10 percentage points or less: that margin is shown on the horizontal axis with the 2017 margin on the vertical axis. Each graph is divided into four quadrants: to the right of the zero point on the horizontal axis are the beneficiaries of this collapse in UKIP support, especially in those seats where UKIP failed to field a candidate in 2017 (it fielded 378 in 2017 compared to 558 two years earlier): see Johnston et al. (2018).
For Peer Review
constituencies won by Labour in 2015, whereas to the left are those won by the Conservatives; above the zero point on the vertical axis are those won by Labour in 2017, whereas below it are those won by the Conservatives. The constituencies shown as red circles are those predicted to be won by Labour and which it won; the blue squares are those both predicted to be and actually won by the Conservatives: these two groups form the correct predictions. The green upward pointing triangles indicate constituencies Labour was predicted to win but lost to the Conservatives; and the orange downward-pointing triangles are seats that Labour won but the Conservatives were
predicted to.
There is a clear difference between the three analysts in their predictive ability in these crucial seats. Of the 85, YouGov correctly predicted which party would have the largest vote share in 68: in the upper-right quadrant it wrongly predicted only one constituency as a Conservative rather than a Labour victory, but in the lower-right it correctly identified only two of the five Labour-held seats captured by the Conservatives in 2017. In the lower-left quadrant it wrongly predicted that ten Conservative-held seats would switch to Labour, while correctly predicting that the Conservatives would retain the other twelve; and in the upper-left quadrant it wrongly predicted three very narrow Labour victories in Conservative-held seats but correctly identified the seventeen that would change hands.
By contrast to YouGov’s relative success Ashcroft’s predictions were correct in only 53 constituencies and Hanretty’s in 42. In both cases this reflects their general under-prediction of Labour’s 2017 vote share in almost all constituencies.
Who Would Win in Scotland?
The substantial decline in the SNP’s support varied substantially across the 59 constituencies there, as did the increase in support for the other three parties. As such, prediction of which seats would change hands was likely to be difficult, unless the local polling data clearly identified the local trends there – a problem exacerbated by the closeness of the result in many constituencies:10 the SNP won in eight with a majority of less than one percentage point and by between one and five points in a further seven.
The graphs in Figure 5 indicate the extent of the analysts’ relative failure. All three identified only one of the seven seats won by Labour – which in each case was the seat it won in 2015 and then held in 2017; none of its six gains were predicted. The Conservatives also won a single seat in 2015, but 13 in 2017: YouGov correctly predicted seven of them, Ashcroft five and Hanretty four. And the Liberal Democrats increased their tally from one to four: YouGov correctly predicted three of them (i.e. two of the gains); Hanretty only correctly predicted that the party would retain the seat won in 2015; and Ashcroft got none of the four correct. The result, as the graphs show, was that each analyst substantially over-estimated the SNP’s seat total, by 12, 16 and 16 seats respectively.
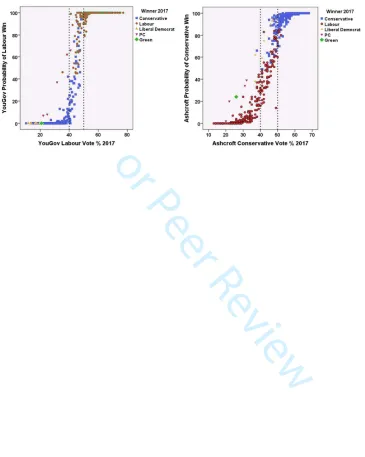
Probabilities
Because each of the analysts’ procedures involves statistical modelling, their estimates of each party’s vote share have associated confidence intervals – from which they can also calculate the probability of a party winning each seat. YouGov showed those confidence intervals graphically on
10
It is likely that there was some tactical voting with those opposed to the SNP (and in particular its advocacy of another independence referendum) choosing to vote for that party among the other three – i.e. those supporting the union – with the best chance of victory in their constituency. Picking up such variations would probably be difficult with relatively small polling numbers in each constituency and/or unless the modelling included variables to cover the tactical situation.
For Peer Review
its website,11 but didn’t show the probabilities. (These were provided to us by them, however.) Ashcroft didn’t publish the confidence intervals but did show the victory probabilities;12 Hanretty published both.13
The probabilities of a party winning a seat provide a further, more nuanced, picture of how well the analysts predicted the outcome in individual constituencies. Figure 6 provides two examples of those probabilities, according to the predicted vote percentage for the relevant party in England and Wales. Each shows a clear relationship; the larger a party’s predicted vote share the larger the probability of it winning the seat. In the first example, in almost all constituencies where YouGov predicted that Labour would win 50 per cent of more of the votes it was not surprisingly shown as virtually certain to win the seat (i.e. a probability of 100). Between 40 and 50 per cent there was a very steep decline in the probabilities, and with less than 40 per cent the probabilities were extremely low. (In two of the exceptions, probabilities of c.40 and c.60 were assigned to seats that Labour did win; the other was a Plaid Cymru victory.) In the second example – Ashcroft’s predictions of Conservative victories – the decline in probabilities where the predicted vote share falls below 50 per cent is slightly less steep than in the first example, but the general pattern is the same; among the few exceptions of a probability of a Conservative victory being assessed as greater than 20 are three of Plaid Cymru’s four victories and the Greens’ single success.
Table 6 summarises the pattern of probabilities according to whether a party won or lost the seat. For the Conservatives there is a clear difference between YouGov and the other two analysts. Whereas in no seats for which YouGov gave a probability of a Conservative victory of over 75 was that seat won by another party, both Ashcroft and Hanretty predicted a Conservative victory with a probability of 75 or greater in seats that were lost. The corollary of this was that both Ashcroft and Hanretty had many more probabilities below 75 than YouGov in seats that Labour won – a
consequence of the former pair both substantially under-estimating Labour’s performance in many seats (Figure 2). YouGov was also better at predicting Liberal Democrat victories than the other two; in addition, Ashcroft’s modelling allocated a probability of less than 40 to each of Plaid Cymru’s four victories.
Each graph in Figure 6 shows that where the probabilities are between c.50 and c.80 there is considerable variation in whether the designated party won the seat or not, which again puts the focus on the marginal constituencies – the subject of Figure 7. Its three graphs concentrate on the Labour-Conservative marginals in England and Wales, showing each analyst’s probability of a Labour victory and the actual winner.14 Five Labour-held marginals were won by the Conservatives in 2017. YouGov gave each a lower probability of a Labour win than it did for a majority of those marginals, but it gave similar relatively low probabilities for eight other seats which Labour nevertheless won again. Consistent with their under-estimation of Labour’s performance across all constituencies, Ashcroft and Hanretty produced few high probabilities of Labour winning again in marginal seats that they held in 2015. Ashcroft gave lower probabilities of Labour victories in four of the five seats that were captured by the Conservatives in 2017, suggesting that his polling and modelling picked up the substantial anti-Labour shifts there. Hanretty, on the other hand, did not; he gave lower
probabilities of a Labour victory to several other seats – most of them won by Labour in 2015 by smaller margins than was the case in the seats lost to the Conservatives.
11
See, for example, https://yougov.co.uk/uk-general-election-2017/ (accessed 9 November 2017)
12
https://dashboards.lordashcroftpolls.com/Storyboard/RHViewStoryBoard.aspx?RId=%c2%b2&RLId =%c2%b2&PId=%c2%b1%c2%b4%c2%bb%c2%b5%c2%b6&UId=%c2%b4%c2%b9%c2%b9%c2%b9%c2%bc&RpI d=2 (accessed 9 November 2017)
13
http://electionforecast.co.uk/ (accessed 9 November 2017)
14
In almost every case, the probability of a Conservative victory in each of those seats according to all three analysts was (100 – Labour probability).
For Peer Review
Turning to the Conservative-held marginals (to the left of the vertical lines in the graphs), YouGov clearly identified most of those where the Conservatives won again in 2017 – the probability of a Labour victory being less than 40 in many cases, with Labour winning none of those with such low odds. Most of those given high probabilities of Labour success were captured from the
Conservatives, but of the ten seats for which the probability of Labour winning was between 60 and 80, five were retained by the Conservatives and five lost. Ashcroft gave a probability of a Labour success of more than 40 in very few, and of 60 or more in none – all of those with a probability of 45 or greater were Labour victories. Those to which he gave low probabilities (less than 20) were mostly retained by the Conservatives, but for constituencies with probabilities in the middle range (20-40 in this case), as with YouGov, as many were retained by the Conservatives as were lost to Labour. With very few exceptions, all of Hanretty’s probabilities for these seats were less than 20 – most of those seats in the exceptional category were lost to Labour – and there was no distinction between the seats that the Conservatives retained or lost.
Figure 8 shows all 59 Scottish constituencies according to the SNP’s performance in 2015 plus each analyst’s estimated probability of it winning there again in 2017. The SNP retained most of the seats where it gained a majority of the votes in 2015 – i.e. those to the right of the 50 per cent vertical line on the graphs. All three analysts accurately predicted which seats the SNP would very likely lose: no seat given a probability of an SNP victory of 40 or less was retained; and all of the seats that the SNP retained, having won them with between 40 and 50 per cent of the votes in 2015, were given relatively high probabilities. Ashcroft and Hanretty were somewhat more successful than YouGov in assigning slightly smaller probabilities of the SNP losing seats to either the Conservatives or Labour.15
Conclusions
These first exercises in predicting the likely outcome in each constituency at a British general election were, not surprisingly, mixed in their success. Their goal was to combine data on the outcome in each place at the previous election with, suitably modified, contemporary polling and other data to identify local trends in support for the parties, from which they could derive estimates of the likely winner. In aggregate, they demonstrated considerable success, getting the overall pattern right, although in some cases either over- or under-predicting one or more party’s performance – either across all constituencies or in a substantial portion of them. But when the focus is on the marginal constituencies, where elections are won and lost, the picture is rather more mixed. In England and Wales some local trends, of constituencies that deviated from the national pattern of change, were correctly identified, but others were not. In Scotland, where there was a large drop in support for the largest party, to the benefit of different opponents depending on the local situation, identifying those local variations was difficult.
Some of the reasons for those difficulties are clear. For example, Hanretty’s under-prediction of Labour’s performance in most constituencies undoubtedly reflects the lack of contemporary polling data that would have identified the swing to the party in the campaign’s final weeks. Ashcroft also under-predicted Labour’s performance in most constituencies, which may reflect either or both of the ability of his polls to pick up the late swing to Labour and insufficient weight being given to the most recent polls in producing his final estimates. Whatever the reason, in both cases that under-prediction had a significant impact on their ability to forecast correctly which party would win in a substantial number of marginal constituencies.16
15
The correlations across the three sets of probabilities are fairly low, accounting for only between 68 and 75 per cent of the variation; each analyst’s procedure produced quite different estimates.
16
It is of interest to note that although the exit poll conducted for BBC/ITV News/Sky News was extremely accurate in its prediction of the national share of the seats (based on an estimate of the national vote share 2
For Peer Review
Such deficiencies are far from insuperable and could be readily overcome by changes to the procedures, which could be tested with the data obtained for 2017 – by different weighting of the polling data obtained close to the election date, for example – prior to applications at the next general election. Other changes are possible, such as over-sampling in marginal constituencies, and will undoubtedly be considered in preparations for that next general election – at which other pollsters and analysts may well also offer constituency-level predictions. Undoubtedly, the results of these 2017 experiments will be assessed favourably by those involved; although their predictions were not all correct, their methods – to a greater or lesser extent – indicate that producing accurate estimates of the likely outcome in each constituency is a promising enterprise, and one that would not be very expensive, given its reliance on available data plus contemporary polls that would be conducted in any case.17 Of course, just because the MRP forecasting method has proved relatively successful in this instance does not necessarily mean that it will work well in future contests; only time will tell.
One issue not addressed here – in large part because of the absence of the needed data – is whether the method can pick up short-term trends. The predictions analysed here were those published at the end of the campaign – by the two analysts who were regularly updating their databases. They are of interest for analyses after the event, but of greater interest are the data produced during the campaign. If they can identify those constituencies, especially marginal ones, that are deviating from the national trends in the weeks before polling day, they could be of very great value to the parties and their candidates, and also to local voters.
Constituency-level predictions produced by MRP-based methodologies, and perhaps by others too, are likely to be more sophisticated and accurate in the future (something that can be established to a considerable extent by reworking the data obtained in 2017). Parties, local and national, will find them of immense value, as also will the media – and local campaigns, plus the national contributions to them, will be influenced accordingly. One associated problem, however, will be transmitting estimates that have confidence intervals associated with them. The tradition has developed with British polling and its media reportage that all percentages reported – Labour’s likely share of the vote total, for example – have a plus-or-minus three percentage points error. This figure was developed when polls were based on nationally representative samples of electors and was in any case no more than a simple rule of thumb then. With non-representative, non-probability samples being the basis for most contemporary polls, it is totally irrelevant – as shown by the very different error bands on the YouGov website estimates of constituency vote shares.18 Of course, with Bayesian modelling those credible intervals – usually termed error bands or confidence intervals – may be asymmetrical around the estimated value. Thus, the main disadvantage of MRP—and in fact, nearly all UK polling—is over-reliance on non-probability samples, which means that knowing whether the demographic profiles from these data are predictive of their respective subgroup is impossible prior to the event. In short, MRP is a powerful tool, but it is not a panacea.
The downside of the impact of this additional information could well be that it further skews the geography of election campaigning in Great Britain. As parties have become increasingly focused on
that was not published) it too predicted the wrong winner in a number of constituencies. (We are grateful to Colin Rallings for giving us access to those probabilities.)
17
Most pollsters have a standard set of questions asked every time they are in the field, with additional questions to address particular issues, perhaps at their customers’ request. Those standard questions, for which they assemble a large number of answers over an election campaign, are the basis for the exercises discussed here.
18
This point was strongly made by Michael Thrasher in oral evidence to the House of Lords Select Committee on Political Polling and Digital Media on 31 October 2017.
For Peer Review
their target marginal constituencies, so large swathes of the country and very significant segments of the electorate find that they are virtually ignored during campaigns. They may get a copy of each candidate’s election leaflet (though large numbers report that they do not), but their support will not be canvassed in any other way and there may be little public evidence that an election is taking place – few, if any, posters, for example. Increasingly activity will concentrate on voters in the marginal seats, especially those where the polls suggest there is a shift in voter preferences that a party will want to capitalise on. Voters elsewhere will still be subject to the national campaigning through the media, but they will be excluded from anything else – not disenfranchisement but disregard.
The evidence from the 2017 exercises suggests that constituency-level predictions of party vote shares and likely winners will move to the centre of campaigning activity. Some local parties and their candidates have for some time been campaigning on the message that ‘only we can defeat party x here’, (party x being the incumbent), but usually without very convincing evidence to sustain their cause: now they can have it – and will want it. Just as internet polling came to dominate elections in the provision of evidence for campaigns in the first two 21st century decades, so constituency estimates will come to the fore in the 2020s. Desirable or not, parties and the electorate will have to accommodate them: the tide cannot be turned. And if they become more accurate than in this first exercise, and can accurately predict trends as they emerge, their influence will be profound.
For Peer Review
References
American Association of Public Opinion Research (2010) AAPOR Report on Online Panels. Oakbrook Terrace, IL: American Association of Public Opinion Research – available at
https://www.aapor.org/AAPOR_Main/media/MainSiteFiles/AAPOROnlinePanelsTFReportFin alRevised1.pdf.
Barwell. G. (2016) How to Win a Marginal Seat: My Year Fighting for My Political Life. London, Biteback Books.
Battaglia, M. P., Hoaglin, D. C., & Frankel, M. R. (2009). Practical Considerations in Raking Survey Data. Survey Practice, 2, Retrieved 12 April 2018 from https://surveypractice.scholasticahq. com/article/2953.pdf.
Butler, D. & Stokes, D. E. (1974) Political Change in Britain: the Evolution of Electoral Choice. London, Macmillan.
Butler, D., & Van Beek, S. D. (1990). Why not swing? Measuring electoral change. PS: Political Science & Politics 23, 178-184.
Buttice, M. K. & Highton, B. (2013) How does multilevel regression and poststratification perform with conventional national surveys’. Political Analysis 21, 449-467.
Cowley, P. & Kavanagh, D. (2015) The British General Election of 2015. Basingstoke, Palgrave Macmillan.
Curtice, J. (2015) A return to normality? How the electoral system operated. In A Geddes and J. Tonge (eds.) Britain Votes 2015. Oxford: Oxford University Press, 25-40.
Curtice, J. (2018) How the electoral system failed to deliver - again. In J. Tonge, C. Leston-Bandeira and S. Wilks-Heeg (eds.) Britain Votes 2018. Oxford: Oxford University Press, 29-45.
Cutts, D. J., Johnston, R. J., Pattie, C. J. & Fisher, J. (2012) Laying the foundations for electoral success: Conservative pre-campaign canvassing before the 2010 UK general election. Journal of Elections, Public Opinion and Parties 22, 359-375.
Fieldhouse, E., Green, J., Evans, G., Schmitt, H., van der Eijk, C., Mellon, J. & Prosser, C. (2017) British Election Study 2017 Constituency Results file, version 1.0. Retrieved on 6 April 2018 from http://www.britishelectionstudy.com/data-object/2017-bes-constituency-results-with-census-and-candidate-data/
Gelman, A. & Little, C. T. (1997) Poststratification into many categories using hierarchical logistic regression. Survey Methodology 23, 127-135.
Gelman, A., Goel, S. Rothschild, D. & Wang, W. (2017) High frequency polling with
non-representative data. In D. Schill, R. Kirk and A. E. Jasperson (eds.) Political Communication in Real Time: Theoretical and Applied Research Approaches. London: Routledge,
Ghitza, Y. & Gelman, A. (2013) Deep interactions with MRP: election turnout and voting patterns among small, electoral subgroups. American Journal of Political Science 57, 762-776.
Goot, M. (2017) What the polls polled: towards a political economy of British election polls. In D. Wring, R. Mortimore & S. Atkinson (eds.), Political Communication in Britain: Polling, 2
For Peer Review
Campaigning and Media in the 2015 General Election. Basingstoke, Palgrave Macmillan, 77-112.
Gudgin, G. & Taylor, P. (1979) Seats, Votes and the Spatial Organisation of Elections. London, Pion (reprinted by ECPR Press, Colchester, 2012).
Hanretty, C., Lauderdale, B. & Vivyan, N. (2016) Comparing strategies for estimating constituency opinion from national survey samples. Political Science Research and Methods, doi 10.1017/psrm.2015.79
Hartman, T. K., Pattie, C. J. & Johnston, R. J. (2017) Learning on the job? Adapting party campaign strategy to changing information on the local political context. Electoral Studies 49, 128-135.
Johnston, R. J., Pattie, C. J., Dorling, D. & Rossiter, D. J. (2001) From Votes to Seats: the Operation of the UK Electoral System since 1945. Manchester: Manchester University Press.
Johnston, R. J. & Pattie, C. J. (2007) Conservative constituency parties’ funding and spending in England and Wales, 2004-2005. The Political Quarterly 78, 392-411.
Johnston, R. J. & Pattie, C. J. (2014) Money and Electoral Politics: Local Parties and Funding in General Elections. Bristol, The Policy Press.
Johnston, R. J., Pattie, C. J., Hartman, T. K., Manley, D., Rossiter, D. J. & Jones, K. (2017) Scotland’s electoral geography differed from the rest of Britain’s in 2017 (and 2015) – exploring its contours. Scottish Geographical Journal doi 10.1080/14702541.2017.1409362.
Johnston, R. J., Jones, K. and Manley, D. (2018) Geographies of Brexit and its aftermath: voting in England at the 2016 referendum and the 2017 general election. Space and Polity,
Lauderdale, B. E., Bailey, D., Blumenau, J. & Rivers, D. (n.d.). Model-based pre-election polling for national and sub-national outcomes in the US and UK. Retrieved 5 April 2018 from http://benjaminlauderdale.net/files/papers/mrp-polling-paper.pdf.
Park, D. K., Gelman, A. & Bafumi, J. (2004) Bayesian multilevel estimation with poststratification: state-level estimates from national polls. Political Analysis 12, 375-385.
Sturgis, P., Baker, N., Callegaro, M. Fisher, S., Green, J. Jennings, W., Kuha, J. Lauderdale, B. & Smith, P. (2016) Report of the Inquiry into the 2015 British General Election Opinion Polls. London, Market Research Society and British Polling Council.
Sturgis, P., Baker, N., Callegaro, M. Fisher, S., Green, J. Jennings, W., Kuha, J. Lauderdale, B. & Smith, P. (2017) An assessment of the causes of errors in the 2015 UK General Election opinion polls. Journal of the Royal Statistical Society: Series A, doi 0964-1998/17/181000.
Twigg L., Moon G. & Jones K. (2000) Predicting small-area health-related behaviour: a comparison of smoking and drinking indicators. Social Science and Medicine 50, 1109–20.
Wang, W., Rothschild, D., Goel, S. & Gelman, A. (2015) Forecasting elections with non-representative polls. International Journal of Forecasting 31, 980-991.
Wring, D., Mortimore, R. & Atkinson, S. (eds.) Political Communication in Britain. Polling, Campaigning and Media in the 2015 General Election. Basingstoke, Palgrave Macmillan. 2
For Peer Review
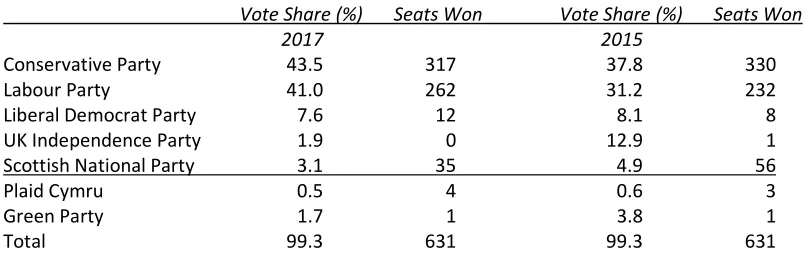
Table 1. Vote share and seats won at the 2017 and 2015 UK General Elections in Great Britain
Vote Share (%) Seats Won Vote Share (%) Seats Won
2017 2015
Conservative Party 43.5 317 37.8 330
Labour Party 41.0 262 31.2 232
Liberal Democrat Party 7.6 12 8.1 8
UK Independence Party 1.9 0 12.9 1
Scottish National Party 3.1 35 4.9 56
Plaid Cymru 0.5 4 0.6 3
Green Party 1.7 1 3.8 1
Total 99.3 631 99.3 631
Notes: Results from the constituency contested by the Speaker of the House have been excluded. Data from the British Election Study Constituency Results file v1.0.
For Peer Review
Table 2. Regressions of the 2017 vote share for each party against its 2015 share at the constituency scale.
a b2015 r2
England and Wales
Conservative 7.65 (0.63) + 0.94 (0.02) 0.87
Labour 9.49 (0.37) + 1.02 (0.01) 0.95
Liberal Democrat -0.52 (0.21) + 0.99 (0.02) 0.82 Scotland
Conservative 11.09 (1.27) + 1.15 (0.08) 0.80
Labour 3.86 (1.44) + 0.97 (0.06) 0.85
Liberal Democrat 0.85 (0.74) + 0.80 (0.05) 0.80
SNP 8.13 (2.37) + 0.58 (0.05) 0.73
For Peer Review
Table 3. Regressions of each party’s constituency vote share at the 2017 general election in England and Wales against the predictions of the three analysts.
a b2015 r2
Conservative
YouGov -4.05 (0.52) + 1.16 (0.01) 0.94
Ashcroft -5.49 (0.48) + 1.09 (0.10) 0.95
Hanretty 2.27 (0.82) + 0.93 (0.02) 0.83
Labour
YouGov -4.80 (0.44) + 1.17 (0.01) 0.96
Ashcroft -2.94 (0.48) + 1.22 (0.01) 0.95
Hanretty 1.73 (0.51) + 1.20 (0.01) 0.93
Liberal Democrat
YouGov -1.53 (0.12) + 1.01 (0.01) 0.95
Ashcroft -3.91 (0.21) + 1.31 (0.20) 0.88
Hanretty -2.46 (0.23) + 1.14 (0.02) 0.84
For Peer Review
Table 4. Regressions of each party’s constituency vote share at the 2017 general election in Scotland against the predictions of the three analysts.
a b2015 r2
Conservative
YouGov -3.17 (3.16) + 1.17 (0.05) 0.91
Ashcroft -2.29 (1.59) + 1.12 (0.06) 0.87
Hanretty -3.06 (1.83) + 1.25 (0.07) 0.84
Labour
YouGov -6.14 (1.34) + 1.36 (0.05) 0.92
Ashcroft -2.90 (1.51) + 1.35 (0.06) 0.89
Hanretty -4.02 (1.67) + 1.26 (0.06) 0.87
Liberal Democrat
YouGov -0.90 (0.35) + 1.04 (0.03) 0.96
Ashcroft -3.86 (0.73) + 1.44 (0.07) 0.87
Hanretty 0.03 (0.65) + 1.04 (0.06) 0.85
SNP
YouGov 5.84 (2.92) + 0.81 (0.07) 0.66
Ashcroft 4.78 (2.73) + 0.77 (0.06) 0.71
Hanretty 8.93 (2.89) + 0.67 (0.07) 0.63
For Peer Review
Table 5.The predicted and actual number of seats won by each party, for each of the three analysts
Predicted/Actual C L LD SNP PC G Σ
YouGov
Conservative 294 5 4 1 0 0 304
Labour 17 251 0 0 1 0 269
Liberal Democrat 0 0 7 0 1 0 8
SNP 6 6 1 34 0 0 47
PC 0 0 0 0 2 0 2
Green 0 0 0 0 0 1 0
Σ 317 262 12 35 4 1 631
Ashcroft
Predicted/Actual C L LD SNP PC G Σ
Conservative 307 40 7 1 0 0 355
Labour 2 212 0 0 2 1 217
Liberal Democrat 0 0 1 0 1 0 2
SNP 7 6 4 34 0 0 51
PC 0 0 0 0 0 0 0
Green 0 0 0 0 0 0 0
Tie 1 4 0 0 1 0 6
Σ 317 262 12 35 4 1 631
Hanretty
Predicted/Actual C L LD SNP PC G Σ
Conservative 303 55 8 1 0 0 367
Labour 5 199 0 0 0 1 205
Liberal Democrat 0 0 1 0 1 0 2
SNP 8 6 3 34 0 0 51
PC 0 0 0 0 3 0 3
Green 0 0 0 0 0 0 0
Tie 1 2 0 0 0 0 3
Σ 317 262 12 35 4 1 631
Key to parties: C – Conservative; L – Labour; LD – Liberal Democrat; SNP – Scottish National Party; PC – Plaid Cymru; G – Green.
For Peer Review
Table 6. Seats won (W) and lost (L) according to the estimated probabilities of a party winning there by the three analysts
Conservative Labour LD SNP PC
Probability W L W L W L W L W L
YouGov
100 193 0 173 0 1 0 5 0 0 0
90-99 55 0 48 4 4 0 23 5 0 0
75-89 24 0 15 4 2 1 4 5 1 0
50-74 20 11 15 11 0 0 2 3 1 0
40-49 6 4 5 4 1 3 1 0 0 0
<39 19 300 6 347 4 616 0 11 2 36
Ashcroft
100 130 0 55 0 0 0 0 0 0 0
90-99 132 4 81 0 0 0 24 2 0 0
75-89 29 13 32 1 0 0 7 5 0 0
50-74 16 31 48 3 1 0 3 10 0 0
40-49 6 17 19 1 1 1 1 2 0 0
<39 4 250 27 365 10 619 0 5 4 36
Hanretty
100 241 2 116 0 0 0 2 0 0 0
90-99 46 27 41 0 1 1 20 4 1 0
75-89 9 17 19 4 0 0 9 7 1 0
50-74 8 18 24 1 1 0 3 6 1 0
40-49 1 8 6 1 0 3 1 3 0 0
<39 12 243 56 364 10 616 0 4 1 36
For Peer Review
Figure 1. Regressions of the Conservative and Labour constituency vote shares in 2017 in England and Wales against their shares in 2015
Figure 2. Regression of the SNP’s constituency vote shares in 2017 in Scotland against its shares in 2015
[image:23.612.98.428.325.510.2]For Peer Review
Figure 3. Regressions of the Conservative and Labour parties’ constituency vote shares in England and Wales in 2017 against each analyst’s predictions of those shares.
For Peer Review
Figure 4. The three analysts’ predictions of the outcome and the actual outcome in the Conservative-Labour marginal constituencies at the 2017 election in England and Wales
For Peer Review
Figure 5. The three analysts’ predictions of the outcome and the actual outcome in Scotland’s 59 constituencies at the 2017 election
2
For Peer Review
Figure 6. The predicted probabilities of a party winning a seat in 2017 in England and Wales by its predicted vote share in 2017, showing the actual winner of each seat: YouGov’s predicted probabilities of Labour victories and Ashcroft’s predicted probabilities of Conservative victories. 2
For Peer Review
Figure 7. Each analyst’s predicted probabilities of Labour winning in 2017 in each of the Conservative-Labour marginal constituencies, showing the actual winner
For Peer Review
Figure 8. Each analyst’s predicted probabilities of the SNP winning in 2017 in each of Scotland’s 59 constituencies, showing the actual winner