• * • • • • *
• •
Theme 2
Economy and finance Series Β
Short-term statistics
ISSN 1024-4239
eurostat
ECU-EMS Information
& Central Bank Interest Rates
11 D 1997
Monthly
Bilateral fluctuations of the ERM currencies
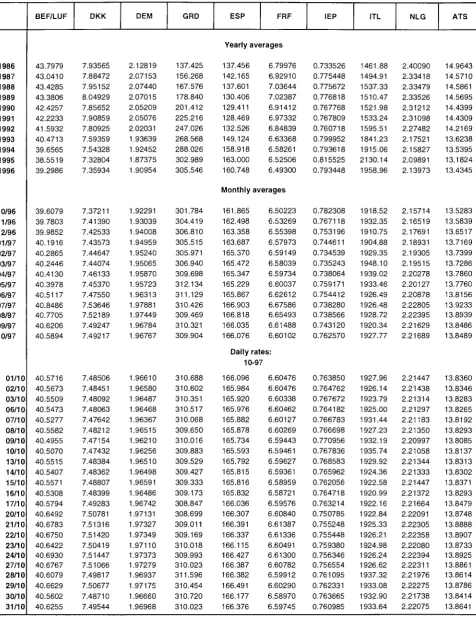
Graph 1 on page 5 shows the trends in the bilateral fluctuation of ERM currencies between 1 September 1997 and 31 October 1997 calculated on a daily basis.
This graph shows that during the whole period under consideration, there was relative stability in the ERM. The IEP was the strongest currency in the ERM grid for the thirteenth month in succession. The graph also shows that during the period 12 September - 9 October 1997 the IEP eased significantly against the DEM and the other ERM currencies. The spread of the IEP against the weakest currency narrowed significantly from 10.55% on 1 September to 5.46% on 9 October. From 10 October onwards the IEP improved its position against the other ERM currencies resulting in the width of the band within which all ERM currencies moved to increase from 5.85% on 10 October to 8.21% on 20 October before narrowing again to 6.91% at the end of October. The FRF has strengthened slightly against the DEM and the other ERM currencies throughout the whole period considered. The graph shows that from 15 to 29 October the ATS was at the weak position against the other ERM currencies while during the last two days of October, the NLG moved to the bottom of the ERM grid followed very narrowly by the ATS and the DEM.
By the end of October, all ERM currencies but the IEP moved within a band of 1.28%, which is narrower than at the end of the previous month (1.71%, if the IEP is excluded).
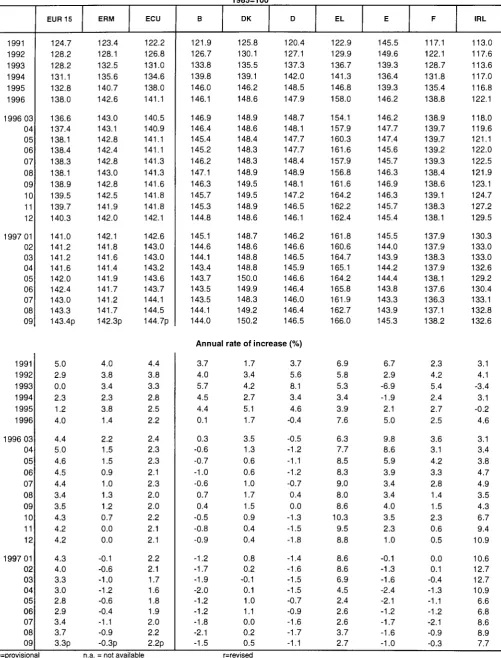
Harmonised consumer price indices in ECU Owing mainly to the sharp appreciation of GBP and IEP against the ECU, the harmonized consumer price indices (HCPI) expressed in ECU of the United Kingdom and Ireland continued to climb, rising in the 12 months to September by 20.5% and 6.7% respectively. Italy's HCPI in ECU also continued on an upward trend. In the 12 months to September this index rose by 2.1%, partly owing to the slow appreciation of ITL against the ECU and partly to the modest growth of the HCPI in national currency. The HCPI in ECU of Greece also continued on an upward trend. In the 12 months to September this index rose by 2.7%, as the impact on the index of the HCPI growth rate in national currency exceeded that of the GRD's
depreciation against the ECU. For the same reason, the HCPI in ECU of Sweden and Denmark continued on an upward trend. In the 12 months to September, Sweden's and Denmark's HCPI in ECU increased by 2.1% and 0.4% respectively.
Because of the larger depreciation of the BEF, DEM, ESP, FRF, LUF, NLG, ATS, PTE and FIM against the ECU relative to the low rate of growth of the respective HCPIs in national currency from September 1996 to September 1997, the HCPI in ECU of Belgium, Germany, Spain, France, Luxembourg, the Netherlands, Austria Portugal and Finland continued to fall by 1.6%, 1.3%, 1.1%, 0.1%, 1.5%, 0.8%, 1.8%, 0.9% and 0.7% respectively.
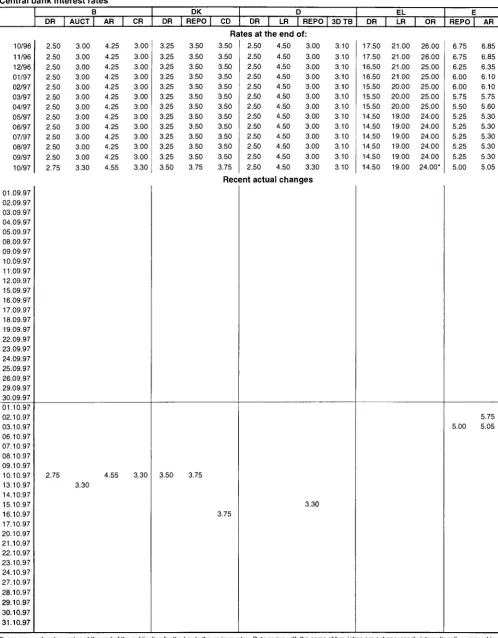
Central bank interest rates
For the first time since August 1996 the Central Council of the Bundesbank decided at its bi-monthly meeting on 9 October to adjust the repo rate, which was raised from 3.0% to 3.3%. This was the first time since December 1992 that the German central bank had moved the rate upwards. The Bundesbank nevertheless decided to leave unchanged the other two key official rates, the discount rate and the Lombard rate which have been at 2.50% and 4.50% respectively since 19 April this year. The bank explained its action by the desire to prevent inflation in the country, the M3 aggregate having risen in August at an annualised rate of 5.8% over the average for the final quarter of 1996, compared with a figure of 5.7% in July. The expansion of the money supply has since slowed somewhat, with a September increase of 5.2% in M3. Other central banks involved in the exchange rate mechanism (ERM) also put up their key rates. The central banks in France, Belgium and the Netherlands raised their tender rates to match the level now prevailing in Germany, i.e. 3.3%.
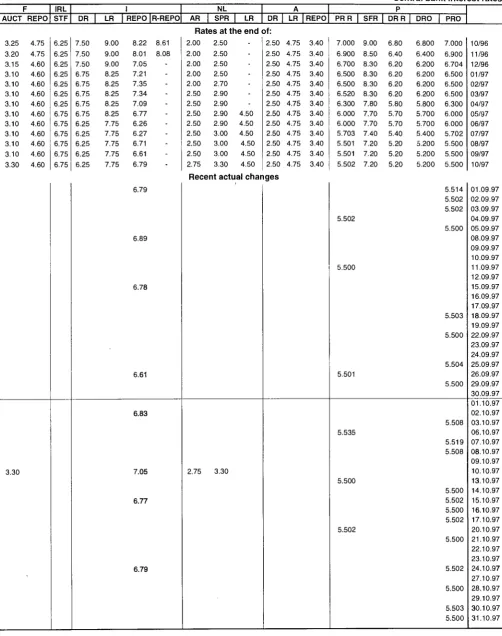
In Austria the central bank also put up its repo rate but set it at 3.2% instead of the 3.3% in the countries mentioned above.
In Denmark the repo rate went up from 3.5% to 3.75%. In contrast with other countries, Spain continued to reduce its rates. The ten-day repo rate was cut by 25 basis points to 5.0% in connection with the tendering procedure of 3 October. The last time the rate was reduced had been in May.
=Έ
eurostat
STATISTICAL OFFICE OF THE EUROPEAN COMMUNITIES
L-2920 Luxembourg — Tél. 4301-1 — Télex COMEUR LU 3423
B-1049 Bruxelles, rue de la Loi 200 — Tél. 299 11 11
Note
For any
TEL:
FAX:
information on the statistics
+352 423113-486
+352 423113-494 ou 489
+352 424607
in this bulletin contact Luxembourg:
F. GARCIA-VALERO / R. SCHMITZ
S. WARTON-WOODS / O. DELOBBE
(Central Bank Interest Rates)
EUROSTAT
Monetary and Financial Statistics
Jean Monnet Building
APC C4/04
L-2920 Luxembourg
European Communities, 1997
Reproduction is authorized provided the source is acknowledged.
TABLE OF CONTENTS
Comments — -1
European Monetary System
Table I. Central rates and intervention limit rates -—4
Graph 1. Bilateral fluctuations of the ERM currencies -—5
Graph 2. Divergence indicator of the ERM currencies - —- 5
ECU exchange rates
Table II. ECU exchange rates 6
Consumer price indices
Table III. Harmonised consumer price indices in ECU - 8
Table IV. Consumer price indices in ECU — — 10
ECU bond market
Table V. ECU bond issues 12
Table VI. Last month's ECU bond issues 12
Table VII. Outstanding amount of ECU bonds — 13
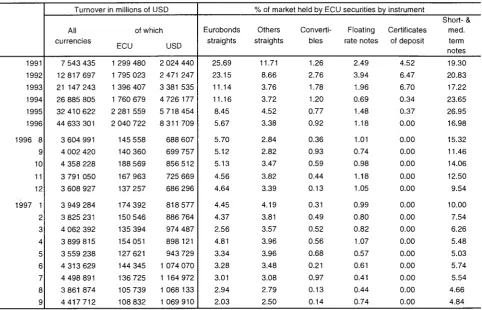
Table VIII. Total of the secondary market turnover and % of market taken by ECU securities 13
ECU interest rates
Table IX. Operation rates of the EMI and interest rates and yields of ECU investments 14
Graph 3. ECU yield curve - 15
Graph 4. Evolution of ECU yields 15
Central bank interest rates
Table X. Central Bank interest rates 16
Graphs Evolution of central bank interest rates over the last 12 months 19
WÄ
eurostatTABLE I
Central rates and intervention limit rates, in force since 25th November 1996, for
the currencies of countries participating in the EMS exchange rate mechanism.
BEF LUF DKK DEM ESP FRF IEP ITL NLG ATS PTE FIM GRD GBP
1 ECU =
39.7191 7.34555 1.92573 163.826 6.45863 0.798709 1906.48 2.16979 13.5485 197.398 5.85424 295.269 (notional) 0.793103 (notional) + = -+ = -+ = -+ = -+ = -+ = -+ = -+ = -+ = -+ = -+ =
-100 BEF = 100 LUF =
-21.4747 18.4938 15.9266 5.63000 4.84837 4.17500 478.944 412.461 355.206 18.8800 16.2608 14.0050 2.33503 2.01090 1.73176 5573.60 4799.91 4133.60 6.34340 5.46286 4.70454 39.6089 34.1107 29.3757 577.090 496.984 428.000 17.1148 14.7391 12.6931
100 DKK =
627.880 540.723 465.665 -30.4450 26.2162 22.5750 2589.80 2230.27 1920.70 102.100 87.9257 75.7200 12.6261 10.8734 9.36403 30138.0 25954.2 22351.0 34.3002 29.5389 25.4385 214.174 184.444 158.841 3120.50 2687.31 2314.30 92.5438 79.6976 68.6347 ■ π selli
100 DEM =
[image:4.595.19.556.109.568.2] [image:4.595.18.315.601.788.2]2395.20 2062.55 1776.20 442.968 381.443 328.461 -9878.50 8507.18 7326.00 389.480 335.386 288.810 48.1696 41.4757 35.7143 114956 99000.4 85259.0 (130.834)* 112.673 (97.0325)* 816.927 703.550 605.877 11903.3 10250.5 8827.70 353.008 304.000 261.801 Table prepí ese buying an the German ng rate HFL 1C
100 ESP =
28.1525 24.2447 20.8795 5.20640 4.48376 3.86140 1.36500 1.17548 1.01230 -4.57780 3.94237 3.39510 0.566120 0.487537 0.419859 1351.30 1163.72 1002.20 1.53793 1.32445 1.14060 9.60338 8.27008 7.12200 139.920 120.493 103.770 4.14938 3.57345 3.07740 ired by the E d selling rate and Dutch η 0 in Frankfu
100 FRF =
714.030 614.977 529.660 132.066 113.732 97.9430 34.6250 29.8164 25.6750 2945.40 2536.54 2184.40 -14.3599 12.3666 10.6500 34276.0 29518.3 25421.0 39.0091 33.5953 28.9381 243.586 209.773 180.654 3549.00 3056.35 2632.10 105.253 90.6422 78.0597 Ml following s are not opt îonetary autl 1: DM 90.77C
1 IEP =
57.7445 49.7289 42.8260 10.6792 9.19676 7.92014 2.80000 2.41105 2.07600 238.175 205.113 176.641 9.38950 8.08631 6.96400 -2771.70 2386.95 2055.61 3.15450 2.71662 2.33952 19.6971 16.9629 14.6082 286.983 247.145 212.838 8.51107 7.32960 6.31217
1000 ITL =
24.1920 20.8337 17.9417 4.47400 3.85294 3.31810 1.17290 1.01010 0.869900 99.7800 85.9311 74.0000 3.93379 3.38773 2.91750 0.486472 0.418944 0.360789 -1.32156 1.13811 0.980132 8.25219 7.10655 6.12032 120.240 103.541 89.1700 3.56570 3.07071 2.64438 notification by the centra
rational. Reflecting a bil lorities, the following rat )0; buying r ate HFL 100
100 NLG =
2125.60 1830.54 1576.45 393.105 338.537 291.544 (103.058)* 88.7526 (76.4326)* 8767.30 7550.30 6502.20 345.650 297.661 256.350 42.7439 36.8105 31.7007 102027 87864.7 75668.0 -725.065 624.417 537.740 10564.0 9097.55 7834.70 313.295 269.806 232.353 I banks conce ateral agreeme ss continue to in Frankfurt: D
100 ATS =
340.420 293.163 252.470 62.9561 54.2170 46.6910 16.5050 14.2136 12.2410 1404.10 1209.18 1041.30 55.3545 47.6706 41.0533 6.84544 5.89521 5.07688 16339.0 14071.5 12118.8 18.5963 16.0149 13.7918 -1691.80 1456.97 1254.70 50.1744 43.2094 37.2114 ned. nt between apply: M 86.7800;
100 PTE =
23.3645 20.1214 17.3285 4.32100 3.72119 3.20460 1.13280 0.975561 0.840100 96.3670 82.9927 71.4690 3.79920 3.27188 2.81770 0.469841 0.404620 0.348453 1121.50 965.805 831.700 1.27637 1.09920 0.946611 7.97000 6.86356 5.91086 -3.44376 2.96570 2.55402
100 FIM =
787.830 678.468 584.290 145.699 125.474 108.057 38.1970 32.8948 28.3280 3249.50 2798.41 2410.00 128.107 110.324 95.0096 15.8424 13.6433 11.7494 37816.0 32565.8 28045.0 43.0378 37.0636 31.9187 268.735 231.431 199.305 3915.40 3371.88 2903.80
-selling rate DM 100 in Amsterdam: HFL 115.2350; buying rate DM 100 in Amsterdam: HFL 110.1675.
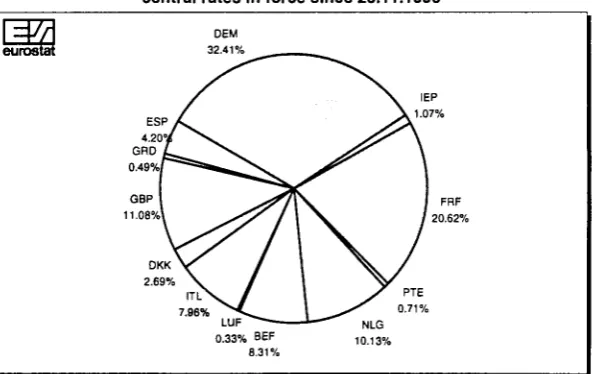
Weights of component currencies in the ECU, calculated on the basis of central rates in force since 25.11.1996
M
urostat
NLG 10.13%
Composition of the ECU basket
Since 21/09/1989 0.6242 DEM
1.332 FRF 0.2198 NLG 3.301 BEF 0.13 LUF 151.8 ITL 0.1976 DKK 0.008552 IEP
~MA
eurostat
Graph 1 : Bilateral fluctuations of the ERM currencies
7%
6%
5%
4%
3%
2%
1%
0%
-1%
-2%
-3%
-4%
-5%
-6%
-7%
I I I I I I I i I I I I I I I I I I I I I
FIM
B E F D K K
9 - 9 7 1 6 - 9 - 9 7
DEM
7%
6%
5%
4%
3°,o
+ 2%
1%
0%
1-10-97 16-10-97
-7% 31-10-97
Graph 2: Divergence indicator
^ 2
[image:6.595.74.551.90.708.2]eurostat
TABLE II
Ecu exchange rates
1986 1987 1988 1989 1990 1991 1992 1993 1994 1995 1996 10/96 11/96 12/96 01/97 02/97 03/97 04/97 05/97 06/97 07/97 08/97 09/97 10/97 01/10 02/10 03/10 06/10 07/10 08/10 09/10 10/10 13/10 14/10 15/10 16/10 17/10 20/10 21/10 22/10 23/10 24/10 27/10 28/10 29/10 30/10 31/10 BEF/LUF 43.7979 43.0410 43.4285 43.3806 42.4257 42.2233 41.5932 40.4713 39.6565 38.5519 39.2986 39.6079 39.7803 39.9852 40.1916 40.2865 40.2446 40.4130 40.3978 40.5117 40.8486 40.7705 40.6206 40.5894 40.5716 40.5673 40.5509 40.5473 40.5277 40.5582 40.4955 40.5070 40.5515 40.5407 40.5571 40.5308 40.5794 40.6492 40.6783 40.6750 40.6422 40.6930 40.6767 40.6079 40.6629 40.5602 40.6255 DKK 7.93565 7.88472 7.95152 8.04929 7.85652 7.90859 7.80925 7.59359 7.54328 7.32804 7.35934 7.37211 7.41390 7.42533 7.43573 7.44647 7.44074 7.46133 7.45370 7.47550 7.53646 7.52189 7.49247 7.49217 7.48506 7.48451 7.48092 7.48063 7.47642 7.48212 7.47154 7.47432 7.48384 7.48362 7.48807 7.48399 7.49283 7.50781 7.51316 7.51420 7.50419 7.51447 7.51066 7.49817 7.50677 7.48710 7.49544 DEM 2.12819 2.07153 2.07440 2.07015 2.05209 2.05076 2.02031 1.93639 1.92452 1.87375 1.90954 1.92291 1.93039 1.94008 1.94959 1.95240 1.95065 1.95870 1.95723 1.96313 1.97881 1.97449 1.96784 1.96767 1.96610 1.96580 1.96487 1.96468 1.96367 1.96515 1.96210 1.96256 1.96510 1.96498 1.96591 1.96486 1.96742 1.97131 1.97327 1.97349 1.97110 1.97373 1.97279 1.96937 1.97175 1.96660 1.96968 GRD 137.425 156.268 167.576 178.840 201.412 225.216 247.026 268.568 288.026 302.989 305.546 301.784 304.419 306.810 305.515 305.971 306.940 309.698 312.134 311.129 310.426 309.469 310.321 309.904 310.688 310.602 310.351 310.517 310.068 309.650 310.016 309.883 309.529 309.427 309.333 309.173 308.847 308.699 309.011 309.169 310.018 309.993 310.023 311.596 310.454 310.720 310.023
ESP FRF
Ea
eurostat
TABLE II
Ecu exchange rates
PTE 147.088 162.616 170.059 173.413 181.109 178.614 174.714 188.370 196.896 196.105 195.761 194.313 195.164 195.689 194.906 196.137 196.038 196.523 197.210 198.277 199.781 200.090 199.897 200.441 200.486 200.273 200.181 200.355 200.273 200.116 199.940 199.529 199.782 199.869 200.089 200.161 200.404 200.764 200.949 200.865 200.557 200.862 200.814 200.830 201.083 200.815 201.139 FIM 4.97974 5.06517 4.94362 4.72301 4.85496 5.00211 5.80703 6.69628 6.19077 5.70855 5.82817 5.75156 5.81198 5.79696 5.80111 5.80357 5.82909 5.87300 5.90352 5.88253 5.86507 5.90347 5.89069 5.89698 5.88552 5.88350 5.89062 5.89236 5.88483 5.89434 5.88451 5.88081 5.89137 5.89515 5.89494 5.89850 5.90225 5.89217 5.90320 5.90832 5.89463 5.90237 5.90261 5.90993 5.91129 5.91244 5.91487 SEK 6.99567 7.31001 7.24192 7.09939 7.52051 7.47926 7.53295 9.12151 9.16307 9.33192 8.51472 8.30499 8.46235 8.53149 8.57942 8.63090 8.80670 8.79398 8.81908 8.80839 8.62871 8.56511 8.47261 8.47984 8.41979 8.39094 8.40657 8.37250 8.45067 8.44150 8.48386 8.48551 8.48909 8.47614 8.49990 8.52655 8.48826 8.45975 8.49011 8.51587 8.48530 8.44762 8.47088 8.56974 8.51768 8.58144 8.56667
GBP ISK NOK
eurostat
TABLE III
Harmonised consumer price indices in ECU
(new contracts)
1996=100 1995 1996 1996 03 04 05 06 07 08 Ob) 10 I ' 12 1997 01 02 03 04 05 06 07 08 09 EUR 15 96.70 100.0 99.10 99.60 100.2 100.3c 100.1(5 100.1 100.5C 101.0C 101.1 101.60 102.0 102.1 102.1 102.4 102.7 102.9 103.3 103.4 103.5p ERM 99.8 100.0 100.40 100.40 100.2 99.90 100.10 100.2 100.10 99.90 99.6 100.10 100.2 99.9 99.9 99.7 100.0 99.9 99.4 99.7 100.2p ECU 98.50 100.0 99.80 100.00 100.1 100.10 100.10 100.1 100.30 100.50 100.5 100.70 101.0 101.2 101.3 101.4 101.7 101.8 102.0 102.2 102.2p Β 100.2 100.0 100.5 100.5 100.1 99.8 99.7 100.2 100.0 99.8 99.4 99.1 99.0 98.7 98.4 98.1 98.8 98.5 97.9 97.9 98.4 DK 98.6 100.0 100.2 100.1 99.8 99.8 99.8 100.2 100.6 100.6 100.1 99.8 100.0 99.8 100.0 100.0 100.7 100.7 99.6 100.3 101.0 D 100.7 100.0 100.6 100.1 99.9 99.9 100.3 100.7 100.0 99.5r 99.0 98.7 98.8 99.0r 99.0 98.5 98.9 98.8 98.3r 98.6 98.7 EL 93.5 100.0 97.6 99.8 101.5 101.9 100.2 99.5 101.9 103.4 102.6 103.0 102.7 102.1 104.2 104.2 103.8 104.6 102.6 103.2 104.7 E 95.3 100.0 99.9 101.0 100.8 99.6 99.7 100.0 100.5 100.1 99.7 99.5 99.5 98.4 98.4 98.5 98.6 98.3 97.8 98.4 99.3 F 97.5 100.0 100.2 100.7 100.7 100.3 100.3 99.8 99.9 100.3 99.7 99.6 99.4 99.5 99.8 99.5 99.6 99.2 98.3 98.9 99.7 IRL 100.0 97.00 97.70 99.2 100.10 99.80 99.9 101.40 102.10 104.2 106.60 106.8 108.9 108.9 108.6r 105.6 106.6 108.7 108.3 108.2 I 88.5 100.0 97.1 98.7 100.9 101.6 101.1 100.9 101.9 102.6 102.2 103.5 104.0 102.8 102.0 102.6 103.1 103.6 103.6 103.4 104.0 L 100.8 100.0 100.6 100.3 99.9 99.7 99.8 100.4 100.0 99.5 99.4 98.9 98.5 98.5 98.5 98.1 98.2 98.1 97.4 97.8 98.5 1996 1996 03 04 05 06 07 Od 09 10 11 12 1997 01 02 03 04 05 06 07 08 09 3.5p 3.80 4.30 4.00 4.00 3.80 3.00 3.10 3.90 3.80 3.80 4.00 3.7 3.10 2.8« 2.5 2.60 3.10 3.4 2.9p 0.3 1.00 0.30 0.30 -0.20 -0.10 0.20 0.00 -0.40 -0.90 -0.50 0.40 -0.2r -0.50 -0.70 -0.2 0.00 -0.70 -0.5 0.1p 1.6p 1.60 1.40 1.60 1.50 1.50 1.40 1.40 1.60 1.50 1.60 2.10 1.9 1.60 1.40 1.6 1.70 2.00 2.1 2.0p -0.2 -0.1 -0.6 -0.6 -0.8 -0.9 0.0 0.0 -0.7 -1.0 -1.3 -1.3 -1.6 -2.0 -2.4 -1.3 -1.3 -1.8 -2.2 -1.6Annual rate of
1.4 3.2 1.0 0.3 0.4 1.0 1.6 1.4 0.8 0.1 0.1 0.8 0.1 -0.2 -0.1 0.3 0.9 -0.2 0.1 0.4 -0.7 -0.8 -1.5 -1.4 -1.5 -1.1 0.2 -0.3 -1.5r -1.6 -1.9 -1.5 -1.8r -1.7 -1.7 -1.0 -1.1 -2.0r -2.0 -1.3 increase 7.0 5.7 7.0 7.7 7.4 8.3 7.3 7.7 9.7 9.2 8.2 8.4 8.6 6.7 4.4 2.4 2.7 2.4 3.7 2.7
(%)
5.0 9.7 8.6 5.9 3.9 3.5 3.3 4.0 3.7 2.4 1.1 0.0 -1.3 -1.5 -2.5 -2.2 -1.3 -1.9 -1.7 -1.1 2.6 3.8 3.2 4.3 3.4 2.9 1.5 1.5 2.3 0.6 0.5 0.0 0.2 -0.4 -1.1 -1.1 -1.1 -2.0 -0.8 -0.1 3.50 3.90 4.3 5.20 5.50 4.1 5.20 7.10 9.7 11.50 11.60 12.8 12.30 11.20 6.5 6.40 8.90 8.5 6.7 13.2 16.3 21.4 17.3 17.4 15.6 11.4 11.4 14.1 12.3 11.9 10.2 7.5 5.1 4.0 2.2 1.9 2.4 2.5 2.1 -0.8 -0.7 -1.4 -1.4 -1.6 -1.2 0.1 -0.4 -1.7 -1.8 -2.1 -2.2 -2.1 -2.0 -2.2 -1.7 -1.7 -2.4 -2.5 -1.5eurostat
TABLE III
Harmonised consumer price indices in ECU
(new contracts)
1996=100 NL 100.5 100.0 101.3 101.0 100.3 99.5 99.3 99.7 100.3 100.0 99.5 98.8 98.4 98.4 99.0 98.8 99.0 98.2 97.6 98.0 99.4 A 100.2 100.0 100.9 100.3 99.7 99.9 100.1 100.3 99.8 99.4 99.3 99.1 98.5 98.8 99.0 98.5 98.6 98.3 97.5 97.8 98.0p Ρ 97.0 100.0 98.9 100.0 99.8 99.5 100.0 100.9 101.0 101.2 101.0 100.7 101.5 101.0 101.2 101.0 101.3 100.5 99.8 100.1 100.1 FIN 101.0 100.0 98.6 97.4 98.5 99.9 100.1 101.3 101.3 101.6 100.4 100.7 100.4 100.6 100.6 100.1 99.9 100.4 100.5 100.2 100.6 S 90.7 100.0 98.6 100.6 100.9 101.8 100.8 99.8 101.4 102.9 100.8 100.0 99.6 99.0 97.6 98.3 98.2 98.4 100.3 101.2 103.6 UK 95.70 100.0 96.2 97.4 99.0 100.3 99.1 98.4 100.6 103.1 106.6 109.2 111.7 114.4 114.8 117.4 117.6 119.9 125.1 124.1 121.2 IS 97.8 100.0 98.8 99.9 100.8 100.6 99.9 100.0 100.4 101.1 100.9 101.5 102.8 104.0 104.4 105.7 106.2 107.4 109.7 110.9 109.8 Ν 98.2 100.0 98.7 99.4 99.7 100.0 100.3 99.7 100.5 101.5 101.9 102.3 106.6 108.4 107.4 105.0 103.5 102.7 102.0 102.4 104.5C H *
100.6 100.0 102.3 101.7 100.0 99.5 99.8 101.6 100.4 99.3 96.4 94.6 93.2 93.1 93.6 94.3 95.7 96.1 96.1 97.1 97.3
U S *
94.3 100.0 98.4 100.0 101.6 101.2 100.0 99.2 100.6 101.8 100.5 102.7 105.9 110.9 112.6 113.2 112.8 114.1 117.6 121.3 118.7
J P *
112.7 100.0 101.3 102.1 104.5 101.3 99.4 99.6 99.3 98.1 96.5 97.2 96.5 96.3 97.9 98.0 103.7 108.7 110.6 111.4 106.0 1995 1996 1996 03 04 05 06 07 08 09 10 11 12 1997 01 02 03 04 05 06 07 08 09 -0.5 -0.6 -1.2 -1.3 -1.7 -0.9 0.2 -0.1 -1.1 -1.3 -1.4 -1.7 -2.0 -2.2 -2.2 -1.3 -1.3 -1.7 -1.6 -0.8 -0.1 -0.2 -0.8 -1.2 -1.0 -0.5 0.5 0.0 -1.0 -0.9 -0.9 -2.1 -2.0 -1.8 -1.7 -1.1 -1.6 -2.6 -2.4 -1.8p 3.1 1.8 2.7 2.8 3.1 3.5 3.5 3.9 4.1 3.7 3.6 3.3 2.5 2.3 1.0 1.5 1.0 -0.3 -0.8 -0.9 -1.0 -1.3 -3.2 -2.5 -1.1 -1.1 -1.4 -1.2 -0.8 -2.2 -1.1 -0.4 1.7 2.0 2.8 1.4 0.5 0.4 -1.1 -0.7 10.5 12.3 17.2 14.9 16.4 15.4 11.7 9.7 9.1 3.4 1.9 2.6 3.8 -1.0 -2.3 -2.7 -3.4 -0.4 1.4 2.1
Annual rate of increase (%) 4.6 0.5 2.4 3.5 5.2 5.6 2.8 4.1 8.4 13.3 15.4 17.7 19.4 19.3 20.6 18.8 19.5 26.2 26.2 20.5 2.2 1.6 2.5 3.1 2.7 2.3 1.8 2.1 3.2 3.3 3.8 5.0 6.0 5.7 5.9 5.3 6.8 9.7 10.9 9.3 1.8 0.3 1.7 1.8 1.7 2.1 1.4 1.5 2.4 3.2 4.0 9.1 10.3 8.8 5.6 3.8 2.7 1.7 2.7 4.0 -0.6 1.6 -0.2 -0.6 -1.3 -0.1 1.7 -1.4 -3.5 -6.4 -7.7 -9.2 -8.4 -8.5 -7.3 -4.2 -3.5 -3.8 -4.4 -3.0 6.1 5.8 9.2 9.0 9.2 9.0 4.5 4.6 8.2 7.1 7.7 9.5 13.9 14.5 13.2 11.0 12.8 17.5 22.3 17.9 -10.9 -12.2 -16.8 -15.2 -17.5 -15.2 -10.7 -7.2 -5.3 -5.5 -6.2 -4.2 -4.4 -3.3 -4.0 -0.8 7.3 11.2 11.8 6.8 1996 1996 03 04 05 06 07 08 09 10 11 12 1997 01 02 03 04 05 06 07 08 09
p=provislonal n.a. = not available r=revised
EE]
[image:10.595.53.555.103.762.2]eurostat
TABLE IV
Consumer price indices in ECU
(existing contracts)
1985=100 1991 1992 1993 1994 1995 1996 1996 03 04 05 06 07 08 09 10 11 12 1997 01 02 03 04 05 06 07 08 09 EUR 15 124.7 128.2 128.2 131.1 132.8 138.0 136.6 137.4 138.1 138.4 138.3 138.1 138.9 139.5 139.7 140.3 141.0 141.2 141.2 141.6 142.0 142.4 143.0 143.3 143.4p ERM 123.4 128.1 132.5 135.6 140.7 142.6 143.0 143.1 142.8 142.4 142.8 143.0 142.8 142.5 141.9 142.0 142.1 141.8 141.6 141.4 141.9 141.7 141.2 141.7 142.3p ECU 122.2 126.8 131.0 134.6 138.0 141.1 140.5 140.9 141.1 141.1 141.3 141.3 141.6 141.8 141.8 142.1 142.6 143.0 143.0 143.2 143.6 143.7 144.1 144.5 144.7p Β 121.9 126.7 133.8 139.8 146.0 146.1 146.9 146.4 145.4 145.2 146.2 147.1 146.3 145.7 145.3 144.8 145.1 144.6 144.1 143.4 143.7 143.5 143.5 144.1 144.0 DK 125.8 130.1 135.5 139.1 146.2 148.6 148.9 148.6 148.4 148.3 148.3 148.9 149.5 149.5 148.9 148.6 148.7 148.6 148.8 148.8 150.0 149.9 148.3 149.2 150.2 D 120.4 127.1 137.3 142.0 148.5 147.9 148.7 148.1 147.7 147.7 148.4 148.9 148.1 147.2 146.5 146.1 146.2 146.6 146.5 145.9 146.6 146.4 146.0 146.4 146.5 EL 122.9 129.9 136.7 141.3 146.8 158.0 154.1 157.9 160.3 161.6 157.9 156.8 161.6 164.2 162.2 162.4 161.8 160.6 164.7 165.1 164.2 165.8 161.9 162.7 166.0 E 145.5 149.6 139.3 136.4 139.3 146.2 146.2 147.7 147.4 145.6 145.7 146.3 146.9 146.3 145.7 145.4 145.5 144.0 143.9 144.2 144.4 143.8 143.3 143.9 145.3 F 117.1 122.1 128.7 131.8 135.4 138.8 138.9 139.7 139.7 139.2 139.3 138.4 138.6 139.1 138.3 138.1 137.9 137.9 138.3 137.9 138.1 137.6 136.3 137.1 138.2 IRL 113.0 117.6 113.6 117.0 116.8 122.1 118.0 119.6 121.1 122.0 122.5 121.9 123.1 124.7 127.2 129.5 130.3 133.0 133.0 132.6 129.2 130.4 133.1 132.8 132.6 1991 1992 1993 1994 1995 1996 1996 03 04 05 06 07 08 09 10 11 12 1997 01 02 03 04 05 06 07 08 09 5.0 2.9 0.0 2.3 1.2 4.0 4.4 5.0 4.6 4.5 4.4 3.4 3.5 4.3 4.2 4.2 4.3 4.0 3.3 3.0 2.8 2.9 3.4 3.7 3.3p 4.0 3.8 3.4 2.3 3.8 1.4 2.2 1.5 1.5 0.9 1.0 1.3 1.2 0.7 0.0 0.0 -0.1 -0.6 -1.0 -1.2 -0.6 -0.4 -1.1 -0.9 -0.3p 4.4 3.8 3.3 2.8 2.5 2.2 2.4 2.3 2.3 2.1 2.3 2.0 2.0 2.2 2.1 2.1 2.2 2.1 1.7 1.6 1.8 1.9 2.0 2.2 2.2pAnnual rate of increase (%) 3.7 4.0 5.7 4.5 4.4 0.1 0.3 -0.6 -0.7 -1.0 -0.6 0.7 0.4 -0.5 -0.8 -0.9 -1.2 -1.7 -1.9 -2.0 -1.2 -1.2 -1.8 -2.1 -1.5 1.7 3.4 4.2 2.7 5.1 1.7 3.5 1.3 0.6 0.6 1.0 1.7 1.5 0.9 0.4 0.4 0.8 0.2 -0.1 0.1 1.0 1.1 0.0 0.2 0.5 3.7 5.6 8.1 3.4 4.6 -0.4 -0.5 -1.2 -1.1 -1.2 -0.7 0.4 0.0 -1.3 -1.5 -1.8 -1.4 -1.6 -1.5 -1.5 -0.7 -0.9 -1.6 -1.7 -1.1 6.9 5.8 5.3 3.4 3.9 7.6 6.3 7.7 8.5 8.3 9.0 8.0 8.6 10.3 9.5 8.8 8.6 8.6 6.9 4.5 2.4 2.6 2.6 3.7 2.7 6.7 2.9 -6.9 -1.9 2.1 5.0 9.8 8.6 5.9 3.9 3.4 3.4 4.0 3.5 2.3 1.0 -0.1 -1.3 -1.6 -2.4 -2.1 -1.2 -1.7 -1.6 -1.0 2.3 4.2 5.4 2.4 2.7 2.5 3.6 3.1 4.2 3.3 2.8 1.4 1.5 2.3 0.6 0.5 0.0 0.1 -0.4 -1.3 -1.1 -1.2 -2.1 -0.9 -0.3 3.1 4.1 -3.4 3.1 -0.2 4.6 3.1 3.4 3.8 4.7 4.9 3.5 4.3 6.7 9.4 10.9 10.6 12.7 12.7 10.9 6.6 6.8 8.6 8.9 7.7
p=provisional η.a. = not available r=revised
L=E2
[image:11.595.41.549.107.760.2]eurostat
TABLE IV
Consumer price indices in ECU
(existing contracts)
1985=100 I 132.1 133.9 121.0 120.9 114.3 129.3 125.4 127.5 130.2 131.3 130.7 130.4 131.7 132.6 132.2 133.7 134.6 133.1 131.8 132.6 133.3 134.0 133.9 133.9 134.7 L 119.6 125.2 133.3 139.0 145.8 145.0 145.7 145.5 144.9 144.5 144.7 145.4 144.9 144.4 144.5 143.6 142.6 142.7 142.7 142.2 142.4 142.0 141.2 141.7 142.7 NL 117.7 123.3 132.3 137.1 143.7 143.9 145.2 144.7 143.8 142.8 143.3 143.9 144.6 144.1 143.4 142.5 142.1 142.1 142.8 142.3 142.8 141.7 141.2 141.7 143.5p A 124.7 131.7 142.4 147.5 154.9 154.8 155.6 154.6 153.6 154.3 155.9 157.5 155.6 154.3 153.8 153.0 152.4 152.7 153.2 152.4 152.3 152.2 152.2 153.5 152.6 Ρ 137.9 153.8 152.1 152.8 159.7 165.1 163.2 165.1 165.0 164.3 165.2 166.6 166.7 167.3 166.9 166.5 167.7 167.0 167.2 167.2 167.8 166.3 165.1 165.7 165.7 FIN 124.8 110.9 98.0 107.2 117.3 115.5 114.0 112.6 113.8 115.4 115.7 117.1 117.1 117.4 115.9 116.2 116.0 116.2 116.1 115.8 115.4 116.0 116.4 115.8 116.3 S 128.8 131.0 113.2 115.1 116.0 127.5 126.3 128.6 128.7 129.8 128.5 127.0 128.8 130.6 127.9 126.7 125.8 124.9 122.9 123.9 123.6 123.9 126.4 127.4 130.0 UK 118.5 117.2 112.2 115.6 111.9 116.9 112.3 113.8 115.6 117.1 115.9 115.0 117.5 120.5 124.6 127.8 131.1 134.5 135.0 138.3 138.7 141.7 148.2 147.3 144.1 IS n.a. 117.2 115.0 111.2 110.9 113.5 112.1 113.0 114.4 114.0 113.3 113.6 114.3 114.9 114.6 115.2 116.7 118.1 118.4 n.a. n.a. n.a. n.a. n.a. n.a. Ν 113.7 116.0 114.8 115.5 119.6 122.4 120.9 121.7 122.0 122.4 122.7 122.1 123.2 124.2 124.8 125.3 130.2 n.a. n.a. n.a. n.a. n.a. n.a. n.a. n.a. 1991 1992 1993 1994 1995 1996 1996 03 04 05 06 07 08 09 10 11 12 1997 01 02 03 04 05 06 07 08 09 5.5 1.4 -9.5 0.0 -5.4 13.2 16.3 21.5 17.3 17.5 15.7 11.4 11.5 14.1 12.4 11.9 10.3 7.6 5.2 4.0 2.4 2.0 2.5 2.7 2.3 3.6 4.7 6.5 4.3 4.9 -0.5 -0.5 -1.1 -1.2 -1.5 -1.2 0.2 -0.2 -1.4 -1.2 -1.7 -2.1 -2.1 -2.1 -2.2 -1.7 -1.7 -2.4 -2.5 -1.5 3.9 4.8 7.3 3.6 4.8 0.1 0.1 -0.6 -0.6 -0.9 -0.3 0.8 0.5 -0.5 -0.7 -0.9 -1.2 -1.5 -1.6 -1.6 -0.7 -0.8 -1.5 -1.6 -0.8p 3.4 5.6 8.1 3.6 5.0 -0.1 -0.3 -1.0 -1.3 -1.0 -0.5 0.8 0.5 -0.7 -0.6 -0.9 -1.4 -1.6 -1.5 -1.4 -0.9 -1.4 -2.4 -2.5 -1.9Annual rate of increase (%)
12.5 11.5 -1.0 0.6 4.6 3.3 1.8 3.1 3.2 3.3 3.8 3.6 4.0 4.3 3.9 4.1 3.8 3.0 2.5 1.3 1.7 1.2 0.0 -0.5 -0.6 1.3 -11.1 -11.4 9.4 9.5 -1.5 -1.6 -3.5 -3.0 -1.8 -1.6 -2.0 -1.7 -1.2 -2.7 -1.7 -0.6 1.4 1.8 2.9 1.4 0.6 0.6 -1.1 -0.7 9.9 1.8 -13.5 1.7 0.8 10.2 12.6 17.2 14.6 16.0 14.8 11.0 9.1 8.3 2.6 0.9 0.9 2.1 -2.7 -3.6 -4.0 -4.6 -1.6 0.3 0.9 7.9 -1.0 -3.9 3.1 -3.2 4.6 0.7 2.4 3.4 4.9 5.4 2.6 3.8 8.4 13.3 15.5 18.5 20.2 20.2 21.6 20.0 21.0 27.9 28.1 22.6 n.a. n.a. -2.0 -3.2 -0.3 2.3 1.5 2.5 3.3 2.7 2.3 2.1 2.4 3.3 3.7 3.9 5.0 5.9 5.6 n.a. n.a. n.a. n.a. n.a. n.a. 2.5 2.0 -1.0 0.6 3.5 2.4 1.1 2.3 2.4 2.3 2.7 1.9 2.0 2.8 3.8 4.3 8.9 n.a. n.a. n.a. n.a. n.a. n.a. n.a. n.a. 1991 1992 1993 1994 1995 1996 1996 03 04 05 06 07 08 09 10 11 12 1997 01 02 03 04 05 06 07 08 09
p=provisional n.a. = not available r=revised
~ΜΔ
eurostat
TABLE V
ECU bond issues (Mio ECU) *
1990 1991 1992 1993 1994 1995 1996 1996 II
III IV 1997 I II III 1997 7 8 9 10
TOTAL EURO
15 040 27 163 19 242 6 870 6 485 5 596 3 180 870 1 330 375 3 295 1 820 810 210 400 200 1 150
Total
10 525 19 266 11 675 5 020 5 010 5 046 3 180 870 1 330
375 3 295 1 670 810 210 400 200 300 Europea Business sector 3 990 6 581 4 870 1 565 1 825 956 2 215 315 1 030 265 1 745 670 710 210 400 100 300
ι Union
Govern ments 5 000 7 900 2 475 250 1 300 3 075 115 55 0 60 0 1 000 0 0 0 0 0 Institu tions 1 535 4 785 4 330 3 205 1 885 1 015 850 500 300 50 1 550 0 100 0 0 100 0
Non-European Union
Total
4 5 1 5 7 897 7 567 1 850 1 475 550 0 0 0 0 0 150 0 0 0 0 850 Business sector 3 565 3 932 3 902 250 1 075 550 0 0 0 0 0 150 0 0 0 0 450 Govern ments 550 3 790 2 850 1 600 400 0 0 0 0 0 0 0 0 0 0 0 400 Organi sations 400 175 815 0 0 0 0 0 0 0 0 0 0 0 0 0 0 Domestic**
2 857 3 134
4 151 6 508 7 311 6 784 8 2 1 6 2 247 1 905 1 991 2 574 2 160 3 451 2 760 326 365 1 303
EURO + DOMESTIC
17 897 30 297 23 393 13 378 13 796 12 380 11 396 3 117 3 235 2 366 5 869 3 985 4 261 2 970 726 565 2 453
(*) Recording based on the payment date (**) Only domestic issues which can be assimilated with Eurobonds
TABLE VI
Last month's ECU bond issues
Issue Payment Date 01.09.1997 15.10.1997 01.09.1997 01.09.1997 04.09.1997 11.09.1997 05.09.1997 25.09.1997 09.09.1997 08.10.1997 09.09.1997 29.10.1997 10.09.1997 01.10.1997 11.09.1997 06.10.1997 19.09.1997 06.11.1997 08.10.1997 08.10.1997 02.10.1997 09.10.1997 08.10.1997 19.11.1997 09.10.1997 28.11.1997 16.10.1997 23.10.1997 21.10.1997 24.10.1997
Borrower & country
Crédit Local de France Volgswagen Financial
Services (GE) France OAT
European Community Bremer Landesbank Kreditanstalt Oldenburg (GE)
Banque Générale de Luxembourg United Mexican States (MX)
GECC (US) Kredietbank International
Finance BNP(FR)
France OAT Oesterreichlscher
Kommunalkredit Kredietbank International
Finance France BTAN
United Kingdom TNote
Amount Issued (Mio Ecu) 100 45 365 100 100 60 400 450 50 40 533 100 50 270 500 Issue Price 101.30 100.00 96.67 99.975 99.873 101.375 100.50 101.115 101.95 101.154 99.00 101.45 101.95 96.56 97.584 Coupon 5.375 5.35 5.50 ■0.125 5.375 5.500 7.625 5.500 Floating 6.200 5.500 5.250 Floating 4.500 4.000 Term (years) 6 7 9+8m 10 6+2m 7 7 7 8+1m 10+4m 9+6m 10+6m 8 4+9m 2+3m Maturity 15.10.2003 01.09.2004 25.04.2007 25.09.2007 19.12.2003 29.10.2004 1.10.2004 06.10.2004 30.12.2005 08.02.2008 25.04.2007 19.12.2003 26.11.2005 12.07.2002 28.01.2000 Yield % 5.12 5.35 5.96
5.40 5.26 7.53 5.31 6.04 5.63 4.97 5.34 5.02Lead Manager
BIL/CCB COMMERZBANK Auct CCF Morgan Stanley Dean Witter BGL Parlbas SBC Warburg
^ a
[image:13.595.64.547.456.766.2]eurostat
TABLE VII
Outstanding amount of ECU bonds (in millions of ECU)
31/10/97 30/09/97 31/08/97 31/12/96 31/12/95 31/12/94 Issuers GOV SUPRA Others Total GOV SUPRA Others Total GOV SUPRA Others Total GOV SUPRA Others Total GOV SUPRA Others Total GOV SUPRA Others Total
Residual maturity in years < 1 13 558 2 665 4 188 20 411 12 308 2 565 3 843 18 716 10 568 2 565 3 453 16 586 9 254 3 5 1 2 5 437 18 203 12 526 3 047 6 963 22 536 11 288 2 610 9 315 23 213 1-3 24 489
4 575 6 868 35 933 25 739 4 675 7 188 37 603 27 339 4 525 7 363 39 228 30 681 4 950 8 864 44 495 25 589 5 732 9 954 41 275 20 359 6 359 12 235 38 953 3-5 14 255 6 950 6 572 27 777 13 985 6 950 6 852 27 787 14 485 7 100 7 352 28 937 13 927 6 620 6 474 27 021 19 483 5 150 6 099 30 732 21 093 4 900 7 654 33 647 5-7 6 592 2 000 3 783 12 375 6 192 2 000 2 973 11 165 6 192 2 000 2 953 11 145 6 929 1 500 1 632 10 061 10 746 4 900 4 337 19 983 10 021 5 170 5 134 20 325 7-10 11 112 700 2 470 14 282 10 601 700 2 525 13 826 9 966 600 2 530 13 096 9 992 700 2 436 13 128 7 468 700 1 438 9 606 10 235 2 200 2 177 14612 > 10 4 000 100 225 4 325 4 000 100 225 4 325 4 000 100 225 4 325 4 750 600 625 5 975 4 750 600 1 325 6 675 5 750 600 1 325 7 675 Total
74 006 16 990 24106 115 102 72 825 16 990 23 606 113 421 72 550 16 890 23 876 113 316 75 533 17 882 25 468 118 883 80 562 2 0 1 2 9 30 116 130 807 78 746 21 839 37 840 138 425
GOV = Central governments SUPRA = Supranational institutions
TABLE VIII
Total secondary market turnover and % of market taken by ECU securities
1991 1992 1993 1994 1995 1996 1996 8 9 10 11 12 1997 1 2 3 4 5 6 7 8 9
Turnover in millions of USD
All currencies
7 543 435 12 817 697 21 147 243 26 885 805 32 410 622 44 633 301
3 604 991 4 002 420 4 358 228 3 791 050 3 608 927
3 949 284 3 825 231 4 062 392 3 899 815 3 559 238 4 313 629 4 498 891 3 861 874 4 4 1 7 7 1 2
of which
ECU
1 299 480 1 795 023 1 396 407 1 760 679 2 281 559 2 040 722
145 558 140 360 188 569 167 963 137 257 174 392 150 546 135 394 154 051 127 621 144 345 136 725 105 739 108 832 USD
2 024 440 2 471 247 3 381 535 4 726 177 5 718 454 8 311 709
688 607 699 757 856 512 725 669 686 296 818 577 886 764 974 487 898 121 943 729 1 074 070 1 164 972 1 068 133 1 069 910
Eurobonds straights 25.69 23.15 11.14 11.16 8.45 5.67 5.70 5.12 5.13 4.56 4.64 4.45 4.37 2.56 4.81 3.34 3.28 3.01 2.94 2.03
% of market held by ECU
mi
eurostatTABLE Χ
Central bank interest rates
Β DK
Ι REPO I CD I DR "I LR I REPO | 3D TB EL
DR AUCT AR CR DR DR LR OR REPO AR
10/96 11/96 12/96 01/97 02/97 03/97 04/97 05/97 06/97 07/97 08/97 09/97 10/97
01.09 02.09 03.09 04.09 05.09. 08.09 09.09 10.09 11.09, 12.09. 15.09, 16.09. 17.09. 18.09. 19.09. 22.09. 23.09, 24.09, 25.09, 26.09. 29.09, 30.09,
Rates at the end of: 2.50
2.50 2.50 2.50 2.50 2.50 2.50 2.50 2.50 2.50 2.50 2.50 2.75
3.00 3.00 3.00 3.00 3.00 3.00 3.00 3.00 3.00 3.00 3.00 3.00 3.30
4.25 4.25 4.25 4.25 4.25 4.25 4.25 4.25 4.25 4.25 4.25 4.25 4.55
3.00 3.00 3.00 3.00 3.00 3.00 3.00 3.00 3.00 3.00 3.00 3.00 3.30
3.25 3.25 3.25 3.25 3.25 3.25 3.25 3.25 3.25 3.25 3.25 3.25 3.50
3.50 3.50 3.50 3.50 3.50 3.50 3.50 3.50 3.50 3.50 3.50 3.50 3.75
3.50 3.50 3.50 3.50 3.50 3.50 3.50 3.50 3.50 3.50 3.50 3.50 3.75
2.50 2.50 2.50 2.50 2.50 2.50 2.50 2.50 2.50 2.50 2.50 2.50 2.50
4.50 4.50 4.50 4.50 4.50 4.50 4.50 4.50 4.50 4.50 4.50 4.50 4.50
3.00 3.00 3.00 3.00 3.00 3.00 3.00 3.00 3.00 3.00 3.00 3.00 3.30
3.10 3.10 3.10 3.10 3.10 3.10 3.10 3.10 3.10 3.10 3.10 3.10 3.10
17.50 17.50 16.50 16.50 15.50 15.50 15.50 14.50 14.50 14.50 14.50 14.50 14.50
21.00 21.00 21.00 21.00 20.00 20.00 20.00 19.00 19.00 19.00 19.00 19.00 19.00
26.00 26.00 25.00 25.00 25.00 25.00 25.00 24.00 24.00 24.00 24.00 24.00 24.00*
6.75 6.75 6.25 6.00 6.00 5.75 5.50 5.25 5.25 5.25 5.25 5.25 5.00
6.85 6.85 6.35 6.10 6.10 5.75 5.60 5.30 5.30 5.30 5.30 5.30 5.05 Recent actual changes
01.10 02.10 03.10 06.10 07.10 08.10 09.10 10.10 13.10 14.10 15.10 16.10 17.10 20.10 21.10 22.10 23.10 24.10 27.10 28.10 29.10 30.10 31.10.
5.75 5.00 5.05
2.75 4.55 3.30 3.50 3.75 3.30
3.30 3.75
Please see explanatory notes at the end of the publication for the key to the various rates. Data series with the same abbreviation are not necessarily internationally comparable. • The rate of 24% is subject to a surcharge of 0.4% daily as from October 31,1997 onwards.
'm
eurostat
Graph 3: ECU yield curve
6.5
6.0
5.5
-a
ω
>
5.0
4.5
4.0
eøtZ*!
^
^
^
^
^
<
^
^
^
5 6
Maturity (years)
31-oct-96
31-0CI-97 30-sep-97
10
Graph 4: Evolution of ECU yields over the last 18 months
7.5
10 years
3 years
[10
eurostat
TABLE IX
Interest rates and yields of ECU investments (%)
EMI* Deposits (maturity in months)
1 12
Yield on ECU bonds (maturity in years)
10 1992 1993 1994 1995 1996 1996 5 6 7 8 9 10 11 12 1997 1 10.29 8.21 5.92 5.88 4.35 4.25 4.25 4.25 4.25 4.25 4.00 4.00 4.00 10.43 8.27 5.95 5.85 4.34 4.31 4.35 4.33 4.28 4.14 4.06 4.07 4.11 10.41 7.99 5.98 5.90 4.31 4.24 4.34 4.34 4.29 4.15 4.06 4.07 4.06 10.27 7.65 6.05 5.98 4.32 4.23 4.35 4.37 4.32 4.17 4.07 4.09 4.07 10.01 7.11 6.21 6.15 4.39 4.29 4.49 4.53 4.44 4.28 4.12 4.15 4.09
7.28 6.87 6.74 6.35 6.77 7.01 6.23 6.66 6.99 4.45 4.79 5.17
4.37 4.58 4.59 4.56 4.38 4.20 4.23 4.13 4.82 5.03 5.02 4.90 4.66 4.36 4.41 4.27 5.28 5.44 5.42 5.28 5.03 4.66 4.70 4.54 6.78 7.13 7.25 5.55 5.71 5.82 5.78 5.67 5.42 5.03 5.03 4.87 6.91 7.24 7.46 5.90 6.08 6.15 6.10 6.02 5.78 5.39 5.36 5.20 7.04 7.39 7.63 6.18 6.37 6.45 6.38 6.30 6.07 5.69 5.63 5.49 7.14 7.55 7.76 6.40 6.59 6.70 6.62 6.51 6.30 5.93 5.86 5.72 7.20 7.66 7.85 6.57 6.77 6.89 6.80 6.68 6.47 6.12 6.04 5.91 7.22 7.69 7.88 6.72 6.91 7.01 6.92 6.81 6.61 6.27 6.19 6.07 7.19 7.56 7.86 6.85 7.04 7.07 6.99 6.92 6.72 6.39 6.32 6.22 1 2 3 4 5 6 7 8 9 10 4.00 3.75 3.75 4.00 4.00 4.00 4.00 4.00 4.00 4.00 4.01 4.04 4.12 4.05 4.01 4.02 4.09 4.20 4.16 4.27 3.99 4.03 4.13 4.07 4.05 4.05 4.11 4.25 4.22 4.37 3.98 4.02 4.16 4.11 4.09 4.09 4.15 4.32 4.32 4.46 3.98 4.02 4.21 4.19 4.16 4.15 4.21 4.39 4.41 4.59 4.02 4.02 4.26 4.23 4.18 4.19 4.24 4.47 4.49 4.65 4.13 4.13 4.45 4.46 4.35 4.31 4.33 4.62 4.62 4.82 Daily rates 4.39 4.35 4.69 4.74 4.60 4.54 4.50 4.80 4.79 4.98 4.71 4.62 4.97 5.05 4.88 4.82 4.73 4.99 4.97 5.13 5.05 4.91 5.25 5.35 5.17 5.11 4.97 5.18 5.15 5.27 5.35 5.18 5.50 5.62 5.43 5.37 5.19 5.36 5.31 5.39 5.60 5.41 5.72 5.85 5.66 5.59 5.39 5.52 5.46 5.51 5.81 5.62 5.91 6.04 5.85 5.79 5.57 5.69 5.61 5.61 5.98 5.78 6.07 6.19 6.01 5.96 5.74 5.85 5.74 5.70 6.14 5.90 6.20 6.30 6.14 6.11 5.90 6.00 5.88 5.80 1.10.97 2.10.97 3.10.97 6.10.97 7.10.97 8.10.97 9.10.97 10.10.97 13.10.97 14.10.97 15.10.97 16.10.97 17.10.97 20.10.97 21.10.97 22.10.97 23.10.97 24.10.97 27.10.97 28.10.97 29.10.97 30.10.97 31.10.97 4.16 4.16 4.16 4.16 4.16 4.16 4.18 4.32 4.31 4.31 4.31 4.33 4.34 4.33 4.31 4.31 4.31 4.31 4.31 4.31 4.31 4.31 4.40 4.22 4.23 4.23 4.24 4.24 4.24 4.25 4.44 4.41 4.40 4.40 4.44 4.46 4.45 4.44 4.44 4.44 4.44 4.44 4.42 4.45 4.44 4.46 4.31 4.31 4.31 4.31 4.31 4.31 4.34 4.53 4.50 4.48 4.50 4.52 4.55 4.55 4.54 4.55 4.54 4.53 4.53 4.50 4.52 4.52 4.54 4.41 4.41 4.41 4.41 4.41 4.41 4.44 4.66 4.63 4.63 4.63 4.67 4.69 4.69 4.69 4.70 4.69 4.69 4.68 4.64 4.66 4.63 4.67 4.49 4.49 4.47 4.47 4.49 4.50 4.64 4.68 4.69 4.63 4.69 4.73 4.77 4.80 4.77 4.80 4.75 4.72 4.72 4.66 4.72 4.66 4.67 4.61 4.61 4.58 4.60 4.62 4.64 4.75 4.87 4.85 4.80 4.86 4.90 4.96 4.99 4.99 5.02 4.97 4.94 4.93 4.86 4.88 4.83 4.83 4.75 4.75 4.72 4.75 4.77 4.78 4.90 5.03 5.01 4.98 5.03 5.08 5.14 5.15 5.15 5.19 5.15 5.11 5.09 5.02 5.03 4.98 4.98 4.91 4.91 4.87 4.90 4.92 4.93 5.07 5.18 5.17 5.14 5.19 5.25 5.29 5.29 5.29 5.33 5.30 5.26 5.22 5.16 5.17 5.12 5.13 5.07 5.07 5.03 5.04 5.07 5.08 5.23 5.31 5.31 5.29 5.33 5.40 5.43 5.42 5.40 5.44 5.42 5.39 5.34 5.29 5.31 5.26 5.26 5.22 5.22 5.18 5.17 5.20 5.22 5.36 5.43 5.43 5.41 5.44 5.51 5.54 5.52 5.51 5.54 5.53 5.50 5.46 5.43 5.44 5.40 5.39 5.36 5.36 5.32 5.30 5.33 5.35 5.47 5.54 5.53 5.51 5.54 5.59 5.62 5.62 5.61 5.64 5.62 5.60 5.57 5.56 5.55 5.52 5.52 5.49 5.48 5.44 5.42 5.44 5.46 5.58 5.64 5.62 5.60 5.63 5.67 5.71 5.71 5.70 5.73 5.71 5.70 5.68 5.67 5.66 5.64 5.63 5.60 5.58 5.55 5.53 5.54 5.57 5.69 5.73 5.72 5.69 5.72 5.77 5.80 5.80 5.79 5.83 5.80 5.80 5.77 5.75 5.77 5.72 5.72 5.70 5.66 5.63 5.64 5.64 5.65 5.81 5.80 5.82 5.79 5.82 5.92 5.91 5.89 5.88 5.92 5.88 5.89 5.83 5.78 5.87 5.78 5.80
' Operation rates of the EMI: see explanatory notes
eurostat
TABLE Χ Central bank interest rates
IRL PR |
I NL
SPR | PR | LR | REPO
AUCT REPO STF LR REPO R-REPO AR LR PR R | SFR I DR R I PRO | PRO~ Rates at the end of:
3.25 3.20 3.15 3.10 3.10 3.10 3.10 3.10 3.10 3.10 3.10 3.10 3.30
4.75 4.75 4.60 4.60 4.60 4.60 4.60 4.60 4.60 4.60 4.60 4.60 4.60
6.25 6.25 6.25 6.25 6.25 6.25 6.25 6.75 6.75 6.75 6.75 6.75 6.75
7.50 7.50 7.50 6.75 6.75 6.75 6.75 6.75 6.25 6.25 6.25 6.25 6.25
9.00 9.00 9.00 8.25 8.25 8.25 8.25 8.25 7.75 7.75 7.75 7.75 7.75
8.22 8.01 7.05 7.21 7.35 7.34 7.09 6.77 6.26 6.27 6.71 6.61 6.79
8.61
8.08
-2.00 2.00 2.00 2.00 2.00 2.50 2.50 2.50 2.50 2.50 2.50 2.50 2.75
2.50 2.50 2.50 2.50 2.70 2.90 2.90 2.90 2.90 3.00 3.00 3.00 3.30
-4.50 4.50 4.50 4.50 4.50 4.50
2.50 2.50 2.50 2.50 2.50 2.50 2.50 2.50 2.50 2.50 2.50 2.50 2.50 Recent actual changes
4.75 4.75 4.75 4.75 4.75 4.75 4.75 4.75 4.75 4.75 4.75 4.75 4.75
3.40 3.40 3.40 3.40 3.40 3.40 3.40 3.40 3.40 3.40 3.40 3.40 3.40
7.000 6.900 6.700 6.500 6.500 6.520 6.300 6.000 6.000 5.703 5.501 5.501 5.502
9.00 8.50 8.30 8.30 8.30 8.30 7.80 7.70 7.70 7.40 7.20 7.20 7.20
6.80 6.40 6.20 6.20 6.20 6.20 5.80 5.70 5.70 5.40 5.20 5.20 5.20
6.800 6.400 6.200 6.200 6.200 6.200 5.800 5.700 5.700 5.400 5.200 5.200 5.200
7.000 6.900 6.704 6.500 6.500 6.500 6.300 6.000 6.000 5.702 5.500 5.500 5.500
10/96 11/96 12/96 01/97 02/97 03/97 04/97 05/97 06/97 07/97 08/97 09/97 10/97
3.30
6.79
6.89
6.78
6.61
6.83
7.05
6.77
6.79
2.75 3.30
5.502
5.500
5.501
5.535
5.500
5.502
5.514 5.502 5.502 5.500
5.503 5.500
5.504 5.500
5.508 5.519 5.508
5.500 5.502 5.500 5.502 5.500
5.502 5.500 5.503 5.500
01.09.97 02.09.97 03.09.97 04.09.97 05.09.97 08.09.97 09.09.97 10.09.97 11.09.97 12.09.97 15.09.97 16.09.97 17.09.97 18.09.97 19.09.97 22.09.97 23.09.97 24.09.97 25.09.97 26.09.97 29.09.97 30.09.97 01.10.97 02.10.97 03.10.97 06.10.97 07.10.97 08.10.97 09.10.97 10.10.97 13.10.97 14.10.97 15.10.97 16.10.97 17.10.97 20.10.97 21.10.97 22.10.97 23.10.97 24.10.97 27.10.97 28.10.97 29.10.97 30.10.97 31.10.97
3Ξ
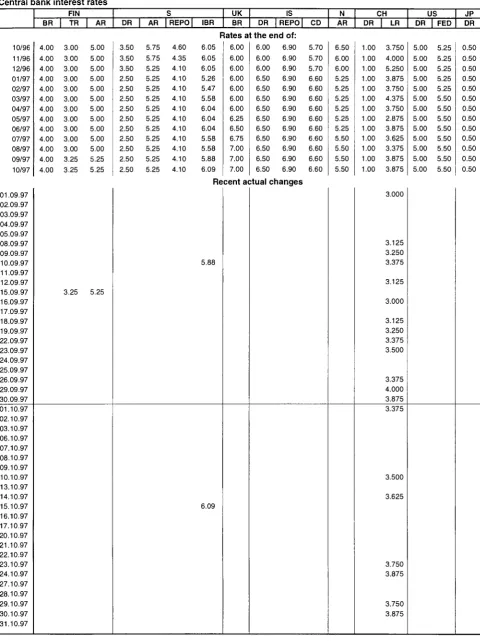
[image:18.595.60.541.69.711.2]eurostat TABLE Χ
Central bank interest rates FIN
PR | AR | REPO | IB"R~
UK IS CH US
PR | FEP
JP BR TR AR BR PR | R E P O | CD AR PR LR PR
10/96 11/96 12/96 01/97 02/97 03/97 04/97 05/97 06/97 07/97 08/97 09/97 10/97
4.00 4.00 4.00 4.00 4.00 4.00 4.00 4.00 4.00 4.00 4.00 4.00 4.00
3.00 3.00 3.00 3.00 3.00 3.00 3.00 3.00 3.00 3.00 3.00 3.25 3.25
5.00 5.00 5.00 5.00 5.00 5.00 5.00 5.00 5.00 5.00 5.00 5.25 5.25
3.50 3.50 3.50 2.50 2.50 2.50 2.50 2.50 2.50 2.50 2.50 2.50 2.50
5.75 5.75 5.25 5.25 5.25 5.25 5.25 5.25 5.25 5.25 5.25 5.25 5.25
4.60 4.35 4.10 4.10 4.10 4.10 4.10 4.10 4.10 4.10 4.10 4.10 4.10
6.05 6.05 6.05 5.26 5.47 5.58 6.04 6.04 6.04 5.58 5.58 5.88 6.09
Rates at the end of: 6.00
6.00 6.00 6.00 6.00 6.00 6.00 6.25 6.50 6.75 7.00 7.00 7.00
Recent actual changes 6.00
6.00 6.00 6.50 6.50 6.50 6.50 6.50 6.50 6.50 6.50 6.50 6.50
6.90 6.90 6.90 6.90 6.90 6.90 6.90 6.90 6.90 6.90 6.90 6.90 6.90
5.70 5.70 5.70 6.60 6.60 6.60 6.60 6.60 6.60 6.60 6.60 6.60 6.60
6.50 6.00 6.00 5.25 5.25 5.25 5.25 5.25 5.25 5.50 5.50 5.50 5.50
1.00 1.00 1.00 1.00 1.00 1.00 1.00 1.00 1.00 1.00 1.00 1.00 1.00
3.750 4.000 5.250 3.875 3.750 4.375 3.750 2.875 3.875 3.625 3.375 3.875 3.875
5.00 5.00 5.00 5.00 5.00 5.00 5.00 5.00 5.00 5.00 5.00 5.00 5.00
5.25 5.25 5.25 5.25 5.25 5.50 5.50 5.50 5.50 5.50 5.50 5.50 5.50
0.50 0.50 0.50 0.50 0.50 0.50 0.50 0.50 0.50 0.50 0.50 0.50 0.50
01.09.97 02.09.97 03.09.97 04.09.97 05.09.97 08.09.97 09.09.97 10.09.97 11.09.97 12.09.97 15.09.97 16.09.97 17.09.97 18.09.97 19.09.97 22.09.97 23.09.97 24.09.97 25.09.97 26.09.97 29.09.97 30.09.97 01.10.97 02.10.97 03.10.97 06.10.97 07.10.97 08.10.97 09.10.97 10.10.97 13.10.97 14.10.97 15.10.97 16.10.97 17.10.97 20.10.97 21.10.97 22.10.97 23.10.97 24.10.97 27.10.97 28.10.97 29.10.97 30.10.97 31.10.97
3.25 5.25
5.88
6.09
3.000
3.125 3.250 3.375 3.125 3.000 3.125 3.250 3.375 3.500
3.375 4.000 3.875 3.375
3.500 3.625
3.750 3.875
3.750 3.875
m
eurostat
Evolution of central bank interest rates over the last 12 months
10 τ
7
--1
DR -CR
10 χ!
7
-1
-DR CD
1.11.96 31.1.97 2.5.97 1.8.97 31.10.97 1.11.96 31.1.97 2.5.97 1.8.97 31.10.97
10 χ
4
--1
a
•DR■LR Repo
28 τ
23
-1 8 -m
13
Θ
■DR LR ORT .
"L
1.11.96 31.1.97 2.5.97 1.8.97 31.10.97 1.11.96 31.1.97 2.5.97 1.8.97 31.10.97 10
m
■Repo -AR
10
a
-Auct Repo1.11.96 31.1.97 2.5.97 1.8.97 31.10.97 1.11.96 31.1.97 2.5.97 1.8.97 31.10.97
10
7
---STF
0
7
4
-L_
l| DR Repo LR
a
\
1
1.11.96 31.1.97 2.5.97 1.8.97 31.10.97 1.11.96 31.1.97 2.5.97 1.8.97 31.10.97
1 0 T 10
1
Θ
SPR -AR ■LR7
4
--1
Θ
■DR -LR
Repo
1.11.96 31.1.97 2.5.97 1.8.97 31.10.97 1.11.96 31.1.97 2.5.97 1.8.97 31.10.97
eurostat
Evolution of central bank interest rates over the last 12 months
10
a
DROPRO
10
7
1
1.11.96 31.1.97 2.5.97 1.8.97 31.10.97
10
Ë3
BRTR
4
1
a
ARRepo
1
1.11.96 31.1.97 2.5.97 1.8.97 31.10.97 10 τ
1
■BR
1.11.96 31.1.97 2.5.97 1.8.97 31.10.97 1.11.96 31.1.97 2.5.97 1.8.97 31.10.97
10
7
LU
Repo 10a
■AR
1.11.96 31.1.97 2.5.97 1.8.97 31.10.97 1.11.96 31.1.97 2.5.97 1.8.97 31.10.97
10 8 6 4 2
■ [CH) DR
LR
10 τ
4
1
■DR FED
1.11.96 31.1.97 2.5.97 1.8.97 31.10.97 1.11.96 31.1.97 2.5.97 1.8.97 31.10.97
10 τ
a
L=
DR1.11.96 31.1.97 2.5.97 1.8.97 31.10.97
Explanatory notes
EXPLANATORY NOTES
Exchange rate grid (Table I)
The intervention limit rates fixed in the official grid do not correspond exactly to + or - 15 % of the central rates, since for each currency pair (whose exchange rates are inversely proportional to one another) the lower limit of one corresponds to the upper limit of the other.
Bilateral fluctuations of the ERM currency (Graph 1 on page 5)
The daily market exchange rates of all currencies are compared with the relevant bilateral central rates and the differentials between the two calculated.
The graph is divided symmetrically by a horizontal axis along which the points would be plotted if all currencies were at their bilateral central rate and there were therefore no fluctuations.
The curves are drawn by linking the daily points showing the relative positions of each currency. These should be compared in pairs. To find the differential between two currencies, subtract the (positive or negative) values along the y-axis corresponding to each currency.
The graph is drawn with the curve of the stronger currency above that of the weaker. It shows therefore the relative position of each currency vis-à-vis the other currencies.
When two curves intersect or merge over a period of time there is no differential between the two currencies and their market exchange rate equals their bilateral central rate.
The maximum spread recorded between two currencies is signified by the band, symmetrical with the horizontal axis. The fluctuations of the other currencies in relation to either of the two currencies in question are shown within the maximum spread.
The divergence indicator (Graph 2 on page 5)
The divergence indicator (DI) measures the degree of movement of a specific EMS currency against its maximum divergence spread. In effect, the DI is a mechanism which detects the EMS currencies that deviate upwards or downwards from the Community average as represented by the ECU.
For a given currency the divergence indicator is obtained:
(i) first by calculating the appreciation or depreciation of the market rate of the ECU in terms of that currency against its ECU-related central rate;
(ii) and then by comparing the result obtained with the maximum divergence spread (MDS), which is the intervention limit, corrected by the weight of each
currency in the basket in such a way that an increase in the weight of a currency reduces its maximum divergence spread.
In order to permit a comparison of movements in the divergence indicators for each of the EMS currencies, the MDS is expressed as an index number ranging between +/- 100. At an absolute index number of 75, a currency reaches its divergence threshold. When a currency crosses its "threshold of divergence", this results in a presumption that the authorities concerned will correct this situation by taking adequate measures.
ECU exchange rates (Table II)
The exchange rates for the ECU against the national currencies of the member states of the Community, the USD and yen are shown as annual averages, monthly averages (for the current year), and daily rates (for the latest available month).
Harmonised consumer price indices in ECU (Table III)
For each country the index of harmonised consumer prices in ECUs is calculated by multiplying the national harmonised consumer price index (HICP) by the average movement of the national currency in relation to the ECU during the month. It measures the change in the purchasing power of one ECU in the country concerned.
Three composite indices are calculated, the first covering all the member states of the Community (EUR15), the second covering 12 member states whose currencies participate in the European Monetary System exchange rate mechanism (ERM), and the third covering the 12 member countries whose currencies go to make up the ECU. (Although the peseta has been participating in the exchange rate mechanism since 19/06/89 and has been included in the calculation of the ECU since 21/09/89, it is only taken into account in the indices relating to the ERM which are included in this bulletin for data after 30/09/89).
These three indices are calculated as weighted arithmetic means (chain indices). The weightings are defined as follows: for the EUR 15 and ERM indices, the relative share of each member state in the final consumption of households for the group of countries in question (EUR15 or ERM), at current prices and exchange rates (annual weighting). For the ECU index, the relative share of each member state's currency in the calculation of the ECU (monthly weighting).
The base year is 1996. These indices should be used for indexing new contracts in ECU.
ECU-EMS Information and central bank interest rates
The Harmonised Consumer Price Indices (HICPs) in national currencies are primarily designed to facilitate international comparisons of consumer price inflation across the European Union. The focus lies on comparability among the indices of the different Member States as well as the relative movements.
In contrast to the interim indices, the HICPs in national currencies are harmonised not only on coverage but also in several methodological aspects. The HICPs in national currencies provide the best statistical basis for international comparisons of consumer price inflation and very considerable progress has been made in harmonising methodologies.
The HICPs in national currencies are compiled using a version of the international classification COICOP (Classification of individual consumption by purpose) which has been specially adapted for the HICPs and is known as COICOP/HICP.
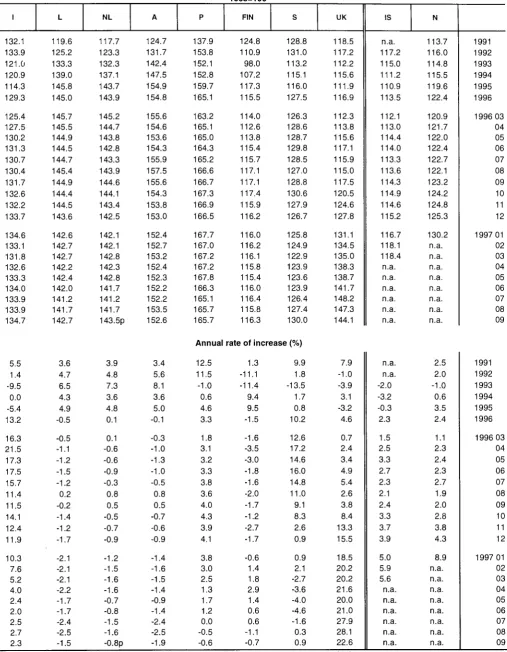
Non harmonised consumer price indices in ECUs (Table IV)
For each country the non harmonised index of consumer prices in ECUs is calculated by multiplying the national non harmonised consumer price index by the average movement of the national currency in relation to the ECU during the month. It measures the change in the purchasing power of one ECU in the country concerned.
Three composite indices are calculated, the first covering all the member states of the Community (EUR 15), the second covering 12 member states whose currencies participate in the European Monetary System exchange rate mechanism (ERM), and the third covering the 12 member countries whose currencies go to make up the ECU. (Although the peseta has been participating in the exchange rate mechanism since 19/06/89 and has been included in the calculation of the ECU since 21/09/89, it is only taken into account in the indices relating to the ERM which are included in this bulletin for data after 30/09/89).
These three indices are calculated as weighted arithmetic means (chain indices). The weightings are defined as follows: for the EUR 15 and ERM indices, the relative share of each member state in the final consumption of households for the group of countries in question (EUR 15 or ERM), expressed in ECUs at current prices and exchange rates (annual weighting). For the ECU index, the relative share of each member state's currency in the calculation of the ECU (monthly weighting).
The base year is 1985. These indices should be used for indexing existing contracts in ECU; for new contracts the new harmonised CPI in ECU should be used instead. The non harmonised price indices in ECU will be published until December 1998.
ECU bond issues (Tables V & VI)
In table V, issues are recorded as at the payment date. This bulletin covers ECU issues in the Eurobond market, which includes international and foreign issues and domestic issues which can be assimilated with Eurobond issues. More specifically, the domestic issues should be free of withholding tax in the hands of non-residents and subject to similar clearing and settlement procedures. This includes ECU issues offering the option of conversion into other currencies. Main source: International Financing Review. Table V shows, under the headings:
- Business sector and Governments: national issuers, both private and public.
- Institutions: the European Investment Bank and the Commission of the European Communities (EEC, ECSC, Euratom).
- Organisations: the specialist institutions of the United Nations, the World Bank, the Council of Europe, etc... . Table VI shows detailed information on the latest known issues, irrespective of the payment date.
Outstanding amount of ECU bonds (Table VII) This table shows the bonds in ECUs outstanding at the end of the last three months and at the end of the last three years. These statistics are taken from a particularly comprehensive database and measure the volume of ECU bonds in circulation. The overall figure is broken down in two ways - by residual maturity and by type of issuer. Total of the secondary market turnover and % of market taken by ECU securities (Table VIM)
This table shows the volume of transactions on securities conducted by the international clearing houses Cedel and Euroclear. The market shares of the various types of instrument are calculated. These statistics do not cover all transactions throughout the world, since internal movements are not included. They do, however, give a realistic idea of market developments.
Interest rates and yields on ECU investments (Table IX)
The interest rates for 1, 3, 6 and 12 months deposits are calculated on the basis of the London market rates LIBID as follows:
- until October 1993: source: Financial Times, Friday rate. - from November 1993: source : Bank of England, British
Banker's Association, daily rates.
The yields of ECU bonds at 1 - 10 years are those provided by Eurostat's yield curve. These are redemption yields. Eurostat's yield curve, which portrays the interest rate structure of maturities ranging from 1 to 10 years, is based on highest quality issues with a triple-Α rating of at least
Explanatory notes
ECU 500 million outstanding, with a very high liquidity (bid-offer spread less than 50 basis points). The curve is calculated daily by fitting a third order polynomial function by regression to the price/yield values of bonds provided by ISMA (International Securities Market Association, London). These values reflect the mean of bid and offer prices communicated by a comprehensive range of financial institutions. The monthly figures included in the table are the arithmetic average of daily figures and the yearly figures are the arithmetic average of daily figures.
Operation rates of the EMI (Table IX)
The interest rate for transactions of the EMI (European Monetary Institute) in ECUs is the weighted average of the most representative rates on the domestic money market of the countries whose currencies make up the ECU basket. It is based on the weighting of the currencies in the ECU basket as derived from the ECU central rates in force. The rate thus calculated for a given month applies to EMI transactions for the following month. In table VII, this rate relates to the month upon which the calculations are based and not to the (following) month during which it is used by the EMI.
ECU yield curve
These graphs show the trend in yields on ECU bonds. Graph 3 shows the ECU yield for bonds due at the end of the last month, at the end of the preceding month and one year previously. Graph 4 shows the development in yields for maturities of 2 and 10 years over the last 12 months. The difference between these two curves reflects the gradient of the rates curve.
Central Bank Interest Rates in the EEA countries, in the US, Japan and Switzerland (Table X)
BELGIUM
Official intervention rates:
Discount rate (DR): rate at which credit institutions can
discount commercial paper at the BNB within the ceilings fixed individually according to balance sheet items.
1-week credit granted by tender (AUCT): rate at which the
BNB grants cash by tender to credit institutions. The duration of these loans is generally 1 week but can be longer under particular circumstances.
Advances to meet daily deficits (AR): rate at which credit
institutions receive money from the BNB within quotas which vary between credit institutions according to balance sheet items and to turnover in the secondary market for government debt-securities.
Central Bank rate (CR): rate at which Primary dealers1
receive overnight money, up to a fixed maximum which is the same for each Primary dealer, from the BNB. This rate will be the next rate applied to the 1-week credit granted by tender.
DENMARK
Intervention rates:
Discount rate (DR): indicative rate which is not attached to
any facility with the Danmarks Nationalbank. Within quotas based on the size of the individual bank, deposits on banks' current account with the Danmarks Nationalbank are remunerated by the folio rate. This rate has been equal to the discount rate since the introduction of the present liquidity instruments in April 1992.
Certificates of deposit (CD): rate on 14-day certificates of
deposit issued on the last banking day of each week by the Nationalbank.
Repurchase agreements (REPO): rate at which the banks
have access to enter into 14-day repurchase agreements in government paper with the Nationalbank. These transactions take place on the penultimate banking day of each week, affecting bank liquidity the following day. The interest rate on repos has equalled the rate on CDs since April 1992.
GERMANY
Intervention rates:
Discount rate (DR): rate at which the Bundesbank
discounts eligible trade bills within the limits of the rediscount quotas.
Lombard rate (LR): rate at which the Bundesbank grants
loans to banks against certain securities. These loans have a maturity of up to 90 days and are granted against collateral of government and public sector securities.
Rate on repurchase agreements (REPO): rate applied to
the Bundesbank's repurchase facility. The Bundesbank buys bonds eligible as collateral for Lombard loans and short-term Treasury discount paper from those banks subject to minimum reserve requirements. These transactions are usually offered by fixed-rate tender or by variable-rate tender for a period of 14, 28 or 35 days.
Other rate:
3-day Treasury bills (3D TB): rate on bills that can be
bought or sold by a specific list of banks. This establishes a floor for the cost of short-term money in addition to the fixed amount provided by the discount window.
GREECE
Intervention rates:
Rediscount rate (DR): rate at which the Bank of Greece
rediscounts commercial bills. This facility is subject to overall quotas which are allocated among credit institutions according to criteria relating to the size of certain balance sheet items.
Primary dealers are market makers for government linear bonds (OLO) and Treasury certificates.