This is a repository copy of
Identification of the primary processes that lead to the drop in
divertor target ion current at detachment in TCV
.
White Rose Research Online URL for this paper:
http://eprints.whiterose.ac.uk/126993/
Version: Accepted Version
Article:
Fil, Alexandre Marie Denis, Dudson, Benjamin Daniel orcid.org/0000-0002-0094-4867,
Lipschultz, Bruce orcid.org/0000-0001-5968-3684 et al. (4 more authors) (2018)
Identification of the primary processes that lead to the drop in divertor target ion current at
detachment in TCV. Contributions to plasma physics. ISSN 0863-1042
https://doi.org/10.1002/ctpp.201700171
[email protected] https://eprints.whiterose.ac.uk/ Reuse
Items deposited in White Rose Research Online are protected by copyright, with all rights reserved unless indicated otherwise. They may be downloaded and/or printed for private study, or other acts as permitted by national copyright laws. The publisher or other rights holders may allow further reproduction and re-use of the full text version. This is indicated by the licence information on the White Rose Research Online record for the item.
Takedown
If you consider content in White Rose Research Online to be in breach of UK law, please notify us by
Identification of the primary processes that lead to the drop
in divertor target ion current at detachment in TCV
A. Fil*,
1B. Dudson,
1B. Lipschultz,
1D. Moulton,
2K. Verhaegh,
1,3O. Fevrier,
3M.
Wensing,
3and EUROfusion MST1 teams
41York Plasma Institute, University of York, Heslington, York, YO10 5DQ, UK
2Culham Centre for Fusion Energy, Culham Science Centre, Abingdon, OX14 3DB, UK
3Swiss Plasma Center (SPC), Ecole Polytechnique Federale de Lausanne (EPFL), CH-1015 Lausanne, Switzerland 4See the author list in "H. Meyer et al 2017 Nucl. Fusion 57 102014"
Correspondence:*Alexandre Fil. Email: [email protected]
Keywords:Tokamak, TCV, SOL, Detachment
Using SOLPS-ITER we model a TCV conventional divertor discharge[1] [2] density ramp to understand the role of
various processes in the loss of target ion current. We find that recombination is not a strong contributor to the
rollover of the target ion current at detachment. In contrast, the divertor ion source appears to play a central role
in magnitude (the source of most of the ion target current) and time, apparently dropping during the density ramps
due to a drop in power available for ionization.
1
Introduction
Operation in a detached regime is needed for ITER and beyond in order to reduce heat fluxes on the divertor
plates [3]. In DEMO, surface recombination heat fluxes will also have to be reduced [4]. In tokamaks, detachment
is obtained via a chain of atomic processes (ionization, recombination,...), each of them being dominant at different
values of density and temperature. Reaching a detached regime is characterized by a reduction of the temperature at
the divertor target plates and a decrease of the total target ion fluxes. Experimental and theoretical studies showed
that the volume recombination and the ionization source in the divertor are the two main mechanisms responsible
for the drop of the ion flux to the targets[5] [6]. Each of these can be the primary mechanism for the observed ion
current reduction[7] and recent measurements on TCV [8] showed that the drop of the ionization source was the
main mechanism in TCV detached plasmas.
The aim of our research is to use SOLPS-ITER to complete the analysis of the divertor characteristics on TCV and
to compare conventional and Super-X configurations. As a first step, it is important to understand the underlying
2 A. FILet al
Figure 1: Experimental measurements for TCV shot 52065. Left : Separatrix density (from Thomson Scattering and fast probe[9]). Right: Total ion current for inner (in red) and outer targets (in blue) measured by Langmuir probes.
TCV shot, 52065, which has already been studied experimentally[1]. We start by presenting this experimental shot
and its characteristics before moving to its modeling with SOLPS-ITER. Then we compare the simulations with
experimental data and conclude.
2
TCV density ramp experiments
TCV density ramp experiments[1] [2]were carried out in a lower single null configuration and the particular shot we
are studying in this paper was an ohmic heated L-mode withIp= 340kA, q95 = 2.5 andBφ= 1.43T (reverse field,
with grad B away from the X-point). In this shot, the poloidal length of the inner leg was 10 cm and was 40 cm for
the outer leg. The poloidal flux expansion between the outer midplane and the outer strike point was∼6 and the
outer strike point was atRtarget= 0.75m. Figure 1 shows the evolution of the plasma density at the separatrix (that
will be called "upstream density") and the evolution of the total ion flux to the inner and outer targets. The ion
flux is first increasing linearly (and not as density squared as expected from the 2PM[10]) before rolling over, which
corresponds to an upstream density ofneup∼3.5·10
19 m−3
. Note that the equilibrium is obtained from the LIUQE
code and that there are some experimental uncertainties on the position of the separatrix and thus on the upstream
density measurement. It is also interesting to note that the total ion flux at the inner target does not rollover and
keeps increasing during the density scan. Recent measurements using the divertor spectroscopy system (DSS) [8]
showed that in similar experimental shots the total ionization source increases at the beginning of the density ramp
before decreasing as the ionization region moves up along the outer leg. Those measurements also showed that the
recombination plays a minor role and that the recombination region stays very close to the targets throughout the
A. FILet al 3
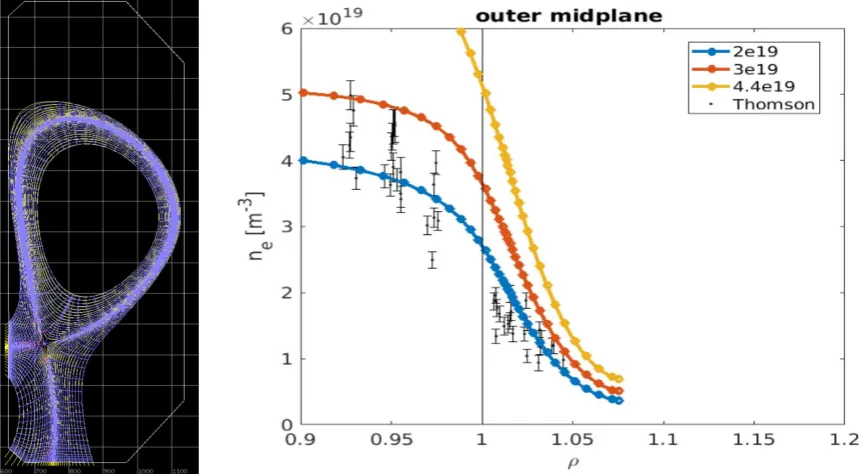
Figure 2: Left: SOLPS-ITER mesh for simulating the TCV shot 52065.
Right: Comparison between experimental density profile (in black, from Thomson scattering) and SOLPS simulation (in blue, red and yellow for increasing upstream densities) along the same line of sight. The Thomson data corresponds to an upstream density of2·1019
m−3
, i.e.texp∼0.6sand thus before the rollover
3
SOLPS-ITER modeling of detachment in TCV
We have performed 9 SOLPS-ITER converged simulations at different upstream densities (electron density at the
outer midplane separatrix). In the modeling, it is varied from5·1018 m−3
to 7·1019 m−3
, when this experimental
shot explores the2−5·1019 m−3
range. All simulations are using the same grid, aligned on the flux surfaces of the
same experimental equilibrium (see figure 2). As boundary conditions, we use a constant power crossing the core
boundary of the computational domain and a constant density at this boundary (that we increase to perform the
density scan). In all the simulations, we use an constant input power of 400kW, which corresponds to experimental
measurements using bolometry. Kinetic neutrals (grid for neutrals not shown in Figure 2) and physical sputtering
of the carbon wall is included in the simulations. SOLPS-ITER simulations are steady-state simulations and each of
those simulations are run for∼5000time steps of10−6−10−5 seconds, until a steady state is reached.
As SOLPS-ITER does not include turbulence, radial transport is chosen as to match experimental upstream profiles
from Thomson scattering (see figure 2). Values ofD⊥= 0.2m2
·s−1andκ⊥ = 1m2·s−1are used in our simulations.
Starting at low upstream densities, we first obtain an attached plasma with a low target density and a high
temper-ature at the target (4.5·1018 m−3
and35eV). As we increase the upstream density, simulated plasmas progressively
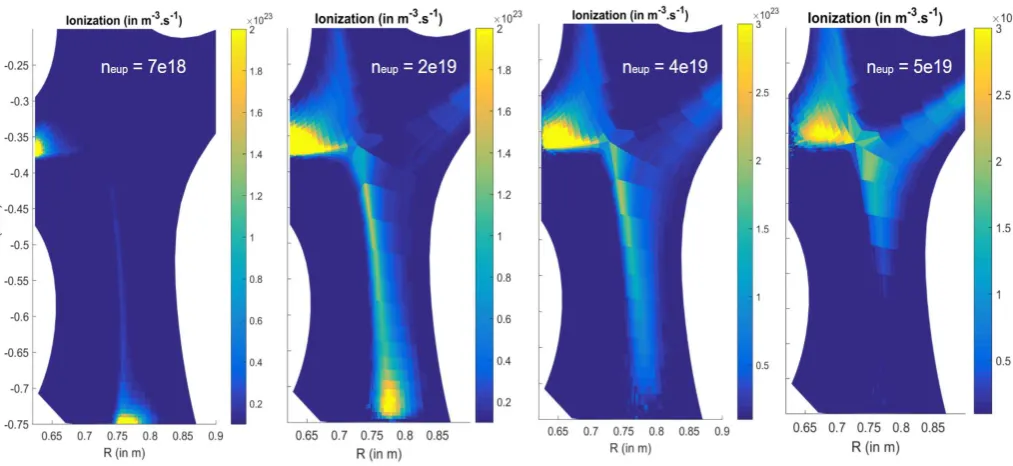
reach a detached regime. The ionization region progressively moves away from the outer target as we increase the
upstream density (see Figure 3). In simulations with higher upstream densities than the experiment, the ionization
4 A. FILet al
Figure 3: Ionization source contours for simulations at three different upstream densities (inm−3
).
Figure 4 displays the ionization source along the outer divertor leg for those simulations. In attached conditions,
the ionization is peaked at the target. When increasing the upstream density, the ionization source is extended all
along the leg and then peaks close to the X-point when we reach detached conditions. The recombination also plays
a role, as can be seen on Figure 5. The level of recombination is however quite low compare to ionization and stays
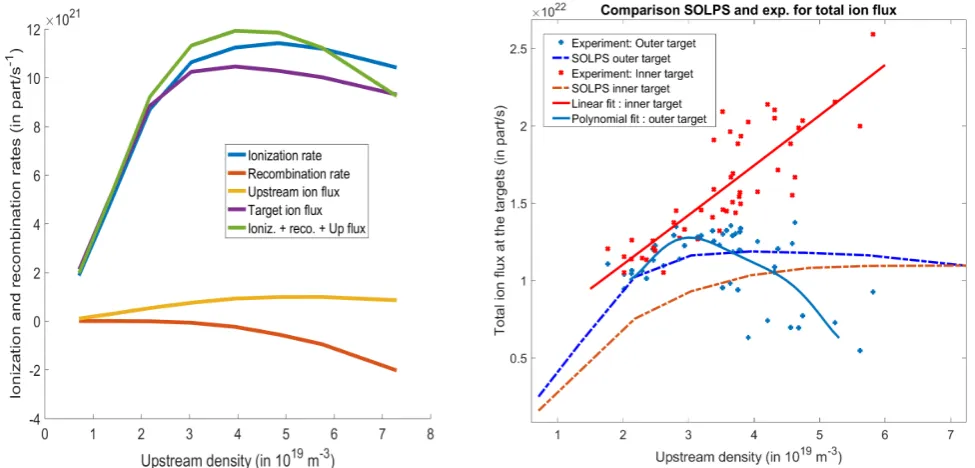
localized close to the target even at high upstream densities. Looking at the ionization and recombination rates in
the outer SOL of Figure 5 (from midplane to the target), we can observe that the ion flux rollover seems to coincide
primarily with power starvation in the divertor region and a decrease of the total ionization.
Those observations are qualitatively comparable to experimental measurements using divertor spectroscopy in TCV
[8]. More quantitative comparison with TCV measurements will be done in a later study, in particular for the carbon
impurity levels (which are included in those simulations), the neutral pressure and the ion flux profiles at the targets.
As upstream density is increased, both targets (inner and outer) are indeed detaching and the total ion flux at both
targets is rolling over. Those detached plasmas are characterized by a target electron temperature which is below 1
eV and a high target electron density (6−7e19m−3
). Even after detachment, the peak density region stays very close
to the target (a few cm away). If we compare to the experimental total ion flux measured by the Langmuir probes
(see Figure 5), we observe that the simulated total ion flux at the outer target rolls over at a higher upstream density.
Moreover, it decreases by less than 10% when it experimentally decreases by∼40%. An important discrepancy with
experiment is that the inner target also get detached when it is not the case experimentally. We are currently running
A. FILet al 5
Figure 4: Ionization profiles along the outer divertor leg for 5 different upstream densities (inm−3
). The ionization starts peaking at the target (red curve) before moving to the X-point as the degree of detachment increases.
Figure 5: Left: Total ionization and recombination in the outer SOL (from midplane to target). Total ion flux rolls-over when the ionization rolls-rolls-over and the recombination increases.
Right: Comparison of the total ion flux at the outer target (in1023
particles per second) between experiment (in blue, from Langmuir probes) and SOLPS-ITER simulations (in red)
4
Conclusion and perspectives
SOLPS-ITER steady-state simulations have been done for TCV L-mode plasmas with different upstream densities.
[image:6.595.61.549.357.591.2]6 REFERENCES
recombination regions and their position as the upstream density is increased are in qualitative agreement with
diver-tor spectroscopy measurements in TCV. Simulations show that the ionization peaks at the X-point for upstream
densities higher than those reached in the experiment.
Current work aims at improving the quantitative comparison with experiments, in particular to explain the
discrep-ancy between experiment and simulations for the total ion fluxes at both targets. Important progress has already
been made concerning the carbon impurity levels. To match experimental measurements, 3% of Carbon chemical
sputtering for the whole wall had to be included in the model. Progress is also done in re-doing those simulations
with realistic gas puffing and wall pumping instead of using a fixed core density boundary. Finally, shots with higher
Rthave just been simulated and are currently being compared to the results presented in this paper, to study the
effect of total flux expansion on the detachment threshold.
Acknowledgments
This work has been carried out within the framework of the EUROfusion Consortium and has received funding from
the Euratom research and training programme 2014-2018 under grant agreement No 633053. The views and opinions
expressed herein do not necessarily reflect those of the European Commission.
This work has also received funding from the EPSRC under the grant EP/N023846/1 and the research by B.
Lipschultz was funded in part by the Wolfson Foundation and UK Royal Society through a Royal Society Wolfson
Research Merit Award as well as by the RCUK Energy Programme (EPSRC grant number EP/I501045).
References
[1] J. R. Harrison, et al.,Nuclear Materials and Energy 2016,000.
[2] C. Theiler, et al.,Nuclear Fusion2017,57, 072008.
[3] A. Loarte, et al.,Nuclear Fusion2007,47, S203.
[4] M. Wischmeier, et al.,J. Nucl. Mater.2015,463, 22-9.
[5] A.A. Pshenov, et al.,Nuclear Materials and Energy2017,12, 948-952.
[6] S. I. Krasheninnikov, et al.,Phys. Plasmas 2016,23, 055602.
[7] B. Lipschultz, et al.,Phys. Plasmas1999,6, 5.
[8] K. Verhaegh, et al.,Nuclear Materials and Energy 2017,000.
[9] C. K. Tsui, et al.,Phys. Plasmas 2017,24, 062508.
![Figure 1: Experimental measurements for TCV shot 52065. Left : Separatrix density (from Thomson Scattering andfast probe [9])](https://thumb-us.123doks.com/thumbv2/123dok_us/1961915.156869/3.595.59.535.54.232/figure-experimental-measurements-separatrix-density-thomson-scattering-andfast.webp)