CHILDHOOD HUMAN CAPITAL IN
ETHIOPIA
Samuel G. Weldeegzie
A thesis submitted for the degree of
Doctor of Philosophy at the
Australian National University
c
This thesis is my own work.
A version of Chapter 3 is published in World Development:
Weldeegzie, S. G. (2017), “Growing-up Unfortunate: War and Human Capital in Ethiopia”, World Development, 96, August, pp. 474–489.
The data used come from Young Lives, a 15-year study of the changing nature of childhood poverty in Ethiopia, India (Andhra Pradesh), Peru and Vietnam (www.younglives.org.uk). Young Lives is funded by UK aid from the Department for International Development (DFID), with co-funding from 2010 to 2014 by the Netherlands Ministry of Foreign Affairs, and from 2014 to 2015 by Irish Aid. The views expressed here are those of the author. They are not necessarily those of Young Lives, the University of Oxford, DFID or other funders.
Samuel G. Weldeegzie June 2017
First of all, I thank to the Almighty God. “For nothing will be impossible with God.”
I thank my wonderful supervisors Prof. Bob Breunig, Asso. Prof. Mathias Sinning, and Asso. Prof. Robert Sparrow. You were incredible supervisors who are there anytime I need help. You inspired me to excel all the time. Your detail comments, academic support, and encouragement through out my PhD journey provided me enormous intellectual strength. I am extremely grateful to have you in my PhD panels.
I am grateful for Arndt-Corden Department of Economics and Crawford fac-ulty and administrative staff including Paul B., Blane L., Premachandra A., Raghbendra J., Budy R., Hal H., Ross M., Sarah D., Rashesh S., Arianto P., Shiro A., Sharon B., Heeok K., Sandra Z., and PhD students during my candidature such as Ryan E., Umbu R., Omer M., Rohan B., Kimlong C., Huy N., Yessi V., Rus’an N., Deasy D., Anna F., Adrianus H., Agung W., Paul A, Paul W, Mark F., and Giang N. for their friendship, collegiality, and useful feedbacks to my Economics PhD seminars. I want to thank all my friends such as Christoph and Ali and all staff members at the University and Graduate Houses, ANU.
I received useful feedbacks from three anonymous reviewers, one editor, and seminar participants of the ADEW 2017, Development Economics Group of WUR, ISS of Erasmus University Rotterdam, UNU-WIDER Human Capital and Growth conference 2016, ABCA 2015 at University of California, Berkley, ACDE-ANU Economics PhD seminars, and the AHES 2014 PhD workshop. In addition, I
received useful comments from three anonymous PhD examiners.
I acknowledge the scholarship award during the course of my PhD study from the ANU. I extend my acknowledgment to the People and Government of Australia.
I thank all my awesome friends and relatives. The list will go on: Haileleul M., Birkti M., Angesom B., Hagos R., Mengesha N., Habtu T., Misgina T., Getachew, Askal A., Arefayne, Abay G., Lemlem, Meseret A., Habtu, Andnet A., Zinabu M...There are so many friends I couldn’t list because of space limitation.
I am extremely grateful to my beloved mom Malefiya, my sisters Mulu and Tsehaynesh, and my missed brother Eyasu and Dad. Mom, I feel writing to acknowledge you here is very little. Your love, support, presence, determination, ... are so much powerful. I will never ever forget the price you paid to raise me. It is my strongest wish you live longer. I just love you so much!
This thesis contains three empirical papers on childhood human capital accumu-lation in Ethiopia. The first paper examines the long-term education impacts of exposure to the 1998–2000 Ethiopia–Eritrea conflict. I exploit exogenous variation on regional and birth-year intensity of the conflict, using cross-sectional school survey data. The empirical findings indicate that exposure to the conflict during early childhood decreases student achievement in mathematics and language scores a decade later (mainly for girls). In addition, exposure to the conflict increases the probability of grade repetition (for boys and girls) and school dropout (for boys only). The paper provides first estimates on the long-term effect of exposure to conflict on human capital accumulation. It further contributes to the study of gender differences with regard to exposure to conflict.
The second paper extends the analysis of the first paper by investigating the effect of conflict on childhood health and education using unique child-level panel data from Ethiopia. It also examines to what extent child health operates as a mechanism through which conflict affects childhood education outcomes. Identification is based on a difference-in-difference approach, using two points in time at which older and younger children have the same average age and controlling for observable household and child-level time-variant characteristics. The paper contributes to an empirical literature that relies predominantly on cross-sectional comparisons of child cohorts born bef ore and af ter the war in war-affected and unaffected regions. The results show that war-exposed children have a one-third of a standard deviation lower height-for-age and higher incidence of stunting. In addition, exposed children are less likely to be enrolled in school, complete fewer grades (given enrollment), and are more likely to exhibit reading problems (given
enrollment). Suggestive evidence indicates that the conflict reduces child education directly as well as through its effect on child health.
Declaration i
Acknowledgements ii
Abstract iv
1 Introduction 1
1.1 Conflict Exposure and Human Capital Accumulation . . . 5
1.1.1 Education . . . 5
1.1.2 Health . . . 7
1.2 Grade Repetition and Education Outcomes . . . 10
1.3 Thesis Purpose, Approach, and Contribution . . . 13
1.4 Key Research Questions and Results . . . 15
1.5 Organisation . . . 17
2 The Persistent Effect of Conflict on Childhood Education 18 2.1 Introduction . . . 19
2.2 The History of Ethiopia–Eritrea War . . . 21
2.3 Related Literature . . . 23
2.4 Data and Preliminary Analysis . . . 25
2.4.1 Data Description . . . 25
2.4.2 Preliminary Analysis . . . 30
2.5 Theoretical Framework and Empirical Strategy . . . 33
2.6 Results and Discussion . . . 37
2.7 Further Sensitivity Analysis . . . 42
2.8 Conclusion . . . 48
2.9 Appendix . . . 50
3 The Effect of Conflict on Childhood Health and Education: Panel Data Evidence 55 3.1 Introduction . . . 57
3.2 Data and Methods . . . 61
3.2.1 The Data Set and Summary Statistics . . . 61
3.2.2 Identification Strategy and Potential Bias . . . 65
3.3 Regression Results and Discussions . . . 73
3.3.1 Child Health . . . 73
3.3.2 Child Education . . . 77
3.3.3 Discussion of Mechanisms . . . 83
3.4 Further Robustness Checks . . . 84
3.5 Conclusion . . . 88
3.6 Appendix . . . 90
4 Grade Repetition, School Dropout, and Student Achievement in Ethiopia: A Waste of Resources? 92 4.1 Introduction . . . 93
4.2 Related Literature . . . 96
4.3 Background and Data Description . . . 98
4.3.1 Background . . . 98
4.3.2 Data Description . . . 102
4.4 Empirical Strategy . . . 109
4.4.1 The Endogenous Treatment–Regression Model . . . 111
4.4.2 The Bivariate Probit Model . . . 114
4.5 Results and Discussion . . . 114
4.5.1 The OLS Results . . . 114
4.5.2 The Endogenous Treatment–Regression Model Results . . . . 118
4.5.3 The Bivariate Probit Model Results: Grade Repetition and School Dropout . . . 122
4.6 Conclusions . . . 124
2.1 Treatment and Control Regions and District of War Locations . . . . 28
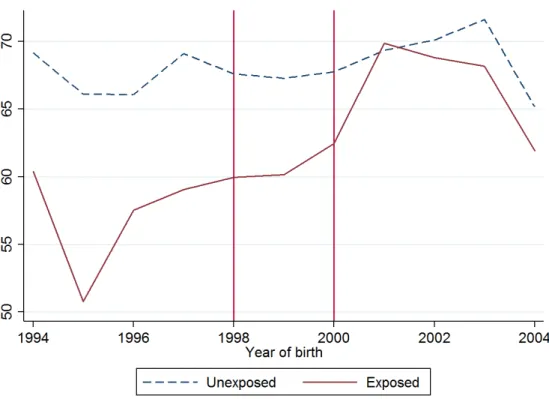
2.2 Mean Maths Score by Year of Birth and Regional Exposure . . . 30
2.3 Mean Language Score by Year of Birth and Regional Exposure . . . . 31
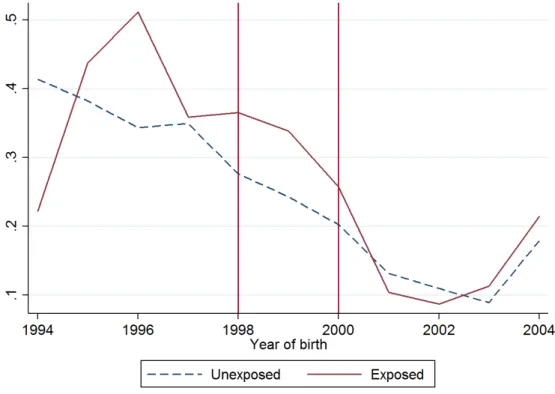
2.4 Mean Grade Repetition Rate by Year of Birth and Regional Exposure 32 2.5 Mean School Dropout Rate by Year of Birth and Regional Exposure . 32 2.A Mean School Dropout Rate by Year of Birth and Gender . . . 50
3.1 Map of Ethiopia Showing Young Lives Number of Sentinel Sites . . . 66
3.2 Height-for-age z-score Distribution by Cohort and Region (Unre-stricted sample) . . . 67
3.3 Height-for-age z-score Distribution by Cohort and Region (Restricted sample) . . . 68
3.4 Trends in Mean Height-for-age z-core by Cohort and Region . . . 69
3.5 Trends in Vaccination Rate Using DHS 1994–2011 by Region . . . 70
3.A Poverty Head Count by Region from 1995/6 to 2010/11 . . . 90
4.1 Enrollment, Survival, and Cumulative Dropout Rates in Primary School, Ethiopia . . . 99
4.2 Dropout Rates by Grade in Primary School, Ethiopia . . . 100
4.3 Percentage of Grade Repeaters in Primary School . . . 101
4.4 Percentage of Grade Repeaters by Grade in Primary School . . . 102
4.5 Number of Sentinel Sites by Region . . . 103
4.6 The Distribution of Maths Grade in Semester I . . . 105
4.7 The Distribution of Language Grade in Semester I . . . 106
4.8 The Distribution of Maths Score at the Beginning of the Academic Year . . . 107
4.9 The Distribution of Maths Score at the End of the Academic Year . . 107
4.10 The Distribution of Verbal Score at the Beginning of the Academic Year . . . 108
4.11 The Distribution of Verbal Score at the End of the Academic Year . . 108
2.1 Summary Statistics . . . 26
2.2 Mean Differences of Outcome Variables by Cohort and Region . . . . 29
2.3 The Effect of Conflict on Human Capital Accumulation . . . 38
2.4 The Effect of Conflict on Human Capital Accumulation (2) . . . 41
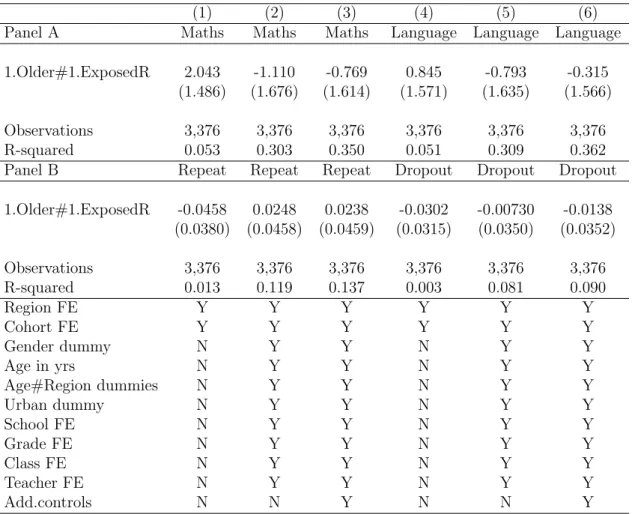
2.5 Falsification Test: The Effect of Conflict on Human Capital Accumu-lation . . . 43
2.6 Falsification Test II: The Effect of Conflict on Human Capital Accu-mulation . . . 45
2.7 Falsification Test II: The Effect of Conflict on Human Capital Accu-mulation (2) . . . 47
2.A The Effect of Conflict on Human Capital Accumulation: Extended Results . . . 51
2.B The Effect of Conflict on Human Capital Accumulation (2): Extended Results . . . 52
2.C The Effect of Conflict on Human Capital Accumulation . . . 53
2.D The Effect of Conflict on Human Capital Accumulation (2) . . . 54
3.1 Birth Year and Survey Rounds . . . 62
3.2 Summary Statistics of Outcome Variables by Cohort and Region . . . 64
3.3 The Effect of War Exposure on Child Health: Pooled OLS Results . . 74
3.4 The Effect of War Exposure on Child Health: OLS Restricted Sample 76 3.5 The Effect of War Exposure on Child Education (1): OLS Restricted Sample . . . 78
3.6 The Effect of War Exposure on Child Education (2): OLS Restricted Sample . . . 80
3.7 The Effect of War Exposure on Child Education (3): OLS Restricted Sample . . . 82
3.8 Placebo Checks Using Younger Cohorts Only . . . 85
3.9 Placebo Checks Based on Control Regions . . . 87
3.A The Effect of War Exposure on Child Health: OLS Cross-sectional . . 91
4.1 Selected Summary Statistics . . . 104
4.2 The Effect of Grade Repetition on Student Achievement . . . 115
Introduction
Prominent economists such as Alfred Marshall and others argue that human capital is one of the key drivers of economic growth (Becker, 1994; Grossman, 1972; Mincer, 1970; Schultz, 1961). In addition, a substantial body of empirical work demonstrates the role of human capital for economic growth (see for instance, Barro, 2001; Bhargava et al., 2001; Bloom et al., 2001; Cohen and Soto, 2007; Eicher and Garcıa-Pe˜nalosa, 2001; Hanushek, 2013; Strauss and Thomas, 1998). Currie and Almond (2011) argue that “in recent economics, the focus is on how human capital accumulation responds to the early childhood environment.” And most developing countries are facing natural and human-induced shocks that affect childhood environment negatively, one of which is armed conflict.
Exposure to armed conflict or war can have severe implications for develop-ment (World Bank, 2011; Gates et al., 2012). Conflict may severely affect the human capital of children, leading to poor health (including malnutrition) and lower education (Akresh, 2016). The young are usually vulnerable to adverse shocks, such as those resulting from war, because attachment to their parents could be disrupted (Barbara, 2006). They are also at an early stage of growth and many human capital investments are age-specific (Justino et al., 2013).
Conflict can have a lasting impact through its effect on childhood human capital. A substantial literature documents that poor health (nutrition) and education in early-life can have lasting effects on adulthood health, education, and
labor market outcomes (Alderman et al., 2006; Currie, 2008; Currie and Vogl, 2012; Duflo, 2001; Lucas, 1998; Lucas et al., 1999; Martorell, 1999; Silventoinen, 2003). For instance, Grantham-McGregor et al. (2007) argue that disadvantaged children in developing countries who do not reach their developmental potential are less likely to be productive adults. However, there is some evidence that sug-gests that some of early-life damages can be remediated (Currie and Almond, 2011).
In the next two chapters of this thesis, I focus on the potential channels – childhood education and health outcomes – through which the Ethiopia–Eritrea conflict could have affected long-term human capital accumulation in Ethiopia. In the first paper, I go beyond the fairly common analysis of the effect of conflict on school enrollment or years of schooling of school-age children at times of conflict. I contribute to the literature by studying the effects of exposure to conflict in early childhood (before school-age) on test scores, the probability of grade repetition and school dropout. I also contribute to the mixed empirical evidence on gender differences in the effect of exposure to conflict.
effect of conflict may be overestimated (Duflo, 2003; Martorell and Habicht, 1986). The opposite holds if war-affected areas tend to be economically rich or less drought prone ex-ante. However, I argue that the former holds in the Ethiopian context and in most other circumstances because areas of civil war tend to be economically poor ex-ante, making it harder to identify causal effects (Blattman and Miguel, 2010).
In the third paper, I investigate the effect of grade repetition on subsequent performance in mathematics and language test scores and the correlation between grade repetition and school dropout. According to a report by the UNESCO Global Education Digest (2012), 32.2 million pupils worldwide repeated a grade in primary education in 2010. The report also states that “pupils who are over-age for their grade due to late entry and/or repetition are at greater risk of leaving school early and children with the least opportunities arising from poverty and compounding disadvantages are most likely to repeat grades and leave school early”(UNESCO, 2012). Furthermore, Manacorda (2012) argues that “grade repetition is common in less developed countries and often accompanied by low enrollment and high dropout rates, the combination of the two often referred to as ‘wastage’.”
cost. Furthermore, every repeater affects school resources in the same way as a new student, resulting in a compromise of per pupil school inputs (Koppensteiner, 2014).
On the other hand, proponents argue that grade repetition raises the expec-tations of schools and so may provide an incentive to study hard (Gary-Bobo et al., 2016), consequently, increasing students’ achievement. In addition, it can increase students’ achievement by allowing low achieving students to catch-up during an extra year of schooling, thereby mastering the relevant content before proceeding to the next grade. Furthermore, Koppensteiner (2014) argues that student retention “may help to make classes more homogeneous in achievement and therefore easier to teach by improving the match between peers in the classroom.”
1.1
Conflict Exposure and Human Capital
Accu-mulation
Despite the importance of the effects of conflict on economic welfare and human capi-tal, there is only a small yet recently growing body of empirical literature. Moreover, theoretically, the impact of war (conflict) on long-term economic performance of a country is not clear. Neoclassical economic theory predicts rapid recovery (con-vergence) in the aftermath of a war. Some empirical evidence that supports this argument is found in Sierra-Leone (Bellows and Miguel, 2006), Germany (Brakman et al., 2004), Japan (Davis and Weinstein, 2002), and Vietnam (Miguel and Roland, 2011). Chen and his co-authors perform a cross-country analysis and conclude that “when the end of war marks the beginning of lasting peace, recovery and improve-ment are achieved” (Chen et al., 2008). However, conflict may still have detriimprove-mental consequences on health, education, and labour market outcomes of individuals and households at the microeconomic level even if economic growth converges at the aggregate level (Akbulut-Yuksel, 2014; Blattman and Miguel, 2010; Justino et al., 2013). I review the empirical literature on microeconomic impacts of exposure to conflict on education and health in the following two subsections.
1.1.1
Education
genocide accumulate 0.5 fewer years of primary education.
Verwimp and Van Bavel (2013) find that boys exposed to violent conflict in Burundi are less likely to complete primary schooling. Chamarbagwala and Mor´an (2011) also find that rural Mayan school-age males and females exposed to the three periods of civil war in Guatemala completed fewer years of schooling. Shemyakina (2011a) exploits regional and temporal variation of the 1992–1998 armed conflict in Tajikistan and finds that exposure to conflict decreases the probability of completing mandatory schooling of girls but does not affect boys. Kibris (2015) also finds a significant association between Turkish-Kurdish conflict and university entrance exam scores of Turkish students. However, this study does not control for region-specific time trends and therefore assumes omitted time-varying effects are not correlated with conflict, as pointed out by Shemyakina (2011a), making it difficult to isolate the effect of the conflict from the effect of other factors such as economic conditions.
In addition, Justino et al. (2013) use two waves of cross-sectional survey data from Timor-Leste and find a rapid recovery for girls and negative long-term effects of exposure to the conflict on primary school attendance and completion among boys. Furthermore, Arcand and Wouabe (2009) find that exposure to the 27-year-long Angolan civil conflict does not significantly affect household expenditures, increases school enrollment and decreases fertility and child health. Shemyakina (2011b) finds that school-age women who were exposed to the 1992–1998 Tajik civil war had a lower likelihood of completing primary schooling but surprisingly, better labor market outcomes (Shemyakina, 2015).
In summary, with the exception of Leon (2012), most of the literature fo-cuses on the effect of exposure to conflict on school-age children at times of conflict in contrast to exposure at early childhood (before school-age). Moreover, with the exception of Kibris (2015), the focus is, unlike what is investigated in my thesis, on school enrollment or years of schooling. Thus, the second chapter of this thesis contributes to the empirical literature by studying the effects of exposure to conflict at early childhood (before school-age children) on achievement in test scores, the probability of grade repetition, and school dropout.
1.1.2
Health
Akresh et al. (2011) look at the effect of civil war and crop failure on child stunting using cross-sectional household data from Rwanda. They find that the height-for-age z-score of children (both boys and girls) who were exposed to conflict is about one standard deviation lower. Similarly, Bundervoet et al. (2009) find a 0.35 standard deviation (and a 0.047 standard deviation for each additional month of conflict exposure) lower height-for-age z-score for those exposed to civil war in rural Burundi. Minoiu and Shemyakina (2012) find 0.489 standard deviations lower in height-for-age z-scores for those exposed to armed conflict in Ivory Coast.
A closely related study by Akresh et al. (2012b) uses the 2002 cross-sectional Eritrean Development and Health Survey (DHS) to investigate the impact of the Ethiopia–Eritrea war on child height-for-age z-score, exploiting exogenous variation in geographic extent and timing of conflict. They find that exposure to the war decreases the child height-for-age z-scores by about 0.45 standard deviations.
1.2
Grade Repetition and Education Outcomes
The empirical evidence on the effect of grade repetition is rather mixed. On the negative side, student retention is found to be one of the most significant predictors of school dropouts (Bowman, 2005; Jacob and Lefgren, 2004, 2009; Stearns et al., 2007). For instance, Jimerson et al. (2002) conduct a systematic review of 17 studies and conclude that grade retention is one of the most powerful predictors of dropout status. Using data from junior high school in Uruguay, Manacorda (2012) finds that student retention causes substantial dropout and lower achievement even 4-5 years later. In addition, Bowman (2005) argues that the financial cost and the pronounced cost to children’s self-esteem could outweigh the benefit. Furthermore, grade retention may also have negative effects on adolescence behavior (Jimerson and Ferguson, 2007; Pagani et al., 2001).
Hong and Yu (2007) conclude that “there is no evidence that early grade re-tention brings benefits to the retainee’s reading and maths learning toward the end of the elementary years.” Similarly, McCoy and Reynolds (1999) find an association of grade retention with lower achievement and suggest that “intervention approaches other than grade retention are needed to better promote school achievement and adjustment.” Silberglitt et al. (2006) also find that retained students did not experience a benefit in their growth rate, even compared to similar but promoted students, and perform less compared to a random sample of students.
effect of grade retention on school performance of students.
Another line of research suggests that there is a negative externality effect of student retention. A recent study by Hill (2014) uses course fixed effects from US high schools and shows that “5 to 10 percent of share of repeaters in a given course results in a moderate to significant increase in the probability of course failure for first-time course-takers.” He also provides evidence that distinguishes course repetition externalities from low ability peer effects (not related to grade repetition).
Do the studies that largely document negative effects of grade repetition im-ply that automatic grade promotion helps to improve academic achievement? A recent study using a difference-in-difference approach by Koppensteiner (2014) finds that automatic grade promotion reduces maths test scores by 7 percent in Brazil. The author interprets this as a disincentive effect. Fertig (2004) finds a significantly positive effect of class repetition on educational outcomes in Germany. Using a nationally representative dataset in the US, Dong (2010) provides evidence that holding children back in kindergarten has positive but diminishing effects on the academic performance up to third grade. These findings suggest that automatic grade promotion may not improve student outcomes, and therefore, provide evidence in favor of retention policies.
1.3
Thesis Purpose, Approach, and Contribution
This thesis presents three self-contained empirical research papers on how early life exposure to conflict can have long–term effects on human capital accumulation through its effect on childhood education and health; and whether or not student retention (grade repetition) improves test score outcomes in Ethiopia.
I focus on health and education and apply careful econometric techniques to identify the impacts of exposure to conflict on (a) childhood education using cross-sectional school survey data; (b) childhood health and education outcomes using panel data of younger and older cohorts in Ethiopia. In addition, I examine the effect of grade repetition on schooling outcomes of children using the same cross-sectional school survey data.
In the first two papers I use a difference-in-difference approach and exploit exogenous variation on timing and regional exposure to the 1998–2000 Ethiopia– Eritrea conflict to identify causal effects. In the third paper, I use endogenous treatment regression and bivariate probit models to deal with the endogniety concerns associated with the selection effect of grade repetition. All these papers use observational data and I exploit quasi-experimental settings for causal inference by carefully assessing the sources of potential biases and providing the best possible remedy to such biases given the available data.
results from the literature that is not restricted to cohorts of the same age using the entire (pooled) sample and cross-sectional sub-samples at each survey round. Afterwards, I restrict the analysis to cohorts that have exactly the same average age. The effect of exposure to the 1998–2000 Ethiopia–Eritrea conflict declines by nearly 40 percent ranging from 0.30 to 0.38 standard deviations in height-for age z-score, which corresponds to a 12- to 15-percentage points higher likelihood of being stunted.
1.4
Key Research Questions and Results
Chapter 2—The Persistent Effect of Conflict on Childhood
Education
The first research paper asks the questions: What is the effect of exposure at early childhood to the 1998–2000 Ethiopia–Eritrea conflict on achievement in mathematics and language test scores for year 4 and 5 primary school students 12 years after the conflict? Does exposure to the conflict increase the likelihood of grade repetition and school dropout? Do these effects vary by gender?
The findings suggest that exposure to conflict during early childhood, in contrast to late childhood, increases the probability of grade repetition (for boys and girls) and school dropout (for boys only), and decreases student achievement in mathematics and language scores (mainly for girls) a decade later.
Chapter 3—The Effect of Conflict on Childhood Health and
Education: Panel Data Evidence
Chapter 3 turns to the research question raised in Chapter 2 and further examines in detail using panel data of older and younger cohorts using two points in time at which older and younger children have the same average age and controlling for observable household and child-level time-variant characteristics. The specific research questions are: What is the effect of exposure to the 1998–2000 Ethiopia– Eritrea conflict on height-for-age z-score of 8 year old children? Does exposure to conflict have an effect on school enrollment, grade completion, and reading proficiency? To what extent does child health plays a mediating role in the effect of conflict on child education?
of a standard deviation lower height-for-age z-score and a 12-percentage point higher incidence of childhood stunting. In addition, exposed children are less likely to be enrolled in school, complete fewer grades (given enrollment), and are more likely to exhibit reading problems (given enrollment). While analyzing the exact mechanisms is challenging, suggestive evidence indicates that child health reduces child education, in particular the probability of child enrollment at school.
Chapter 4—Grade Repetition, School Dropout, and Student
Achievement in Ethiopia: A Waste of Resources?
The final research paper asks: Does student retention (grade repetition) improve learning outcomes later? Is student retention correlated with school dropout? Schools or parents make students repeat a grade under the rationale that student retention will improve learning outcomes later. However, whether retention improves student achievement remains entirely an empirical question as theoretical predictions are inconclusive.
1.5
Organisation
The Persistent Effect of Conflict
on Childhood Education
Abstract
This paper examines the persistent effect of the 1998–2000 Ethiopia–Eritrea conflict on human capital accumulation. The empirical findings indicate that exposure to conflict duringearlychildhood increases the probability of grade repetition (for boys and girls) and school dropout (for boys only), and decreases student achievement in mathematics and language scores (mainly for girls) a decade later. Identification of the effect is based on a difference-in-difference approach that exploits temporal and regional variation of the conflict. These effects are robust when including region-specific trends, school, grade, class, and teacher level fixed effects, and other student and family characteristics. The paper provides the first estimates on the long-term effect of exposure to conflict at early (before school-age) childhood on test scores of primary school students.
2.1
Introduction
Heckman (2006) argues that “life cycle skill formation is a dynamic process in which early inputs strongly affect the productivity of later inputs.” It is well-documented that early-life health and education can have lasting impacts into adulthood (Alderman et al., 2006; Currie, 2008; Currie and Vogl, 2012; Duflo, 2001; Heckman et al., 2013) and poor childhood health and exposure to other risks before age five can have detrimental effects on cognitive, motor, and social-emotional development (Grantham-McGregor et al., 2007). However, there is evidence that suggests that some early-life damages can be remediated (Currie and Almond, 2011).
Despite strong and conclusive evidence on the causal effect of conflict on childhood health (Akresh et al., 2012b, 2011; Bundervoet et al., 2009; Weldeegzie, 2017), little is known about the causal effect of conflict on the learning outcomes of children and the evidence to date is inconclusive (Pivovarova and Swee, 2015; Valente, 2013). Furthermore, most studies limit their analysis to enrollment and years of education (Leon, 2012; Shemyakina, 2011a, 2015) or study exposure of conflict for those who were school-age children during times of conflict (Akresh and de Walque, 2010; Chamarbagwala and Mor´an, 2011; Shemyakina, 2011a, 2015).
However, these outcomes are imperfect because they may indicate how much time students spent at school instead of how much they have learned at school.1
This implies that increases in the number of years of schooling does not necessarily imply increases in learning and acquiring the required skills and knowledge. Hanushek and Woessmann (2007) conclude that “the cognitive skills of the popu-lation – rather than mere school attainment – are powerfully related to individual earnings, to the distribution of income, and to economic growth.”
1Pritchett (2001) points out that increases in low quality schooling does not raise cognitive skills
This study goes beyond the fairly common analysis of the effect of conflict on school enrollment or years of schooling and contributes to the literature by studying the effects on achievement in test scores and the probability of grade repetition and school dropout. I use unique school survey data from a sample of more than 10,000 children in 94 schools spread across seven regions in Ethiopia to examine the long-term causal effect of exposure to the 1998–2000 Ethiopia– Eritrea conflict on education outcomes. Identification of the effect is based on a difference-in-difference (DID) approach. The reduced DID model controls for region-specific time trends, and including school, grade, class, and teacher level fixed effects as well as other student and household characteristics. Furthermore, I do not only compare the outcomes of those born bef ore and af ter the conflict in conflict-affected and unaffected areas but also of those born during and af ter the conflict in conflict-affected and unaffected areas.
The empirical findings reveal that exposure to the conflict persists a decade later and is manifested through reduced achievement in mathematics and language scores by about 4 percentage points, on average. The effect is larger and statisti-cally significant for girls in contrast to boys. In addition, exposure to the conflict increases the probability of repeating a grade and school dropout by about 10 and 6 percentage points respectively, but no statistically significant effect was detected on school dropout of boys. These effects are relatively large and consistently significant for younger children (born during the conflict) relative to older children (born bef ore the conflict). This is consistent with studies that suggest that childhood exposure to disadvantage matters more inearly than inlatechildhood (Leon, 2012).
on test scores of primary school students, showing that the effects of violence at early childhood is persistent in contrast to exposure at late childhood. Second, the analysis extends the effect of conflict on the likelihood of school dropout and grade repetition. Third, I use a high-quality large-scale dataset which permits the consideration of region-specific trends and student and family characteristics. Fourth, this is the first empirical evidence to explore these outcomes in the literature using a sample of children from Ethiopia. Finally, it contributes to the inconclusive findings of the literature on the gender differential effect of exposure to the conflict.
The remainder of the chapter is organized as follows. Section 2.2 provides a brief historical explanation of the Ethiopia–Eritrea conflict. Section 2.3 reviews the literature. Section 2.4 describes the dataset and provides a preliminary analysis. Section 2.5 presents the theoretical framework, empirical strategy, and outlines sources of potential bias. Section 2.6 presents and discusses the results. Section 2.7 presents additional results from a set of sensitivity analysis. The final section concludes.
2.2
The History of Ethiopia–Eritrea War
the two countries.
The war led to a significant loss of life and material damage for both na-tions. As documented in a report from Addis Ababa University (2012), both countries committed to large spending to mobilize military forces. It is estimated that the total cost of the conflict was about USD 280 million for Eritrea and USD 397 million for Ethiopia, in addition to nearly 50,000 Eritrean and 75,000 Ethiopian troops lost (Addis Ababa University, 2012). Furthermore, a large number of people was internally displaced. As documented in the Internally Displaced Persons (IDP) global database of the Norwegian Refugee Council, about 315,000 Ethiopians were displaced by December 1998 and this number grew to more than 360,000 on May 2000. 90 percent of these were in the Tigray region and about 30,000 in the Afar region (Global IDP, 2004a,b). The foregone GDP growth and the non-monetary human cost imply a significant impact on the overall economy of both nations.
Due to geographic proximity, it appears likely that children who reside close to the war-affected region were affected more than those in regions farther away from the battlefield. Moreover, after the war ended formally in June 2000, Ethiopia went through a relatively peaceful decade. As a result, children born after the war in both war-affected and unaffected regions were not directly exposed to war. Consequently, causal effects can be identified by comparing changes in outcomes for children born before and after the war in war-affected and unaffected regions. This identification strategy relies on the assumption that the war is exogenous to child health and schooling outcomes in Ethiopia, which seems plausible, given that the war was the result of border dispute between the two countries.2
2.3
Related Literature
Theoretical predictions of the long-term effect of conflict on human capital accumulation are ambiguous (Bellows and Miguel, 2006). At a macroeconomic level, neoclassical economics predicts conflict–affected areas have the possibility of catching up to unaffected areas (Chen et al., 2008). However, Blattman and Miguel (2010) argue that war or violent conflict may still have detrimental consequence on health, education, and labour market outcomes of individuals and households at the microeconomic level even if economic growth converges at the aggregate level (Akbulut-Yuksel, 2014; Justino et al., 2013).
Empirical evidence varies considerably depending on the context of the anal-ysis, ranging from a negative to a positive effect on education. Of the studies that find a negative effect of conflict on schooling outcomes of children, Leon (2012) documents a persistent effect of exposure to violence before school-age (in utero, early childhood, and pre-school age) in Peru. Children affected before school-age accumulated 0.31 fewer years of schooling upon reaching adulthood in contrast to those exposed after starting school who fully catch up. Similarly, Akresh and de Walque (2010) find that children exposed to the Rwandan genocide accumulate 0.5 fewer years of primary education.
outcomes (Shemyakina, 2015). Kibris (2015) also finds a significant association between Turkish-Kurdish conflict and university entrance exam scores of Turkish students. However, this study does not control for region-specific time trends and therefore assumes that omitted time-varying effects are not correlated with conflict, as pointed out by Shemyakina (2011a), making it difficult to isolate the effect of the conflict from the effect of other factors such as economic conditions.
In contrast, a recent study by Valente (2013), based on data from Nepal finds that conflict intensity is associated with an increase in schooling attainment especially for females (although the abductions by Maoists have a negative effect). This study is able to measure conflict intensity in great detail but it does not control for region-specific time trends. A more recent study from the same country using individual fixed effects by Pivovarova and Swee (2015) concludes that there is no effect of war intensity on schooling attainment. The authors argue that “while the conventional difference-in-differences estimation yields a positive effect of war intensity on schooling attainment the effect diminishes completely when we augment difference-in-differences with individual fixed effects, suggesting that unobserved individual heterogeneity may play an important role.”
In addition, Justino et al. (2013) use two waves of cross-sectional survey data from Timor-Leste and find a rapid recovery for girls and negative long-term effects of exposure to the conflict on primary school attendance and completion among boys. Furthermore, Arcand and Wouabe (2009) find that exposure to the 27-year-long Angolan civil conflict does not significantly affect household expenditures, increases school enrollment and decreases fertility and child health.
school-age children at times of conflict in contrast to before school-age children and outcomes such as enrollment and years of education. Thus, this paper particularly contributes to the evidence on the long-term effect of conflict on pre-school age children. In addition, in this chapter, I focus on test score outcomes instead of enrollment and years of education.
2.4
Data and Preliminary Analysis
2.4.1
Data Description
I use cross-sectional schools survey data collected by the Young Lives team in Ethiopia and Oxford University. This is a separate dataset from the Young Lives longitudinal childhood poverty study, which tracks a sample of older and younger cohorts in four developing countries, including Ethiopia, Peru, Vietnam, and India. The school survey data consists of a sample of all pupils studying in grades 4 and 5 during the 2012/13 academic year in all schools located within the geographic boundaries of each of the 30 sentinel sites spread across seven regions in Ethiopia – Tigray, Afar, Somalia, Amhara, SNNP, Addis Ababa, and Oromia (Aurino et al., 2014).
Table 2.1: Summary Statistics
Variable Mean Std. Dev. Min. Max. N
Region=Addis Ababa 0.192 0.394 0 1 11641
Region=Amhara 0.101 0.302 0 1 11641
Region=Oromiya 0.093 0.291 0 1 11641
Region=SNNP 0.241 0.428 0 1 11641
Region=Tigray 0.154 0.361 0 1 11641
Region=Somali 0.12 0.325 0 1 11641
Region=Afar 0.099 0.298 0 1 11641
Urban=1 0.712 0.453 0 1 11641
School identification 40.135 25.602 1 94 11641
Class identification 2.996 2.059 1 10 11641
Teacher identification 6.281 4.1 2 16 11641
Grade=4 0.512 0.5 0 1 11641
Maths grade 63.919 15.725 7 100 10945
Language grade 68.219 16.071 8 100 10947
Dropped out of school 0.177 0.382 0 1 11549
Repeated grade 0.243 0.429 0 1 11610
Sex=Girl 0.503 0.5 0 1 11641
Age in yrs 11.584 1.831 8 34 11641
Age starting school yrs 6.867 1.816 4 29 11641
Absence days since Oct 1 1.111 2.321 0 26 11641
Absence days since wave 1 5.887 7.717 0 72 10951
Attended pre-school 0.516 0.5 0 1 11573
Longterm health problem 0.228 0.42 0 1 11641
No of meals/day=1 0.044 0.205 0 1 11615
No of meals/day=2 0.148 0.355 0 1 11615
No of meals/day>=3 0.808 0.394 0 1 11615
No of other people 6.963 3.572 1 30 11641
Mother alive 0.935 0.247 0 1 11618
Father alive 0.829 0.377 0 1 11556
Mother read & write 0.479 0.5 0 1 11641
Father read & write 0.59 0.492 0 1 11641
No one read & write 0.071 0.257 0 1 11641
Help at home=never 0.182 0.386 0 1 11606
Help at home=always 0.459 0.498 0 1 11606
Help at home=sometimes 0.359 0.48 0 1 11606
The summary statistics above show that the age of students in the sample ranges from 8–34 at the end of 2012. This gives ample variation in terms of year of birth (some born bef ore, during and af ter the conflict). Nearly 72 percent of students are from urban areas. About 50 percent of the students in the sample are in grade four and 50 percent of these students are boys. On average, a student starts school at age seven. About 80 percent of students eat at least three times a day and more than half of the students get support with school work from family members. In addition, about 50 percent of parents can read and write.
Figure 2.1: Treatment and Control Regions and District of War Locations
Source: Author’s own work based on from Young Lives school survey data 2012/13, Ethiopia.
Because the war lasted from May 1998–June 2000, I call cohorts that belong to the pre-1998 birth year as the “before” 3 whereas those born between 1998 and 2000 (inclusive) as “during”. Those who are born from 2001 onwards are “after” cohorts. The variations across birth year cohorts and geographic proximity permits a comparison of outcomes for those born before and after the conflict (and during and after the conflict) from conflict-affected and unaffected regions in a DID setting. Table 2.2 below shows the mean differences between these cohorts by war-affected and unaffected regions for each gender.
3Note: the “before” cohorts include those born in 1994, 1995, 1996, and 1997 only so that the
Table 2.2: Mean Differences of Outcome Variables by Cohort and Region
Boys sample
War Non-war
Before After Diff. Before After Diff.
Maths grade (max.100) 64.88 66.68 -1.80 65.03 64.19 0.84
Language grade (max.100) 61.13 68.92 -7.80*** 68.18 69.46 -1.28
Repeated grade (%) 0.35 0.18 0.17*** 0.26 0.22 0.04
Dropped out of school (%) 0.34 0.11 0.22*** 0.35 0.12 0.23***
N 104 939 253 1960
During After Diff. During After Diff.
Maths grade (max.100) 63.14 66.68 -3.54*** 62.86 64.19 -1.33* Language grade (max.100) 62.06 68.92 -6.86*** 67.43 69.46 -2.03***
Repeated grade (%) 0.44 0.18 0.26*** 0.29 0.22 0.08***
Dropped out of school (%) 0.32 0.11 0.21*** 0.22 0.12 0.09***
N 401 939 1578 1960
Girls sample
Before After Diff. Before After Diff.
Maths grade (max.100) 55.85 66.80 -10.95*** 65.31 64.07 1.24 Language grade (max.100) 53.13 69.49 -16.36*** 69.80 70.25 -0.45
Repeated grade (%) 0.37 0.16 0.21** 0.20 0.20 -0.01
Dropped out of school (%) 0.44 0.08 0.36*** 0.37 0.10 0.27***
N 54 989 204 2191
During After Diff. During After Diff.
Maths grade (max.100) 60.45 66.80 -6.35*** 62.55 64.07 -1.53** Language grade (max.100) 61.05 69.49 -8.44*** 68.11 70.25 -2.14***
Repeated grade (%) 0.43 0.16 0.27*** 0.27 0.20 0.06***
Dropped out of school (%) 0.27 0.08 0.19*** 0.21 0.10 0.11***
N 319 989 1624 2191
Note: War refers to Tigray and Afar regions, Non-war refers to the rest of regions. ∗p <0.10,∗∗p <
2.4.2
Preliminary Analysis
I begin by plotting mean scores of mathematics and language tests, grade repetition rates, and school dropout rates by birth year and region of exposure to the con-flict. These provide a preliminary indication of the differences in schooling outcomes within each birth-year cohort between conflict-affected and unaffected regions.
Figure 2.2: Mean Maths Score by Year of Birth and Regional Exposure
Source: Author’s analysis based on Young Lives school survey data 2012/13, Ethiopia.
Figure 2.3: Mean Language Score by Year of Birth and Regional Exposure
Source: Author’s analysis based on Young Lives school survey data 2012/13, Ethiopia.
Figure 2.4: Mean Grade Repetition Rate by Year of Birth and Regional Exposure
Source: Author’s analysis based on Young Lives school survey data 2012/13, Ethiopia.
Figure 2.5: Mean School Dropout Rate by Year of Birth and Regional Exposure
In sum, Figures 2.2–2.5 show that, on average, the cohorts of children born either bef oreorduringthe conflict (born in 2000 and earlier) from conflict-affected regions tend have lower mathematics and language scores and a higher grade repetition and school dropout rates compared to those that come from the unaffected regions. However, for those cohorts born after the conflict (from 2001 onwards), there is no significant difference in outcome measures between conflict-affected and unaffected regions, providing preliminary evidence of the effect of the conflict. But, these differences could also reflect regional differences during the pre-conflict period in other factors such as poverty and convergence of these regions during the post-conflict era.
2.5
Theoretical Framework and Empirical
Strat-egy
Suppose a typical education production function model, in line with those discussed in Hanushek (1979) and following Leon (2012) , where the stock of education (St) of an individual at timetis a function of her endowments in each period (E1, ..., Et), the history of educational inputs to which she had access (N1, ..., Nt), factors related to the (time-invariant) demographic characteristics (X), and community characteristics (C1, ..., Ct) such as the availability of schools and teachers.
St=s(E1, ..., Et, N1, ..., Nt, X, C1, ..., Ct) (2.1)
The endowment in each time period, E1, ..., Et, is determined by both demand and
supply-side factors. From a demand side perspective, there are genetic factors (G), household’s endowments (Eh0), and environmental experiences and conditions at
the start of each period (U). The supply side factors are denoted by Ct.
The temporal and regional location of residence jointly determine the exposure to the conflict. I estimate a reduced form linear DID model that allows me to identify the effect of the conflict by estimating changes in education outcomes for cohorts born bef ore or during and af ter the conflict from conflict-affected areas relative to the changes between these cohorts in unaffected areas. This setting provides exogenous variation induced by the time when the conflict started in a specific geographic location.
Yij =c+
X
Rj +α∗bef orei+β∗duringi+π∗ExposedRj +θ∗bef orei∗ExposedRj+γ∗duringi∗ExposedRj+
δ∗Agei∗
X
Rj+Xi+F E+ij
(2.3)
where Yij is the outcome of interest, c is a constant and PRj indicates a set of four region dummies, bef orei takes on the value 1 if a child is born bef ore the war (before 1998) and 0 otherwise while duringi takes on the value 1 if a child is born during the war (from 1998–2000 inclusive) and 0 otherwise. ExposedRj takes on the value 1 for children from the war-affected regions and 0 otherwise. Agei∗
P
Rj
is the interaction of region dummies by age of a child capturing region-specific time trends. Xi includes a vector of child and family level characteristics and F E includes school, grade, class, and teacher level fixed effects. ij is the unobserved error term.
conflict matters more during early childhood than late childhood, I expect γ to be larger than θ both in magnitude and statistical significance.
Exposure to conflict or war can affect both demand- and supply-side factors in different ways. I limit the discussion of such pathways relevant to this context and based on the findings of the study. From the demand side perspective, war can affect individual endowments through many channels. First, war can affect a member of the household, for example, by killing or wounding, affecting household endowments as it brings an income shock for the household. This can then be manifested in terms of reduction of food availability to the household. This is particularly severe in case of poor country households such as Ethiopia where there is binding income constraint and high incidence of vulnerability to malnutrition.
This reduction of food availability could affect indirectly child’s health through it’s effect on maternal nutrition and mental health. Mulder et al. (2002) conclude that maternal psychological factors may significantly contribute to pregnancy complications and unfavorable development of the (unborn) child. Such effects may for instance lead to a low birth weight (Camacho, 2008). In addition, a reduction in the availability of food could directly affect child health or malnutrition. There is a strong link between child health and cognitive development (Grantham-McGregor et al., 2007) .
Second, violence exposure could affect a child’s mental health as a result of traumatic experiences, thereby psychologically affecting children exposed to conflict (Dyregrov et al., 2000; Papageorgiou et al., 2000), which will in turn affect cognitive ability (Currie and Stabile, 2006; Grimard and Laszlo, 2014) .
community educational resources and other relevant infrastructure directly. Fur-thermore it can limit the physical movement of people, including students and teachers. However, such effects seem negligible in this context as in this study (1) the effect of the conflict is not analyzed on school-age children during the conflict and (2) the effect is found on younger children instead of older children, suggesting that the above two pathways are more likely.
Using this DID model, it is possible to identify the causal effect of the con-flict on education outcomes under certain assumptions. First, the key identification assumption for this model is the parallel trend assumption – in the absence of the war, changes in education outcomes are the same across regions. However, if there are region-specific differentials over time with regard to the factors affecting child education, then θ and γ will be biased. Therefore, the extended DID model in equation three above controls for region-specific time trends which are captured by the age with region dummies.
(Section 2.7).
Third, systematic sample selection bias due to differences in mortality rates across regions over time as a result of the war could potentially lead to an underestimate of the true effect. For this reason, the estimated effect should be interpreted as an effect of the war on survivors, that may potentially underestimate the effect on the average cohorts.
While it is not possible to test the common trend assumption directly, the data set contains a rich set of information on child and household specific co-variates, which help to control for several observables. Thus I control for school, grade, class, and teacher level fixed effects and a number of other child and family level characteristics. Controlling for these factors does not change the results qualitatively. Finally, I show that the results pass several falsification tests.
2.6
Results and Discussion
Table 2.3: The Effect of Conflict on Human Capital Accumulation
(1) (2) (3) (4) (5) (6)
VARIABLES Maths Maths Maths Language Language Language
Panel A: All sample
1.before#1.ExposedR -5.898*** -2.008 -1.736 -9.959*** -3.287* -3.002* (1.450) (1.710) (1.683) (1.656) (1.837) (1.717) 1.during#1.ExposedR -3.370*** -1.939** -1.529* -5.765*** -2.833*** -2.410***
(0.740) (0.818) (0.797) (0.806) (0.841) (0.824)
Observations 10,616 10,616 10,616 10,616 10,616 10,616
R-squared 0.036 0.226 0.282 0.041 0.222 0.277
Panel B: Male sample
1.before#1.ExposedR -2.852 -0.149 -0.335 -6.868*** -1.633 -1.958 (1.939) (2.460) (2.381) (2.245) (2.608) (2.442) 1.during#1.ExposedR -2.113** -0.455 0.0719 -4.964*** -2.042* -1.489
(1.056) (1.184) (1.154) (1.138) (1.197) (1.168)
Observations 5,235 5,235 5,235 5,235 5,235 5,235
R-squared 0.025 0.222 0.277 0.026 0.217 0.274
Panel C: Female sample
1.before#1.ExposedR -11.22*** -4.896** -3.023 -15.19*** -5.689** -4.090* (1.896) (2.226) (2.309) (2.170) (2.498) (2.377) 1.during#1.ExposedR -4.830*** -3.907*** -3.463*** -6.589*** -3.906*** -3.565***
(1.029) (1.116) (1.087) (1.137) (1.195) (1.177)
Observations 5,381 5,381 5,381 5,381 5,381 5,381
R-squared 0.056 0.267 0.324 0.061 0.263 0.313
Region FE Y Y Y Y Y Y
Cohort FE Y Y Y Y Y Y
Gender dummy N Y Y N Y Y
Age in yrs N Y Y N Y Y
Age#Region dummies N Y Y N Y Y
Urban dummy N Y Y N Y Y
School FE N Y Y N Y Y
Grade FE N Y Y N Y Y
Class FE N Y Y N Y Y
Teacher FE N Y Y N Y Y
Add.controls N N Y N N Y
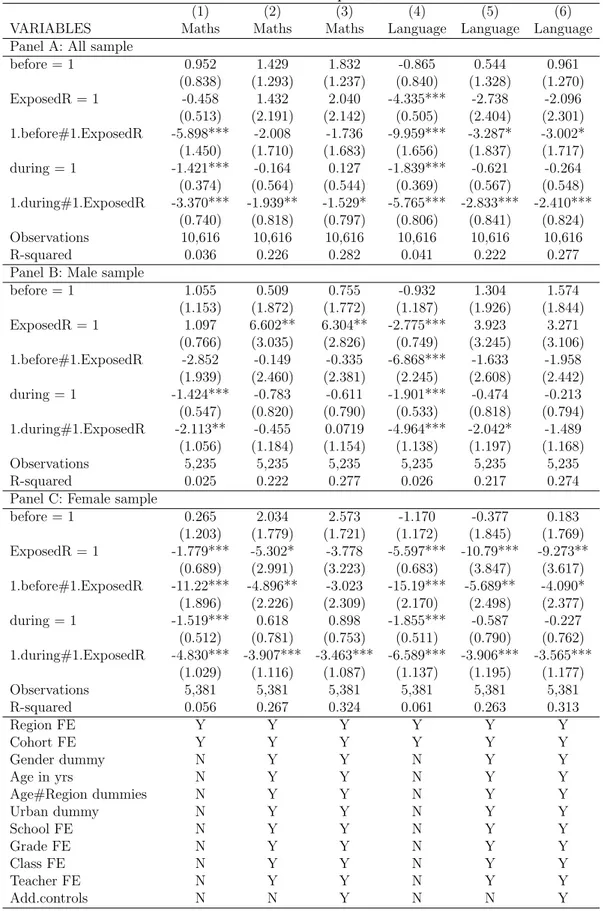
However, the effect on mathematics achievement for those born bef ore the conflict goes away once I control for region-specific time trends and other covariates. But the effect on language achievement remains significant. Looking at Columns 3 and 6 of Table 2.3 (in panel A) reveals that the effect of the conflict on maths and language scores for those born during the conflict is about 1.5 and 2.5 percentage points lower compared to those not exposed. This is a large effect given that it is a long-term effect, which persists 12 years after the event. Panels B and C reveal that the effect is large and highly significant for girls in both mathematics and language scores. The results indicate that girls are severely affected by the conflict, whereas the effect on boys is statistically insignificant. This could be due to household behavior at times of shocks that may result in favoring sons over daughters.
Looking at the literature, the impact of conflict on gender differentials in schooling appears to vary contextually (Buvini¨c et al., 2013). For instance, armed conflict reduces boys’ educational attainment more than that of girls’ in cases where boys participate in the military (Swee et al., 2009) or in contexts where boys are likely to work to compensate conflict-induced shocks (Justino et al., 2013; Rodriguez and Sanchez, 2012). In addition, in cases where girls are less likely to be in school during the pre-conflict period, boys’ educational attainment may decline more than that of girls’ because girls are already less educated (De Walque, 2006; Verwimp and Van Bavel, 2013).4
However, the effect of conflict on girls’ schooling could be more severe than boys’ if parents seek to protect their girls from rape and other threats (Shemyakina, 2011a) or when households’ resource allocation decisions favor boys over girls (Singh and Shemyakina, 2016). In Ethiopia, Hadley et al. (2008) find evidence that support their hypothesis that “where girls have historically experienced discrimination, buffering is preferentially aimed at boys, especially as the household
Table 2.4: The Effect of Conflict on Human Capital Accumulation (2)
(1) (2) (3) (4) (5) (6)
Repeat Repeat Repeat Dropout Dropout Dropout Panel A: All sample
1.before#1.ExposedR 0.155*** -0.0626 -0.0848 0.0230 -0.109** -0.0999* (0.0441) (0.0535) (0.0529) (0.0453) (0.0540) (0.0537) 1.during#1.ExposedR 0.182*** 0.115*** 0.102*** 0.0957*** 0.0468** 0.0477** (0.0227) (0.0261) (0.0256) (0.0204) (0.0230) (0.0229)
Observations 10,616 10,616 10,616 10,616 10,616 10,616
R-squared 0.049 0.102 0.132 0.051 0.093 0.105
Panel B: Male sample
1.before#1.ExposedR 0.114** -0.119 -0.132* -0.00478 -0.0748 -0.0680 (0.0563) (0.0756) (0.0737) (0.0565) (0.0718) (0.0716) 1.during#1.ExposedR 0.163*** 0.0841** 0.0747** 0.111*** 0.0768** 0.0731** (0.0314) (0.0378) (0.0371) (0.0285) (0.0329) (0.0326)
Observations 5,235 5,235 5,235 5,235 5,235 5,235
R-squared 0.050 0.111 0.144 0.053 0.108 0.119
Panel C: Female sample
1.before#1.ExposedR 0.197*** -0.0316 -0.0600 0.0863 -0.106 -0.0942 (0.0727) (0.0821) (0.0847) (0.0764) (0.0904) (0.0898) 1.during#1.ExposedR 0.198*** 0.146*** 0.131*** 0.0767*** 0.0150 0.0208
(0.0331) (0.0371) (0.0365) (0.0292) (0.0329) (0.0328)
Observations 5,381 5,381 5,381 5,381 5,381 5,381
R-squared 0.053 0.121 0.149 0.053 0.099 0.114
Region FE Y Y Y Y Y Y
Cohort FE Y Y Y Y Y Y
Gender dummy N Y Y N Y Y
Age in yrs N Y Y N Y Y
Age#Region dummies N Y Y N Y Y
Urban dummy N Y Y N Y Y
School FE N Y Y N Y Y
Grade FE N Y Y N Y Y
Class FE N Y Y N Y Y
Teacher FE N Y Y N Y Y
Add.controls N N Y N N Y
The estimates in Table 2.4 suggest that xposure to the conflict increases the likelihood of repeating a grade and school dropout, on average, by about 10 and 5 percentage points, respectively (Columns 3 and 6 of Table 2.4). Consistent with previous test score results, the effect of conflict on repeating a grade is larger for girls compared to boys, 13 and 7.5 percentage points, respectively. However, exposure to the conflict increases school dropout of boys only. This may be due to higher school dropout rates of girls during the pre-conflict period (De Walque, 2006; Verwimp and Van Bavel, 2013).
Similar to the test score analysis, this chapter also ascertains the effect on grade repetition and school dropout for cohorts born during the conflict (in contrast to those born bef ore the conflict) compared to those born af ter the conflict. These effects are large in magnitude, given that the mean rate of grade repetition and school dropout across the entire sample is 24 and 17 percent, respectively. Surprisingly, older cohorts born in conflict-affected areas bef ore the conflict exhibit lower school dropout rates compared to younger cohorts born in conflict-unaffected areas af ter the conflict (Columns 5 and 6, Panel A) and these numbers are driven by the male sample (Column 3, Panel B).
2.7
Further Sensitivity Analysis
in Table 2.5 below.
Indeed the results in Tables 2.5 support this hypothesis and all the parame-ters are statistically insignificant even at a 10 percent level of significance. This suggests that the younger cohorts constitute suitable counterfactual for the older cohorts after controlling for cohort and region fixed effects.
Table 2.5: Falsification Test: The Effect of Conflict on Human Capital Accumulation
(1) (2) (3) (4) (5) (6) Panel A Maths Maths Maths Language Language Language
1.Older#1.ExposedR 2.043 -1.110 -0.769 0.845 -0.793 -0.315 (1.486) (1.676) (1.614) (1.571) (1.635) (1.566)
Observations 3,376 3,376 3,376 3,376 3,376 3,376 R-squared 0.053 0.303 0.350 0.051 0.309 0.362 Panel B Repeat Repeat Repeat Dropout Dropout Dropout
1.Older#1.ExposedR -0.0458 0.0248 0.0238 -0.0302 -0.00730 -0.0138 (0.0380) (0.0458) (0.0459) (0.0315) (0.0350) (0.0352)
Observations 3,376 3,376 3,376 3,376 3,376 3,376 R-squared 0.013 0.119 0.137 0.003 0.081 0.090
Region FE Y Y Y Y Y Y
Cohort FE Y Y Y Y Y Y
Gender dummy N Y Y N Y Y
Age in yrs N Y Y N Y Y
Age#Region dummies N Y Y N Y Y
Urban dummy N Y Y N Y Y
School FE N Y Y N Y Y
Grade FE N Y Y N Y Y
Class FE N Y Y N Y Y
Teacher FE N Y Y N Y Y
Add.controls N N Y N N Y
Table 2.6: Falsification Test II: The Effect of Conflict on Human Capital Accumulation
(1) (2) (3) (4) (5) (6)
VARIABLES Maths Maths Maths Language Language Language
1.before#1.Addis Ababa -1.788 1.593 2.133 -0.342 -0.0203 0.278 (2.032) (3.358) (3.197) (1.849) (3.219) (3.079) 1.during#1.Addis Ababa -3.990*** -1.515 -1.345 -3.494*** -2.034 -1.880
(0.900) (1.408) (1.358) (0.823) (1.326) (1.276)
1.before#1.Amhara 5.250* -0.724 1.471 4.379* 0.336 2.019
(3.058) (4.698) (4.181) (2.658) (4.523) (4.062)
1.during#1.Amhara 1.159 -2.143 -0.602 1.456 -1.376 0.118
(1.192) (1.911) (1.748) (1.125) (1.860) (1.746)
1.before#1.Oromia 2.553 -6.308 -7.828* 3.561 2.455 1.207
(2.390) (4.346) (4.063) (2.559) (4.930) (4.615)
1.during#1.Oromia 2.188* -1.858 -2.563 1.109 0.379 -0.245
(1.121) (1.968) (1.840) (1.206) (2.069) (1.943) 1.before#1.SNNP -3.767** -0.00412 0.0228 -2.439 -5.421* -5.188* (1.663) (2.859) (2.719) (1.710) (3.022) (2.880)
1.during#1.SNNP 0.847 3.031** 2.674** 2.028*** 0.822 0.468
(0.766) (1.268) (1.213) (0.766) (1.306) (1.258)
1.before#1.Somalia 2.430 2.963 1.476 -1.786 6.816* 5.516
(2.026) (3.646) (3.533) (2.488) (3.899) (3.784)
1.during#1.Somalia 1.425 0.370 -0.0819 -0.726 2.568 2.116
(0.973) (1.722) (1.683) (1.046) (1.747) (1.721)
Observations 7,810 7,810 7,810 7,810 7,810 7,810
Region FE Y Y Y Y Y Y
Cohort FE Y Y Y Y Y Y
Gender dummy N Y Y N Y Y
Age in yrs N Y Y N Y Y
Age#Region dummies N Y Y N Y Y
Urban dummy N Y Y N Y Y
School FE N Y Y N Y Y
Grade FE N Y Y N Y Y
Class FE N Y Y N Y Y
Teacher FE N Y Y N Y Y
Add.controls N N Y N N Y
The results in Table 2.6 show that there is no effect in the five Placebo regions in terms of both mathematics and language achievement (except in mathematics achievement for SNNP and Oromia regions). The results in Table 2.7 show that, after controlling for all observables, there is usually no effect on grade repetition and school dropout (except in the Addis Ababa and Oromia regions) when the Placebo regions are being compared. Although I observe a few significant results, this does not mean that the former estimates of the effect of conflict are biased. That is, the identification strategy requires a parallel trend assumption of treatment and control regions on average but it does not necessarily require a parallel trend assumption of the treatment regions compared to each of the control regions.5
5Observing a few significant estimates should not be a serious concern. I repeat the main
Table 2.7: Falsification Test II: The Effect of Conflict on Human Capital Accumulation (2)
(1) (2) (3) (4) (5) (6)
Repeat Repeat Repeat Dropout Dropout Dropout
1.before#1.Addis Ababa -0.00690 -0.180** -0.165* 0.119** 0.138 0.127 (0.0464) (0.0902) (0.0883) (0.0535) (0.0887) (0.0876) 1.during#1.Addis Ababa 0.0595** 0.00359 0.00146 0.0224 0.0282 0.0203
(0.0237) (0.0412) (0.0404) (0.0202) (0.0356) (0.0355) 1.before#1.Amhara -0.0659 -0.177 -0.167 -0.0567 -0.222* -0.210*
(0.0662) (0.132) (0.129) (0.0685) (0.121) (0.120) 1.during#1.Amhara 0.0374 -0.0207 -0.0419 0.0351 -0.0399 -0.0458 (0.0330) (0.0600) (0.0592) (0.0282) (0.0515) (0.0509)
1.before#1.Oromia 0.0265 0.138 0.149 0.0111 0.0890 0.0989
(0.0572) (0.107) (0.104) (0.0722) (0.127) (0.127) 1.during#1.Oromia -0.0455* 0.00126 0.0142 0.0721** 0.107** 0.109** (0.0253) (0.0461) (0.0452) (0.0286) (0.0534) (0.0532)
1.before#1.SNNP 0.0473 0.102 0.0769 0.0797 -0.00795 -0.0125
(0.0461) (0.0880) (0.0869) (0.0499) (0.0845) (0.0838) 1.during#1.SNNP 0.0258 0.0328 0.0397 0.00608 -0.0280 -0.0249
(0.0220) (0.0400) (0.0393) (0.0189) (0.0345) (0.0343) 1.before#1.Somalia -0.0502 0.101 0.105 -0.260*** -0.0731 -0.0628
(0.0466) (0.0861) (0.0846) (0.0486) (0.0854) (0.0852) 1.during#1.Somalia -0.123*** -0.0428 -0.0445 -0.140*** -0.0521 -0.0411
(0.0236) (0.0431) (0.0429) (0.0208) (0.0380) (0.0379)
Observations 7,810 7,810 7,810 7,810 7,810 7,810
Region FE Y Y Y Y Y Y
Cohort FE Y Y Y Y Y Y
Gender dummy N Y Y N Y Y
Age in yrs N Y Y N Y Y
Age#Region dummies N Y Y N Y Y
Urban dummy N Y Y N Y Y
School FE N Y Y N Y Y
Grade FE N Y Y N Y Y
Class FE N Y Y N Y Y
Teacher FE N Y Y N Y Y
Add.controls N N Y N N Y
2.8
Conclusion
This paper examines the long-term casual effect of the 1998–2000 Ethiopia–Eritrea conflict on human capital accumulation in Ethiopia. I find that, on average, exposure to the conflict during early childhood decreases girls’ achievement in mathematics and language scores by about 3.5 percentage points 12 years later. One explanation for this result could be discriminatory behavior of households in ways that favor boys at times of conflict-induced shocks. In addition, exposure to the conflict increases the likelihood of grade repetition among both boys and girls. It also increases the likelihood of school dropout of boys. This finding may be due to initial higher school dropout rates among girls during the pre-conflict period. Given strong evidence of the effect of early-life education on outcomes during adulthood, these results highlight that the long-term consequences of the 1998–2000 Ethiopia–Eritrea conflict are far reaching.
This chapter contributes to the literature by extending the fairly common analysis of the effect of conflict on school enrollment or the number of years of schooling to test scores and to grade repetition and school dropout. It also gener-ates empirical evidence on gender differences in the effect of exposure to conflict. Interestingly, consistent with the medical science literature (Heckman, 2007; Lucas, 1998; Lucas et al., 1999; Martorell, 1999), the effect was observed only for those who were born during the conflict in contrast to those who were born bef ore the conflict, suggesting that exposure to the conflict in early childhood has a persistent effect in contrast to late childhood exposure. This evidence implies that, unlike young children, children who are exposed to the conflict at relatively older stages of their development have the possibility to catch up in terms of educational outcomes.
2.9
Appendix
Figure 2.A: Mean School Dropout Rate by Year of Birth and Gender
Note: This figure shows mean school dropout rates for each birth-year cohort across the entire sample. Source: Author’s own calculations based on Young Lives school survey data 2012/13,
Table 2.A: The Effect of Conflict on Human Capital Accumulation: Extended Results
(1) (2) (3) (4) (5) (6)
VARIABLES Maths Maths Maths Language Language Language
Panel A: All sample
before = 1 0.952 1.429 1.832 -0.865 0.544 0.961
(0.838) (1.293) (1.237) (0.840) (1.328) (1.270)
ExposedR = 1 -0.458 1.432 2.040 -4.335*** -2.738 -2.096
(0.513) (2.191) (2.142) (0.505) (2.404) (2.301) 1.before#1.ExposedR -5.898*** -2.008 -1.736 -9.959*** -3.287* -3.002* (1.450) (1.710) (1.683) (1.656) (1.837) (1.717)
during = 1 -1.421*** -0.164 0.127 -1.839*** -0.621 -0.264
(0.374) (0.564) (0.544) (0.369) (0.567) (0.548) 1.during#1.ExposedR -3.370*** -1.939** -1.529* -5.765*** -2.833*** -2.410***
(0.740) (0.818) (0.797) (0.806) (0.841) (0.824)
Observations 10,616 10,616 10,616 10,616 10,616 10,616
R-squared 0.036 0.226 0.282 0.041 0.222 0.277
Panel B: Male sample
before = 1 1.055 0.509 0.755 -0.932 1.304 1.574
(1.153) (1.872) (1.772) (1.187) (1.926) (1.844)
ExposedR = 1 1.097 6.602** 6.304** -2.775*** 3.923 3.271
(0.766) (3.035) (2.826) (0.749) (3.245) (3.106) 1.before#1.ExposedR -2.852 -0.149 -0.335 -6.868*** -1.633 -1.958
(1.939) (2.460) (2.381) (2.245) (2.608) (2.442)
during = 1 -1.424*** -0.783 -0.611 -1.901*** -0.474 -0.213
(0.547) (0.820) (0.790) (0.533) (0.818) (0.794) 1.during#1.ExposedR -2.113** -0.455 0.0719 -4.964*** -2.042* -1.489
(1.056) (1.184) (1.154) (1.138) (1.197) (1.168)
Observations 5,235 5,235 5,235 5,235 5,235 5,235
R-squared 0.025 0.222 0.277 0.026 0.217 0.274
Panel C: Female sample
before = 1 0.265 2.034 2.573 -1.170 -0.377 0.183
(1.203) (1.779) (1.721) (1.172) (1.845) (1.769) ExposedR = 1 -1.779*** -5.302* -3.778 -5.597*** -10.79*** -9.273**
(0.689) (2.991) (3.223) (0.683) (3.847) (3.617) 1.before#1.ExposedR -11.22*** -4.896** -3.023 -15.19*** -5.689** -4.090* (1.896) (2.226) (2.309) (2.170) (2.498) (2.377)
during = 1 -1.519*** 0.618 0.898 -1.855*** -0.587 -0.227
(0.512) (0.781) (0.753) (0.511) (0.790) (0.762) 1.during#1.ExposedR -4.830*** -3.907*** -3.463*** -6.589*** -3.906*** -3.565***
(1.029) (1.116) (1.087) (1.137) (1.195) (1.177)
Observations 5,381 5,381 5,381 5,381 5,381 5,381
R-squared 0.056 0.267 0.324 0.061 0.263 0.313
Region FE Y Y Y Y Y Y
Cohort FE Y Y Y Y Y Y
Gender dummy N Y Y N Y Y
Age in yrs N Y Y N Y Y
Age#Region dummies N Y Y N Y Y
Urban dummy N Y Y N Y Y
School FE N Y Y N Y Y
Grade FE N Y Y N Y Y
Class FE N Y Y N Y Y
Teacher FE N Y Y N Y Y
Add.controls N N Y N N Y