This is a repository copy of
Errors in the shielding effectiveness of cavities due to
stair-cased meshing in FDTD: Application of empirical correction factors
.
White Rose Research Online URL for this paper:
http://eprints.whiterose.ac.uk/120548/
Version: Accepted Version
Proceedings Paper:
Bourke, S. A., Dawson, J. F. orcid.org/0000-0003-4537-9977, Flintoft, I. D.
orcid.org/0000-0003-3153-8447 et al. (1 more author) (2017) Errors in the shielding
effectiveness of cavities due to stair-cased meshing in FDTD: Application of empirical
correction factors. In: 2017 International Symposium on Electromagnetic Compatibility -
EMC EUROPE. EMC Europe 2017, 04-08 Sep 2017 , Angers .
https://doi.org/10.1109/EMCEurope.2017.8094791
[email protected] https://eprints.whiterose.ac.uk/
Reuse
["licenses_typename_other" not defined]
Takedown
If you consider content in White Rose Research Online to be in breach of UK law, please notify us by
Errors in the shielding effectiveness of cavities due
to stair-cased meshing in FDTD: Application of
empirical correction factors
S. A. Bourke, J. F. Dawson, I. D. Flintoft, M. P. Robinson
Department of ElectronicsUniversity of York York, UK
samuel.bourke, john.dawson, ian.flintoft, [email protected]
Abstract—The errors, due to stair-cased meshing, in the Shielding Effectiveness (SE) of cavities modelled with thin bound-aries, in the Finite-Difference Time-Domain (FDTD) method, are examined. The errors in SE are found to be associated with the error in the surface area of the cavity caused by the use of a stair-cased mesh. An empirical solution is demonstrated, which improves the stair-cased model accuracy to be comparable to that achievable by a conformal model. Errors in the resonant frequencies ,Q factors and field minima of a cavity, due to the stair-cased mesh, are also noted.
Index Terms—Finite-Difference Time-Domain, Shielding Effec-tiveness, Stair-cased Mesh, Thin Layer
I. INTRODUCTION
The Finite-Difference Time-Domain (FDTD) method is a popular numerical method originally formulated to solve Maxwell’s equations [1], however it has since been appro-priated by other fields, most commonly acoustics. FDTD’s popularity lies in its simple implementation and efficient computation.
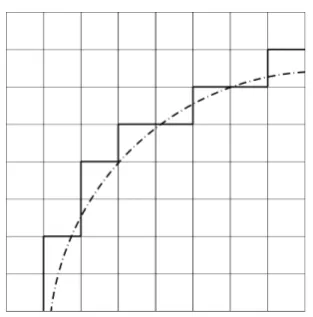
A commonly cited source of error in FDTD, and indeed other CEM techniques that rely on a cuboid grid such as TLM, is stair-casing. This describes the approximation used when modelling a surface that does not align with the orthogonal finite-difference grid. Fig. 1 shows an example of a stair-cased approximation where the black lines represent the approxima-tion used to represent a non-aligned and curved surface given by the dotted line.
Stair-casing is frequently used in electromagnetic simula-tions as it requires no extra effort to implement (it is inherent to the basic FDTD method) and can provide reasonably accurate results. It is especially common when creating simulations using thin layer models as many of those models rely on the cuboid grid to function [2]–[4].
The errors caused by stair-casing for scattering from flat conductive sheets have been analysed by Cangellaris and Wright [5] where they determined that numerical dispersion is introduced by stair-cased boundaries. Later Holland [6] published work that considered the scattering from a 2D PEC cylinder, it was determined that accurate results could be
Fig. 1. Representation of a stair-cased approximation of a curved surface where the dotted line is the curved surface and the solid lines are the approximation.
achieved using a stair-cased mesh if the mesh size was small enough, however use of a conformal technique could achieve a reduction in run time by an approximate factor of 256 by allowing a coarser mesh. The problem of scattering from curved surfaces was revisited by H¨aggblad [7] who showed that the large errors were found close to the surface, but the errors observed further from the surface were reduced.
Previous work on stair-casing has focused mainly on errors in scattering. This paper considers the effect of stair-casing on the shielding effectiveness (SE) of cavities.
The SE of a closed cavity is determined by both the material composition of the enclosure, and its shape. SE is defined in this paper as a ratio between the incident external electric field, Einc and the electric field,Eint, at a point inside the cavity, usually the centre; in decibels this is given by:
SE = 20log10(Einc
Eint) (1)
In Section II the effect of stair-casing on the SE of a spherical cavity is examined, and a new empirical method to correct the error is applied.
In Section III the empirical method is extended and applied to a cubic cavity to demonstrate its broader application. 978-1-5386-0689-6/17/$31.00 ©2017 IEEE
© 2017 IEEE. Personal use of this material is permitted. Permission from IEEE must be obtained for all other uses, in any current or future
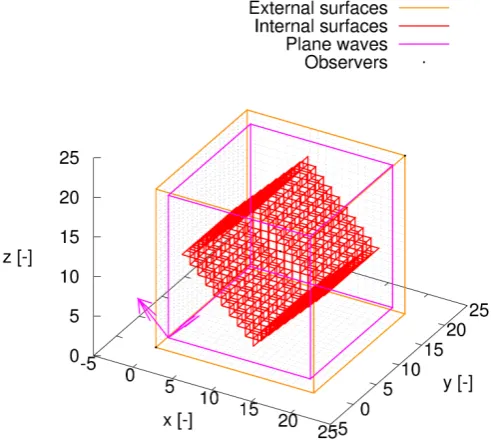
media, including reprinting/republishing this material for advertising or promotional purposes, creating new collective works, for resale or redistribution to servers or lists, or reuse of any copyrighted component of this work in other works. [image:2.595.351.508.236.395.2]Fig. 2. Set-up of a 1 m radius hollow spherical shell made from a material with a conductivity of 1 kS/m that is 1 mm thick. The shell is illuminated by a polarised plane wave.
0 10 20 30 40 50 60 70
0 50 100 150 200 250 300 350
SE (dB)
Frequency (MHz)
Analytic Stair-cased
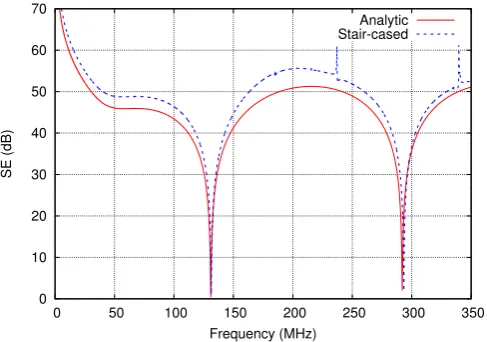
Fig. 3. Shielding effectiveness at centre of spherical cavity.
II. SPHERICALTESTCASE
A spherical shell is used initially, as an analytic solution for its SE is available. Each type of error in the stair-cased FDTD model will be identified and discussed to determine its cause and potential solutions.
The curved structure of the shell requires significant use of stair-casing approximations as shown in Fig. 2. The mesh shown was generated using our structured mesh generator [8]. The spherical shell used has a radius of 1 m and a shell thickness of 1 mm. The shell is made from an isotropic material with a conductivity of 1 kS/m. The shell is represented using a Surface Impedance Boundary Condition (SIBC) thin layer model [2] in order to avoid the need for an extremely fine mesh to model the thickness of the shell. The mesh size used is 20 mm. The structure is illuminated by a linearly polarised plane-wave and the electric field at the centre of the sphere is recorded in order to determine the SE of the shell.
Fig. 3 shows the results of the simulation in comparison to the analytic SE [9]. There are a number of discrepancies between the simulated result and the analytic solution. The
0 0.5 1 1.5 2
30 40 50 60 70 80
Error in Resonant Frequency (%)
[image:3.595.307.547.53.225.2]dx (mm)
Fig. 4. Error in resonant frequencies for a stair-cased spherical shell using different mesh sizes.
most commonly documented [10], [11] error is in the value of the resonant frequencies. In Fig. 3 the frequency of each resonance is approximately 0.5 % too high; this error can be reduced by decreasing the mesh size; the effect of doing so is shown in Fig. 4. A small amount of this error can be attributed to dispersion of the wave as it propagates along the mesh, this is discussed in Section III.
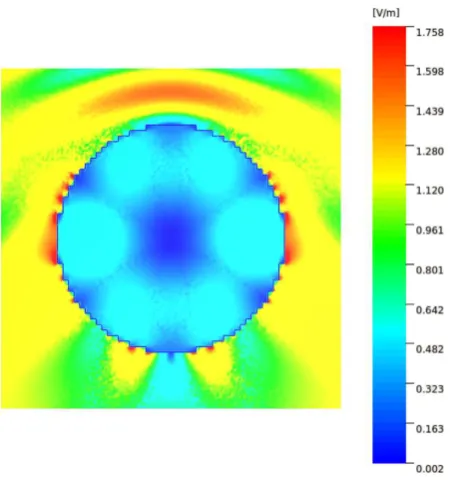
It can also be seen in Fig. 3 that there are resonances in the simulated results which are not present in the analytic solution. These extra features correspond to those resonances that have a node at the centre of the sphere (i.e. on the observation point). Fig. 5 shows a cross section plot of the E-field magnitude across the sphere at 237.6 MHz generated by the CONCEPT II, MoM based code [12] using a stair-cased representation. The light areas inside the sphere denote field maxima and the dark areas show low field values. This frequency corresponds to an unexpected resonance peak from Fig. 3. It can be seen that there is a resonance at this frequency that has a node at the centre of the sphere. Fig. 6 shows the magnitude of the electric field across the diameter at the same frequency. It can be seen that the electric field is greatly reduced near the centre, as would be expected at a node. However at the exact centre there is an increase in magnitude in both lines; in the FDTD case the increase is larger than in the MoM solution. The analytical solution assumes a mathematically perfect sphere, which has a node at the centre, however for both the structured and unstructured meshes a numerical approximation to a sphere is used; the field at the centre of the sphere is highly sensitive to changes in the structure of the sphere.
[image:3.595.43.287.264.435.2]Fig. 5. Planar E-Field plot for a cross section of the inside of the sphere at 237.6 MHz.
-100 -80 -60 -40 -20 0
-1 -0.8 -0.6 -0.4 -0.2 0 0.2 0.4 0.6 0.8 1
E-Field (V/m dB)
Distance from centre of sphere (m) Stair-cased Mesh Unstructured Mesh
Fig. 6. Line plot of E-field across spherical cavity at 237.6 MHz
surface area of the shell to the error in magnitude of the SE. It is apparent that the two errors are correlated. Unlike the error in the resonant frequency, the error in surface area cannot be improved by reducing the mesh size. The error in surface area is consistently around 49 % regardless of the mesh size used. As a result of this the error in magnitude of SE cannot be improved by reducing the mesh size.
A. Thin Layer correction factor
To compensate for the error in the magnitude of the surface area we applied a correction factor that increased the magnetic field on the surface of the thin boundaries used to represent the shell, this served to amplify the transmission and reflection coefficients of the thin layer to counteract the larger loss that
38 40 42 44 46 48 50
55 56 57 58 59 60
Error (%)
dx (mm)
[image:4.595.303.548.52.224.2]Error in Surface Area Error in SE
Fig. 7. Comparison of the effective surface area of the stair-cased spherical shell and the error in magnitude of SE.
0 10 20 30 40 50 60 70
0 50 100 150 200 250 300 350
SE (dB)
Frequency (MHz) Analytic
[image:4.595.306.549.274.443.2]Stair-cased Conformal Modified Stair-case
Fig. 8. Shielding effectiveness at the centre of the hollow spherical shell for different FDTD methods.
has been observed. This correction factor is applied as an average across the entire surface of the sphere. In this case the empirically determined average correction factor used is 1.4 .
Fig. 8 shows a comparison of the SE at the centre of the sphere using the corrected thin layer model and the original thin layer model, there is also a comparison to a conformal FDTD model [13]. It can be seen that the correction factor has improved the magnitude of the SE considerably, with reduction in the error from approximately 3 dB to less than 1 dB. It can also be seen the the error in magnitude is now less than that of the conformal technique. However the resonant frequency is not affected by this correction and its error is still greater for the stair-cased mesh than the conformal one.
III. CUBETESTCASE
[image:4.595.43.282.339.509.2]Fig. 9. Set-up of a 1 m hollow cubic shell made from a material with a conductivity of 1 kS/m that is 1 mm thick. The shell is illuminated by a polarised plane wave.
grid. To further test the use of a correction factor, a cubic cavity is investigated. Ordinarily a single cuboid structure could be made to align with the FDTD grid, in this case there would be no stair-casing errors. However if the cube is rotated with respect to the grid, as shown in Fig. 9, then stair-casing is required to represent those surfaces that are no longer aligned. The shell of the cube is constructed of the same conductive material as in the spherical test case and has the same thickness.
The cube is rotated around a single axis, this causes four of the faces to no longer be aligned with the grid and require a cased approximation. The extra surface area for a stair-cased face can be determined by considering the coarse and fine stair-cased approximations of a line as shown in Fig. 10. The length of the coarse stair-cased approximation is the same as the length of the fine stair-cased approximation as:
S1= n X
i=1
Ai , S2=
n X
i=1
Bi (2)
Where S1 and S2 are the lengths of the y- andx-orientated sides of the coarse approximation respectively. ai and bi are the lengths of the y and x orientated sides of the fine approximation respectively. The two sides of the coarse stair-cased approximation can be related to the length of the original line Lby:
S1=LcosΘ, S2=LsinΘ (3)
WhereΘis the angle of rotation of the line to the orthogonal grid. And therefore the length of a stair-cased approximation of a flat surface in 2D is given by:
S=S1+S2=L(sinΘ +cosΘ) (4)
1 1.2 1.4 1.6 1.8 2 2.2 2.4 2.6 2.8 3
0 5 10 15 20 25 30 35 40 45
Correction Factor
Θ
[image:5.595.309.549.53.224.2]Emiprical Correction Factor Fitted Correction Factor
Fig. 11. Fitted and empirically determined correction factor for different angles for the cubic shell.
Fig. 10. Coarse (Dot Dashed) and fine (Dashed) stair-cased approximations of a straight line (Solid)
The total error in surface area of the meshed cube due to the stair-cased faces is therefore given by:
A=L(cosΘ +sinΘ−1) (5)
It is worth noting that (4) does not depend on the mesh size and therefore cannot be improved by using a higher resolution mesh.
For the cubic shell case the correction factor does not need to be applied to all the thin layer surfaces, only those that contribute to a stair-cased surface. The optimal magnitude of the correction factor is first determined empirically by employing a parameter sweep varying the angle of rotation and correction factor. A fit is then made to the empirical data in Fig. 11 such that the optimal corrected transmission coefficient is given by:
τc=τo(cosΘ +sinΘ)3
(6)
[image:5.595.44.290.54.274.2] [image:5.595.307.557.277.427.2]-20 0 20 40 60 80 100 120
5 10 15 20 25 30 35 40 45
Error in SE (%)
Θ
[image:6.595.43.284.53.223.2]Stair-cased Modified Stair-cased
Fig. 12. Error in SE for cubes meshed at different angles with and without a correction factor applied.
just the shielding effectiveness of the cavity, but also the Q factor. The Q factor is related to the transmission and reflection coefficients of the cavity wall material by:
Q∝ 1
τ+ρ (7)
From (7) it can be seen that the sum of the transmission and reflection coefficients must remain constant if the Q-factor is to remain constant, when the transmission coefficient is modified. Therefore the modified reflection coefficient is given by:
ρc=ρo+τo(1−(cosΘ +sinΘ)3) (8)
For the unmodified thin layer model using a 50 mm mesh results in errors in SE of more than 120% at the highest rotational offsets in comparison to a cube aligned with the FDTD grid. When using the correction factor method, de-scribed above, the errors in SE were reduced to less than 10% for all angles as shown in Fig. 12. This is an improvement in error from more than 5 dB to less than 0.4 dB. The size of the error is largely unaffected by the mesh size chosen as this will not affect the surface area much except in the case of exceptionally coarse meshes.
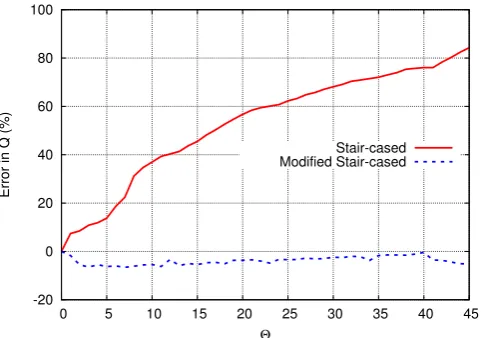
A comparison of SE over a range of frequencies for a cube rotated 45° is shown in Fig 13. The magnitude of the SE is consistently closer to the result obtained from the aligned cube in the corrected case. The Q factor of the first four resonances is presented in Fig 14. Without applying the correction factor, the Q is nearly doubled when using a stair-cased approximation at 45° compared to the aligned cube case. After applying the correction factor the error in the Q is reduced from greater than 80 % to less than 10 % at the first resonance. Fig 15 shows how the error in Q varies with the angle of rotation. It can be seen that the application of the correction factor has reduced the error for all angles.
The accuracy of the resonant frequency of the rotated cube has not been improved by the corrections to the boundary
0 10 20 30 40 50 60 70
0 50 100 150 200 250 300
SE (dB)
Frequency (MHz)
Aligned mesh Θ = 0
Stair-cased mesh Θ = 45
[image:6.595.307.550.59.230.2]Modified Stair-cased mesh Θ = 45
Fig. 13. Comparison of SE for a cube rotated 45° with and without a correction factor applied.
0 100 200 300 400 500 600
200 250 300 350 400 450 500 550 600
Q
Frequency (MHz)
Aligned mesh: Θ = 0 Stair-cased mesh: Θ = 45
Modified Stair-cased mesh: Θ = 45
Fig. 14. Comparison of Q factor for the first four resonances at different angles with and without a correction factor applied.
-20 0 20 40 60 80 100
0 5 10 15 20 25 30 35 40 45
Error in Q (%)
Θ
Stair-cased Modified Stair-cased
[image:6.595.307.548.284.456.2] [image:6.595.307.548.511.680.2]reflection and transmission coefficients, as the error in the resonant frequency depends on the error in the geometry of the cube, along with the dispersion, and anisotropy of the mesh.
For the aligned cube the error in resonant frequency is about 0.05%. This we attribute to mesh dispersion and anisotropy. This means that the effect of stair-casing dominates the error in the non-aligned case
Unlike for the spherical shell, the correction factor given by (6) can be applied to any flat surface that is rotated along a single axis in relation to the mesh.
IV. CONCLUSIONS ANDFURTHERWORK
The errors, in the SE of a cavity, due to stair-cased meshing have been demonstrated and their causes identified. It has been determined that errors in the resonant frequency of stair-cased cavities can be improved by using a finer mesh. However the error in the surface area of stair-cased cavities, and the associated error in SE, is not affected by the mesh size.
A method of correcting errors related to the effective surface area has been proposed to improve the accuracy of non-aligned thin layer models without the need to develop the thin layer as a conformal model. A specific solution has been presented for a spherical cavity that produced magnitudes of SE comparable to results from conformal simulations. A solution is given for correction of stair-cased meshing of flat surfaces at arbitrary angles about one axis and validated using a cubic model considering both the shielding effectiveness and Q factor.
It has been demonstrated that the use of a correction factor for stair-cased meshes produces results of similar or improved accuracy in comparison to a conformal model. However, unlike the conformal model, there is no improvement in the accuracy of the frequency response. A strong advantage of the correction factor is the minimal amount of effort involved in its implementation.
REFERENCES
[1] K. Yee, “Numerical solution of initial boundary value problems in-volving maxwell’s equations in isotropic media,”IEEE Transactions on Antennas and Propagation, vol. 14, pp. 302–307, May 1966. [2] J. F. Dawson, I. D. Flintoft, S. A. Bourke, , M. P. Robinson, M. R.
Cabello, and J. Alvarez, “Face centered anisotropic surface impedance boundary conditions in FDTD: Improved performance of staircase mesh for shielding problems,” submitted to IEEE MTT-S International Conference on Numerical Electromagnetic and Multiphysics Modeling and Optimization for RF, Microwave, and Terahertz Applications 2017. [3] J. G. Maloney and G. S. Smith, “The efficient modeling of thin material sheets in the finite-difference time-domain (FDTD) method,” IEEE Transactions on Antennas and Propagation, vol. 40, pp. 323–330, Mar 1992.
[4] V. Nayyeri, M. Soleimani, and O. Ramahi, “A method to model thin conductive layers in the finite-difference time-domain method,” Electromagnetic Compatibility, IEEE Transactions on, vol. 56, pp. 385– 392, April 2014.
[5] A. C. Cangellaris and D. B. Wright, “Analysis of the numerical error caused by the stair-stepped approximation of a conducting boundary in FDTD simulations of electromagnetic phenomena,”IEEE Transactions on Antennas and Propagation, vol. 39, pp. 1518–1525, Oct 1991. [6] R. Holland, “Pitfalls of staircase meshing,” IEEE Transactions on
Electromagnetic Compatibility, vol. 35, pp. 434–439, Nov 1993. [7] J. H¨aggblad and O. Runborg, “Accuracy of staircase approximations
in finite-difference methods for wave propagation,”Numerische Mathe-matik, vol. 128, no. 4, pp. 741–771, 2014.
[8] M. K. Berens, I. D. Flintoft, and J. F. Dawson, “Structured mesh generation: Open-source automatic nonuniform mesh generation for FDTD simulation.,”IEEE Antennas and Propagation Magazine, vol. 58, pp. 45–55, June 2016.
[9] F. M. Tesche, “Electromagnetic field shielding of a spherical shell– revisited,”Forum for Electromagnetic Research Methods and Applica-tion Technologies, vol. 3, 5-6 2014.
[10] S. Dey and R. Mittra, “A modified locally conformal finite-difference time-domain algorithm for modeling three-dimensional perfectly con-ducting objects,”Microwave and Optical Technology Letters, vol. 17, no. 6, pp. 349–352, 1998.
[11] W. Yu and R. Mittra, “A conformal finite difference time domain technique for modeling curved dielectric surfaces,” IEEE Microwave and Wireless Components Letters, vol. 11, pp. 25–27, Jan 2001. [12] “Technische Universit¨at Hamburg-Harburg. the CONCEPT-II website
(2016). [online]. available: http://www.tet.tuhh.de/concept..”