Int. J. Electrochem. Sci., 4 (2009) 535 - 550
International Journal of
ELECTROCHEMICAL
SCIENCE
www.electrochemsci.org
Acid-base Properties of Tunisian Glauconite in Aqueous
Suspensions
A. Kriaa1,2,*, N. Hamdi2, M. A. Goncalves3, E. Srasra2
1 Département de Chimie, Ecole Supérieure des Sciences et Techniques de Tunis. Rue Taha Hussein- Montfleury Tunis, Tunisia
2 Unité matériaux, Technopole Borj Cedria, BP 95-2050 Hammam lif, Tunisia
3 Departamento de Geologia and Creminer Faculdade de Ciências da Universidade de Lisboa Edifício, Piso, Campo Grande 1749-016 Lisboa Portugal
*E-mail: kriaa1993@yahoo.fr
Received: 12 January 2009 / Accepted: 13 March 2009 / Published: 22 March 2009
Potentiometric titration behaviour of a Tunisian glauconite complex natural clay mineral was investigated and interpreted according to surface complexation theory. Gran plots were used to determine the equivalence points of potentiometric titrations in solution and also the necessary parameters for the analysis of titration data. Proton surface charge can be calculated by subtracting supernatant titration curves from those of glauconite suspension. The surface complexation model (SCM) that fits satisfactorily our experimental data, is the double layer model (DLM) which was successfully capable to simulate the experimentally observed acid-base titration properties of glauconite suspension. The optimisation procedure, using FITEQL program, was performed in two steps: first, the Fe and Si speciation was optimised with alkalimetric titration of supernatant solution, then; the optimised parameters were used in the alkalimetric titration of the glauconite suspension. Surface ionisation constants were then determined by FITEQL, the pKas values found are (pKa1 =3.41, pKa2 = 4.34).
Keywords: Glauconite, Surface complexation model (SCM), potentiometric titration, surface ionisation constants, FITEQL program.
1. INTRODUCTION
constant capacitance model (CCM) and the triple layer model (TLM) were applied to model the experimental results of oxide surfaces. These three models are similar in their descriptions of surface reactions, each treating the surface as if it were composed of amphoteric hydroxide functional groups which are capable of reacting with sorbing cationic or anionic species to form surface complexes. The models differ in complexity and descriptions of the electrical diffuse layer and the manners in which changes in the background electrolyte concentration are incorporated in model computations. Some authors have given a schematic representation of the electrical properties of the interfacial region [1] where the three SCMs in terms of adjustable parameters, including surface chemical reactions and the charge–potential relationships, are well established.
In the other side, because of their complex chemical composition, application of SCMs to complex natural clay minerals as well to purified phyllosilicate clay minerals is less common. We can cite some studies on kaolinite [6,7], on montmorillonite [8,9], on bentonites [10], on natural illite and glauconite [11-14]. In addition, the surface acid-base chemistry of illite was investigated at different zero point of titration (ZPT) values [11, 12, 15]. When the ZPT was situated at a weak alkaline pH, two equilibrium constants were obtained by employing the CCM, which included both protonation and deprotonation steps, i.e., pKa1=7.5 and pKa2= 11.7, respectively. Du et al, 1997[11] demonstrated the surface acid-base reactions of one aqueous illite using the CCM with only a deprotonation step, the proposed reaction constant of pKa = 4.23 being achieved at acidic ZPT. Liu et al, 1999[13], argued that during prolonged acid-base potentiometric titrations in acidic medium, a significant amount of Al is released into solution. Many studies, reported by these authors indicated that the presence of silicic acid can strongly influence the distribution of aluminium species in acidic environments, ranging from low-order soluble Al-species, i.e., monomeric forms, to polymeric hydroxyl-aluminosilicates (HAS) and colloidal precipitates. In addition, soluble Al-Si species are intermediates in the weathering reactions of primary and secondary aluminosilicates in soils, geological formations and surface waters, and they may affect the dissolution of solid aluminium silicates and serve as templates, or structural subunits, for secondary clay minerals.
The major purposes of the study are (i) to develop the understanding of the surface acid-base of Tunisian glauconite by comparison of the behaviour of different materials during potentiometric titration, (ii) to use FITEQL program for testing the applicability of some SCM models for the characterization of the reaction mechanisms, while taking into account possible interactions between iron species and silicic acid. These aspects have not been widely studied in the literature and to our knowledge there are few studies concerning glauconite clay minerals.
2. EXPERIMENTAL PART
2.1. X-ray diffraction (XRD)
X-ray diffractograms were recorded using a “PANalytical X’Pert High Score plus” diffractometer in the 2θ range of 3 to 40° at a scanning rate of 2°/min and employing Cu-Kα filtered radiation. The diffractograms of oriented plate are obtained by sedimentation on slides. This permits to follow the periodicity of the stratification of the layers, with the reflection (d001) for which the identification is based.
2.2. Cation exchange capacities (CEC) and specific surface areas (SSA)
CEC was determined by the method of copper ethylenediamine (EDA)2CuCl2 complex [17] and specific surface area was determined by nitrogen gas adsorption at 77K after outgassing at 120°C under helium gas, using a “Quantachrome-Autosorb 1” sorptiometer. The cationic exchange capacities (CEC) and the specific surface areas (SSA) for the purified sample are 28 meq/100g and 60 m2/g, respectivel
2.3. Chemical analysis
The glauconite sample was attacked by a mixture of three acids (HCl, H2SO4, HNO3 and HF). The elements, such as Si, Al, Fe, Mg, Ca, Na and K are assayed by Atomic Absorption Spectrophotometer (AAS).
2.4. Sample characterisation
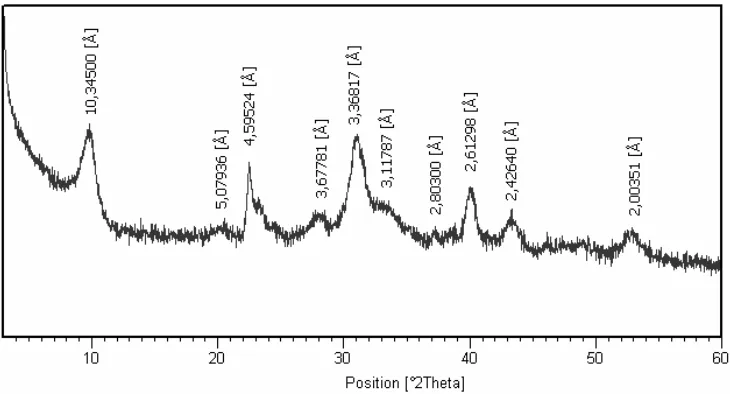
The X-Ray powder pattern of the sample is shown in the figure 1. Based on J.C.P.D.S. (International Center for Diffraction Data, PDF reference 02-0049) using X’Pert HighScore Plus software, we can conclude that our sample is a pure glauconite clay mineral.
The specimens after different treatments were studied by using X-ray diffraction technique. In these methods, oriented specimen is prepared on glass microscope slides. The samples were successively subjected to different treatments not only to characterize the clay specimens but to identify the presence of eventually interstratified or mixed other clay minerals:
i) Normal at ambient temperature (N)
ii) Saturated with ethylene glycol (EG-treatment) (G) iii) Heating at 550°C (H)
The diffractograms of the sample are shown in the figure 2.
were included in the figure 2 in order to detect minimal changes. After EG-treatment (G) the glauconite basal reflections do not show significant changes.
[image:4.612.125.490.184.381.2]The chemical analysis of the purified sample is summarized in table 1. It follows from this analysis that the sample contains a higher content of Fe2O3 and a low ratio of Al2O3. This result is in agreement with X-Ray diffraction analyses which prove that our sample is a glauconitic clay mineral.
Figure 1. X-Ray powder patterns of sample.
[image:4.612.132.481.454.675.2]
Table 1. Average chemical composition of the sample
Figure 3. Gran plot of glauconite suspension in 0.1M NaCl solutions; a: blank system, b: aqueous suspension.
2.5. Potentiometric titration curves using Gran plot method
The experimental method used is related to the one by Du et al, 1997a [11], in illite suspensions from the Hebei Province China. For the acid-base continuous titrations, glauconite suspensions were
firstly acidified with HCl 0.01 M to pH approximately 2 and then back- titrated immediately with hydroxide solution (0.05M) to an alkaline pH range. For each titration, 0.1 g of glauconite stock suspension was added to 15 ml of water in a flask and stirred for 24 hours in order to approach equilibrium. NaCl solution was used to stabilize the system at a given ionic strength.
Distilled water was added to bring the total initial volume of the suspension to 50 ml and the temperature was held constant at 25± 0.5°C.The suspension was then titrated with 0.05M NaOH with 0.2 mL increments until a pH of approximately 11 is reached. The equilibrium criterion for each addition of the titrant was the stability of pH value measured to within 0.01pH units/min.
Concerning the blank system of the sample, we have used the supernatant of the corresponding sample system as the titration blank.
The blank solution was obtained from the supernatant of the equivalent glauconite suspension after being titrated to the acid pH range. Therefore, the suspension is centrifuged at 6000 rpm during 30 min to allow for a correct separation of colloidal particles. The supernatant thus obtained was titrated to the same procedure described above. The controlling conditions during the titration were also the same as that for the glauconite suspension titration.
The NaCl electrolyte concentration was adjusted to a 0.1, 0.01 and 0.001 mol/l. Before each alkaline back- titration, the aqueous suspensions and the corresponding blank solutions were equilibrated for about 10 min in order to reach an equilibrium pH value.
2.6. Data treatment
For the titration of solid/water systems and their corresponding supernatant, we have chosen the Gran titration method, as used by some researchers [11, 18, 19, 20], to determine accurately the equivalence points of potentiometric titrations in aqueous solutions (Ve1, Ve2) and the net number of protons reacted per surface site (Znet). From experimental data, Gran plot was applied for the hydroxide titration. The Ve1 and Ve2 values determined by linear regression in the corresponding Gran plot are shown in the figure 3.
2.7. Parameters of Gran method
For each titration point, the concentration of the total protons added to the system was calculated by:
TOT H = - (Vb - Ve1).Cb / ( V0 + Vb) , mol/L (1)
where:
Vb is the volume of NaOH added in the hydroxide titration
The determination of the total surface site concentration (Hs) was calculated from the two equivalence points in the Gran plot of the hydroxide titration (see figure 1, Ve1 and Ve2) after subtracting the hydroxide consumed by the blank solution, as shown in the equation below:
Hs = [(Ve2 - Ve1). Cb]sample - [ (Ve2 -Ve1) . Cb]blank / V0, mol/l (2)
The calculation of average number of protons reacted per surface site (Z) was determined at each titration point by:
Z = [TOT H - 10 -pH + 10-(pKw -pH)]. (V0 +Vb) / (Hs. V0 ) (3)
TOT H and Hs were calculated by equations (1) and (2) respectively. For each glauconite system, the net number of surface reacted protons per surface site, Znet (pH,I) was obtained from the difference between the Z values of the sample titration and the corresponding blank titration at the same pH:
Znet (pH, I) = Zsample (4)
3. RESULTS AND DISCUSSION
3.1. Surface characterization
It is well known that the surface of a solid immersed in an aqueous solution develops an electrical charge, depending on the pH of the suspension. The origin of this charge can be attributed to the amphoteric dissociation of SOH surface groups created by hydration of the solid surface after immersion. The pH dependence of the surface charge can be modeled by the constants K+ and K -referring, respectively, to the protonation and deprotonation equilibria:
≡SOH2+ < => ≡ SOH + H+ (a)
which has an apparent equilibrium constant, given by
Ka1 app = (≡ SOH) [H+] / [≡SOH2+] and also
≡ SOH <=> ≡ SO- + H+ (b)
with the corresponding apparent equilibrium constant
In the previous equations, ≡SX represents a reactive surface site, (X) denotes the concentration of a given species (mol/L), and [H+] is the activity of the hydrogen ion in solution. Given that the activity of ions is different near the surface and in the bulk solution, a Coulombic term must be taken into account, and the intrinsic equilibrium constants for the previous reactions are calculated from the average surface potential ψ0 applicable to the reactive groups, thus
Kanitr = Kanapp e –Fψ0 /RT , for n=1,2
The term e−Fψ0 /RT is the Boltzman factor, where R is the perfect gas constant, T is the temperature, and F is the Faraday constant. The Coulombic potential is pH dependent and must be calculated explicitly in each equilibrium calculation on the basis of the double layer theory or its extension [21]. At the pH of the point of zero charge, pHpzc, the net surface potential and net surface charge are both zero (ψ0 = 0, and σ0 = 0), and then (≡SO−) = (≡SOH2+).
The inclusion of the surface potential as a Boltzman factor in the adsorption / desorption equilibria provides the intrinsic (thermodynamic) equilibrium constants. The electrostatic terms accounts for the rational activity coefficients of the sorbed species (Sposito, 1984)[22]. The EDL models such as CCM or TLM may provide an atomistic description of the adsorption phenomena, but result in an increase of the mathematical complexity.
3.2. Surface acidity constants
In order to determine the best-fit equilibrium constants for the H+ surface adsorption, the Tunisian glauconite surface acidity constants were determined by modeling the potentiometric titration data using the simulation code FITEQL4.0. This software uses a nonlinear least-squares optimization technique to fit equilibrium constants to experimental potentiometric titration data [23]. For each convergent optimization, FITEQL 4.0 provides the quality of fit criterion for a set of surface constants. This criterion, Vy, which is the weighted sum of squares of residues (SOS) divided by the degrees of freedom (DF), may be calculated using the equation:
Vy = SOS /DF =
Nu NpNc
Sj Yj
−
∑
( / )2
experimental data and the model. In practice a value of 0.1–20 for this parameter, generally indicates a “satisfactory” fit of the data, when realistic error estimates are used.
Among the surface complexation models generally used to account for the surface acid–base properties of solids in aqueous suspension, the Stern model, the DLM (diffuse layer model), and the TLM (triple layer model) are commonly used. The Stern model is commonly used to describe the charging behavior of weakly acidic surfaces. The DLM is the simplest one and is usually limited to low ionic strengths conditions (≤ 0.1 M) while the CCM for example is restricted to high (and constant) ionic strengths (above 0.1 M). Finally, the TLM may be expected to model titration data successfully over a wide range of ionic strengths. If we consider the number of adjustable parameters for a simple oxide, three are needed in the DLM, four in the CCM and seven in the more complete TLM. In this study, the use of the DLM was suitable since the experiments were carried out at relative low ionic strength (I=0.1 M). Surface acidity constants refer to protonation and deprotonation of the ≡SOH surface groups as written in Eqs. (a) and (b).
3.3. Modeling potentiometric titration behaviour of glauconite
To model the glauconite acid-base surface properties, the relevant acid-base reactions in aqueous solution must be taken into account. As mentioned in the introduction, several studies cited by Liu et al., 1999 [13], indicate that the presence of silicic acid can strongly influence the distribution of aluminium species in acidic environments, which would range from low-order soluble Al-Si species (monomeric forms) to polymeric hydroxy-aluminosilicates (HAS) and colloidal precipitates. These same authors also state that the polymeric hydroxy-aluminosilicates ions can readily form in significant amounts at ambient temperature over the pH range of 4 to 7, when a mixture of Al and Si solutions is titrated with a strong base. On the other hand, Goncalves, 2004 [24] found that these species (HAS) are negligible in the pH range 3-10. In addition to these surface complexes, we can assume in a similarly manner, for our glauconite sample, a significant formation of monomeric Fe-Si species instead of Al-Si species and polymeric ferricosilicates instead of hydroxy-aluminosilicates ions that can form in significant amounts over the same pH range too. The equilibrium constants and reactions values for Fe3+ and Si(OH)
4 in aqueous solution are derived from Parkhurst and Appelo, 1999 [25].
The Gran plots of the alkalimetric titrations shown inFigure 1 allowed the determination of the zero point of titration (Ve1) [11,12], and both the glauconite suspension and blank (supernatant) titrations were used toestimate the number of protonated surface sites, HS, with equation 2,which is 7 ×10⁻⁵ mol/g. The total number of added protons determinedwith equation 3 and the pH readings of the titrations were used asinput for the optimisation procedure with FITEQL 4.0.
Table 2. Reaction constants for Fe3+ and Si (OH)4 in aqueous solution for 25ºC and 0.1M ionic strength, used in the solution model for FITEQL optimisation [Parkhurst and Appelo, 1999] . Two reactions for the formation of hydroxy-ferricosilicate complex and surface Fe-Si complex were considered for the glauconite suspension titration.
Reaction constants as parameters for FITEQL Fe3+ + H2O <=> FeOH2+ + H+ logK = -2.19 Fe3+ + 2H2O <=> Fe(OH2)+ +2H+ logK =-5.67 Fe3+ + 3H2O <=>Fe(OH)3 + 3H+ logK =-13.60 Fe3+ + 4H2O <=> Fe(OH)4- +4H+ logK= -21.60
≡SOH + Fe3+ + H4SiO4 <=> ≡SOFe(OSi(OH)3)+ + 2H+ log Kan optimised by FITEQL Fe3+ + H4SiO4 + 2H2O <=> Fe(OH)2(OSi(OH)3) + 3 H+ log Kan optimised by FITEQL Si (OH)4 <=> SiO(OH)3- + H+ logK =-9.46
SiO(OH)3- <=> SiO(OH)22- +H+ logK=-22.02
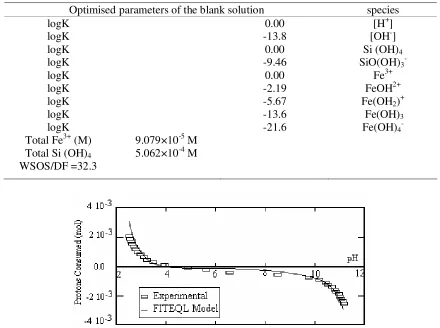
Table 3. Parameters optimised by FITEQL to adjust the chemical equilibrium model to the experimental data of the alkalimetric titration of the blank solution; WSOS/DF corresponds to the goodness of fit.
Optimised parameters of the blank solution species logK logK logK logK logK logK logK logK logK Total Fe3+ (M) Total Si (OH)4 WSOS/DF =32.3
9.079×10⁻⁵ M 5.062×10⁻⁴ M
0.00 -13.8 0.00 -9.46 0.00 -2.19 -5.67 -13.6 -21.6
[H+] [OH-] Si (OH)4 SiO(OH)3- Fe3+ FeOH2+ Fe(OH2)+ Fe(OH)3 Fe(OH)4
[image:10.612.86.527.132.259.2] [image:10.612.85.525.350.678.2]
Since our experiments were run at 25±2ºC, and the equilibrium constants are for 25ºC and 0.1M ionic strength, FITEQL was set to optimise these constants for these conditions, provided that the optimised parameters were not too far off the initial values. Convergence was achieved and the goodness of fit (as defined in the FITEQL Report), WSOS/DF was 32.3. In general, given that values below 20 are considered as good fits [23], the fit to the experimental values is acceptable. A synthesis of the optimisation procedure and of the model parameters obtained is given in Table 3 and figure 4. The parameters obtained from the optimisation procedure were fed into the glauconite suspension model.
Table 4. Parameters optimised by FITEQL to adjust the chemical equilibrium model to the experimental data of the alkalimetric titration of the glauconite suspension, 0.1 M NaCl; WSOS/DF corresponds to the goodness of fit.
Characteristic Parameters of the glauconite suspension (FITEQL optimisation)
Optimised parameters species
logK logK logK logK logK logK logK logK logK Total Fe3+ (M) Total Si (OH)4 Total (≡ SOH) WSOS/DF =35
6 ×10⁻⁵ M 5 ×10⁻⁴M 8.92×10⁻⁴mol/g
0.00 -13.00 0.00 -9.46 0.00 -2.19 -5.67 -13.6 -21.6
[H+] [OH-] Si (OH)4 SiO(OH)3-
Fe3+ FeOH2+ Fe(OH2)+ Fe(OH)3 Fe(OH)4
[image:11.612.86.523.283.473.2] [image:11.612.157.454.523.656.2]
The optimisation procedure did not consider the ion-exchange reaction at the permanently negative surface charged sites mostly because at the relative high ionic strengths used in our experiments; these sitesare almost permanently blocked by the electrolyte ions and thus have nomajor role in surface speciation equilibrium. Besides glauconite sample has a low CEC. The electrical double layer, as described - above, was the model that fits most satisfactorily the experimental data. The results of the optimisation procedure are presented in Table 4 and figure 5.
It should be pointed out that all surface reactions involving Si and Fe complex species are considered and therefore the Stern model, the DLM (diffuse layer model), and the TLM (triple layer model), for which FITEQL 4.0 works currently for adsorption at interface clay minerals, were adopted. Among these surface complexation models, it reveals that only DLM model fits satisfactorily our experimental data, and was successfully capable to simulate the experimentally observed acid-base titration properties of glauconite suspension. On the other hand, the model fits for the 0.01 and 0.001 M ionic strengths cases are not as good as indicated by the higher SOS/DF values (> 300), with the largest discrepancies between titration data and the model simulation occurring in the vicinity of the pHPZC. This behaviour should take into account likely the released species from glauconite dissolution, in agreement with works [14], where a high SOS /DF value (126.1-126.3), at 0.001 ionic strength, was obtained for modeling titration behaviour of glauconite in aqueous suspension.
As for the optimised equilibrium constants, the values found (pKa1 =3.41 and pKa2 = 4.34) fall close to the ones determined by Liu et al. (1999) [13] and Goncalves, 2004 [24] where their estimation of the surface deprotonation equilibrium constant lies between 3.73 and 4.08 pKa units, but are different to that listed by Lu and Smith, 1996 [14] (logK3 = 7.81)-8.11) for the NEM and logK3 = (-7.63)-(-7.27) for the CCM). However, the value of the equilibrium constant for the protonation reaction differs considerably from the one determined by Lackovic et al. (2004) [26] (log Ka = −9.37) and Lu and Smith [14] (logK2 =4.56-4.67 for the NEM and 4.77-5.12 for the CCM). We think that the major reason for differences in the observed surface ionization constants is mainly due to different surface complexation models implemented in the literature from experimental data, leading to large pKa values. On the other hand, in our determination of surface ionization constants by using FITEQL 4.0 program, we have take into account only the influence of Fe and Si complex species present in the matrix or in the reacting phase which frequently take part in various surface reactions in aqueous systems. In other terms, the contribution of Al, Mg etc (constituents that may shift the constant ionization of complex clay minerals to the alkaline pH range) was discarded [27]. We must emphasize that the interaction of iron species with Si species, leading to monomeric and polymeric complexes, was also neglected. All these reactions have an indirect effect on the surface constants ionization values.
[image:13.612.180.430.160.358.2]
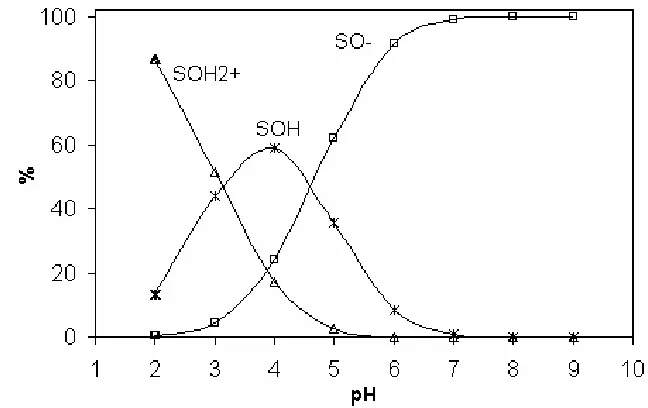
silicates and clay minerals, with special emphasis on kaolinite (one of the most widely studied materials), as can be seen in [7, 28-31]. Surface speciation of the glauconitesample is shown in Figure 7, according to the chemical equilibriumconsidered in this study. Up to pH= 4, more than half of the sites are neutralwith only about 40% of the sites in the ≡SO- form. The latter increases up topH=7, where almost all the surface sites are negatively charged.
Figure 6. Surface charge (in Coulombs per square metre) of the glauconite sample as a function of pH, calculated by FITEQL with the diffuse double layer model.
Figure 7. Surface speciation of the glauconite sample as a function of pH, as calculated with PHREEQC program (Parkhurst and Appelo, 1999) with the optimised stability constants.
[image:13.612.144.468.422.626.2]
pKas values optimised by FITEQL, using the electrical double layer model (EDL), are very close to those exposed in the literature concerning glauconite clay mineral. This can be explained by the low variation of surface charge density (~ 10-5 mol /m2) vs. pH observed in all clay minerals. Moreover, The FITEQL program uses as input equilibrium reaction constants of Fe and Si where these species are independent between them. This seems to be unrealistic in the case of clay minerals where these elements inter-react together and are differently solvated at the mineral interface aqueous suspension.
0.00E+00 5.00E-05 1.00E-04 1.50E-04 2.00E-04 2.50E-04 3.00E-04
2 4 6 8 10 12
pH
m
o
l/
L
Fe Si Ca
K Mg Al
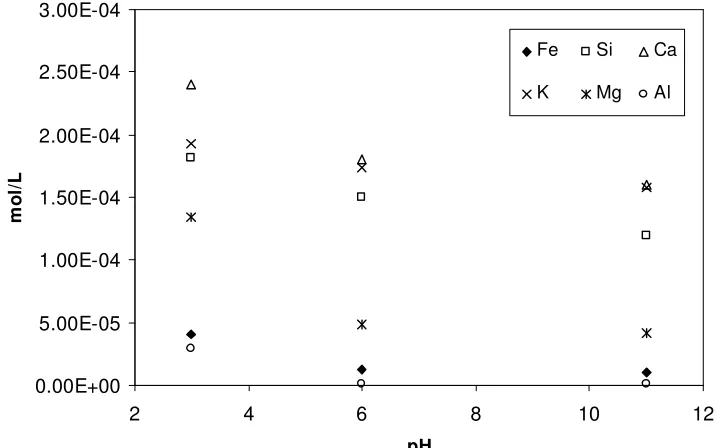
Figure 8. Total concentration of released cations from glauconite during dissolution experiment process at 25°C.
[image:14.612.113.473.180.404.2]
4. CONCLUSIONS
In this study, we investigated the surface acid-base characteristics of Tunisian glauconite by potentiometric titration. On the basis of experimental data and corresponding analyses, we draw the following conclusions:
1) Protons reactions in the supernatant of glauconite suspension can be successfully described by those of Fe3+ and Si(OH)
4 in aqueous solution. Modelling potentiometric behaviour of Tunisian glauconite was achieved and convergence was attained with WSOS/DF =35.
2) Within the scope of the electrical double layer model and considering the surface complexation and precipitation, the model can provide satisfactory descriptions of the experimental data recorded for the glauconite.
3) Comparatively to others published studies of illite, some resemblances are found in the surface acid-base properties of glauconite due to similarities between the corresponding the surface constants ionization: The pkas values found are pKa1 =3.41, pKa2 = 4.34 and the pHPZC =3.9.
References
1. K.F. Hayes, G. Redden., W. Ela and J.O Leckie, J.Colloid Interface Sci. 142 (1991) 2. 2. J. Davis and O. J. Leckie, Colloid and Interface Sci. (1978) 67.
3. D. Sverjensky, Geochim.Cosmochim.Acta 69 (2005) 225.
4. S. Mustapha, B. Dilara , K. Nargis, A. Naeem., P. Shahida, Colloids and Surfaces A: Physicochemical and Engineering Aspects. 205 (2002) 273.
5. R. Sprycha, J.Colloid Interface Sci. 127 (1989) 1.
6. P.W. Schindler , P. Licchti , and J.C.Westall, J. Agric. Sci. 35 (1987) 219.
7. F.J. Huertas , L. Chou , and R. Wollast , Geochimica et Cosmochimica Acta 62 (1998) 417. 8. M. Stadler and P.W.Schindler , Clays Clay Miner. 41 (1993) 288.
9. M. Stadler and P.W. Schindler, Clays Clay Miner. 42 (1994) 148.
10. N.M. Nagy , J. Konya, Journal of Colloid and Interface Science 295 (2006) 173.
11. D. Qing, S. Zhongxi, F. Willis, and T. Hongxiao, Journal of Colloid and Interface Science., 187 (1997a) 221.
12. D. Qing., S. Zhongxi, W. Forsling and H. Tang., Journal of Colloid and Interface Science, 187 (1997b) 232.
13. W. Liu , Z. Sun , W. Forsling , Q. Du and H. Tang , Journal of Colloid and Interface Science, 219 (1999) 48.
14. W. Lu and E.H. Smith , Geochim. Cosmochim. Acta. 60 (1996) 3363. 15. MM. Motta , CF. Miranda, Soil Sci Soc Am J., 53 (1989) 380.
16. Van Olphen, an Introduction to clay Colloid Chemistry, interscience publishers, New York (1963). 17. F. Bergaya, M.Vayer, Applied Clay Science. 12 (1997) 275.
18. C. Ludwig , and P.W. Schindler, J. Colloid Interface Sci. 169 (1995) 284. 19. J. Chorover, and G. Sposito, Geochim. Cosmochim. Acta 59 (1995) 875.
20. L. Citeau, Etude des colloïdes naturels présents dans les eaux gravitaires de sol contamines: relation entre nature des colloïdes et réactivâtes vis à vis des métaux (Zn, Cd, Pb, Cu). Thesis, Institut National d'Agronomie Paris-Grignon (2004).
21. A. M. L. Kraepiel, K. Keller, and F.M.M. Morel, Environmental Science & Technology 32 (1998) 2829.
23. A.L. Herbelin and J.C. Westall, FITEQL: A Computer Program for Determination of Chemical Equilibrium Constants from Experimental Data. Department of Chemistry, Oregon State University (1999).
24. Mário Abel Carreira Gonçalves “Heavy Metal Dispersion by Landfill Contaminated Waters and Fixation Mechanisms on Phyllosilicates: a Combined Field and Experimental Study” Departamento de Geologia Faculdade de Ciências da Universidade de Lisboa Edifício C2, Piso 5 Campo Grande 1749-016 Lisboa Portugal (2004).
25. D.L. Parkhurst, C.A.J. Appelo, Usetr’s guide to PHREEQC (version 2) –a computer program for speciation, batch-reaction, one dimensional transport, and inverse geochemical calculations. U.S. geological Survey Water Investigations Report 99-4259, (1999).
26. K. Lackovic, J.D. Wells, B.B. Johnson, and M.J. Angove, Journal of Colloid and Interface Science 270, (2004) 86.
27. E. Tombacz and M. Szekeres , Applied Clay Science, 27 (2004) 75.
28. P.V. Brady , R.T. Cygan , and K.L. Nagy , Surface charge and metal sorption to kaolinite. In Adsorption of Metals by Geomedia: Variables, Mechanisms; and Model Applications (ed. E. A. Jenne), (1998).
29. S.A. Carrol-Webb, and J.V. Walther, Geochimica et Cosmochimica Acta 52 (1988) 2609.
30. J.A. Davis and D.B. Kent, Surface complexation modeling in aqueous geochemistry. In Mineral-Water Interface Geochemistry, (ed. M. F. Hochella Jr. and A. F.White), Mineralogical Society of America 23, (1990) 177.
31. G. Sposito, Environmental Science & Technology 32 (1998) 2815.