ISSN 0252-8266
O)
Oí
en
D
h«
Eurostatistik
Daten zur Konjunkturanalyse
M o n a t l i c h
Eurostatistics
Data for short-term economic analysis
M o n t h l y
Eurostatistiques
Données pour l'analyse de ia conjoncture
eurostat
OFICINA ESTADÍSTICA DE LAS COMUNIDADES EUROPEAS
DE EUROPÆISKE FÆLLESSKABERS STATISTISKE KONTOR
STATISTISCHES AMT DER EUROPÄISCHEN GEMEINSCHAFTEN
ΣΤΑΤΙΣΤΙΚΗ ΥΠΗΡΕΣΙΑ ΤΩΝ
ΕΥΡΩΠΑΪΚΩΝ ΚΟΙΝΟΤΗΤΩΝ
STATISTICAL OFFICE OF THE EUROPEAN COMMUNITIES
OFFICE STATISTIQUE DES
COMMUNAUTÉS EUROPÉENNES
ISTITUTO STATISTICO DELLE COMUNITÀ EUROPEE
BUREAU VOOR DE STATISTIEK DER EUROPESE GEMEENSCHAPPEN
SERVIÇO DE ESTATÍSTICA DAS COMUNIDADES EUROPEIAS
EUROOPAN YHTEISÖJEN TILASTOTOIMISTO
EUROPEISKA GEMENSKAPERNAS STATISTIKKONTOR
L2920 Luxembourg —Tél. (352) 43 011 —Télex COMEUR LU 3423
B1049 Bruxelles, rue de la Loi 200 — Tél. (322) 299 11 11
Las publicaciones de Eurostat están clasificadas por temas y por series. La clasificación se encuentra al final de
la obra. Para mayor información sobre las publicaciones, rogamos se pongan en contacto con Eurostat.
Para los pedidos, diríjanse a las oficinas de venta cuyas direcciones figuran en la página interior de la
contracubierta.
Eurostats publikationer er klassificeret efter emne og serie. En oversigt herover findes bag i hæftet. Yderligere
oplysninger om publikationerne kan fås ved henvendelse til Eurostat.
Bestilling kan afgives til de salgssteder, der er anført på omslagets side 3.
Die Veröffentlichungen von Eurostat sind nach Themenkreisen und Reihen gegliedert. Die Gliederung ist hinten in
jedem Band aufgeführt. Genauere Auskünfte über die Veröffentlichungen erteilt Eurostat.
Ihre Bestellungen richten Sie bitte an die Verkaufsbüros, deren Anschriften jeweils auf der dritten Umschlagseite
der Veröffentlichungen zu finden sind.
Οι
εκδόσεις της Eurostat ταξινομούνται κατά θέμα και κατά σειρά. Η ακριβής ταξινόμηση αναφέρεται στο
τέλος κάθε έκδοσης. Για λεπτομερέστερες πληροφορίες σχετικά με τις εκδόσεις, μπορείτε να
απευθύ-νεσθε στην Eurostat.
Για τις παραγγελίες μπορείτε να απευθύνεσθε στα γραφεία πώλησης, των οποίων οι διευθύνσεις
αναγράφονται στη σελίδα 3 του εξωφύλλου.
Eurostat's publications are classified according to themes and series. This classification is indicated at the end of
the publication. For more detailed information on publications, contact Eurostat.
Orders are obtainable from the sales offices mentioned on the inside back cover.
Les publications d'Eurostat sont
classées par thème et par série. Cette classification est précisée à la fin
de l'ouvrage. Pour des informations plus détaillées sur les publications, contactez Eurostat.
Pour les commandes, adressez-vous aux bureaux de vente dont les adresses sont indiquées à la page 3
de la couverture.
Le pubblicazioni dell'Eurostat sono classificate per tema e per serie. Tale classificazione e precisata alla fine
dell'opera. Per informazioni più dettagliate sulle pubblicazioni rivolgersi all'Eurostat.
Per eventuali ordinazioni rivolgersi a uno degli uffici di vendita i cui indirizzi figurano nella 3* pagina della
copertina.
De publicaties van Eurostat zijn ingedeeld naar onderwerp en serie. Deze indeling is achter in het boek
opgenomen. Voor nadere informatie over de publicaties kunt u zich wenden tot Eurostat.
Gelieve bestellingen op te geven bij de verkoopbureaus, waarvan de adressen op bladzijde 3 van de omslag zijn
vermeld.
As publicações do Eurostat estão classificadas por tema e por série. Esta classificação está indicada no firn da
obra. Para mais informações sobre as publicações é favor contactar Eurostat.
Encomendas: serviços de venda cujos endereços estão indicados na contracapa.
Eurostatin julkaisut on luokiteltu aiheen ja sarjan mukaisesti. Luokittelu ilmoitetaan kunkin julkaisun lopussa.
Lisätietoja julkaisuista saa Eurostatista.
σι
σι
σι
Eurostatistik
Daten zur Konjunkturanalyse
M o n a t l i c h
Eurostatistics
Data for short-term economic analysis
M o n t h l y
Eurostatistiques
Données pour l'analyse de ia conjoncture
Zahlreiche weitere Informationen zur Europäischen Union sind verfügbar über Internet,
server Europa (http://europa.eu.int).
A great deal of additional information on the European Union is available on the Internet.
It can be accessed through the Europa server (http://europa.eu.int).
De nombreuses autres informations sur l'Union européenne sont disponibles sur Internet
via le serveur Europa (http://europa.eu.int).
Luxembourg: Office des publications officielles des Communautés européennes, 1999
© Europäische Gemeinschaften, 1999
© European Communities, 1999
© Communautés européennes, 1999
SEITE - PAGE - PAGE
VORWORT
FOREWORD
AVANT-PROPOS
ZEICHEN UND ABKÜRZUNGEN
SYMBOLS AND ABBREVIATIONS
SIGNES ET ABRÉVIATIONS
SCHAUBILDER : siehe ausführliche Aufstellung Seite
1
GRAPHICS : see detailed list on page 1
GRAPHIQUES : voir liste détaillée page I
TABELLEN : siehe ausführliche Aufstellung Seite III
TABLES : see detailed list on page III
TABLEAUX : voir liste détaillée page III
Volkswirtschaftliche Gesamtrechnungen
National accounts
Comptes nationaux
Beschäftigung
Employment
Emploi
Arbeitslosigkeit
Unemployment
Chômage
Industrie
Industry
Industrie
Energie
Energy
Energie
Dienstleistungen
Services
Services
Landwirtschaftliche Erzeugnisse
Agricultural products
Produits agricoles
Außenhandel
External trade
Commerce extérieur
Verbraucherpreise
Consumer prices
Prix à la consommation
Agrarpreisindizes
Indices of agricultural prices
Indices des prix agricoles
Finanzstatistiken
Financial statistics
Statistiques financières
Zahlungsbilanz
Balance of payments
Balance des paiements
5
6
7
27
29
43
55
61
85
91
99
105
133
143
149
VORWORT
FOREWORD
AVANT-PROPOS
Mit der monatlich erscheinenden
Veröffentlichung
Eurostatistik
-Daten zur Konjunkturanalyse
werden innerhalb kürzester Frist
die neuesten statistischen Daten
über die Europäische Union als
Ganzes, über jedes
Mitgliedsland sowie über die
Vereinigten Staaten und Japan
bekanntgegeben.
Eurostatistik - Daten zur
Konjukturanalyse
enthält die
wichtigsten, bei Eurostat
verfügbaren Statistiken zur
konjunkturellen Entwicklung.
Die Publikation wurde im
Umfang bewußt klein gehalten
und enthält keine Anmerkungen
zur Methodik, die im übrigen in
den spezialisierten
Veröffentlichungen von Eurostat
zu finden sind.
Eurostatistk - Daten zur
Konjunkturanalyse
enthält keine
Kommentare. Dafür werden die
wichtigsten Indikatoren in der
monatlichen
Veröffentlichung
Schlüsselzahlen - Bulletin zur
europäischen Konjunktur und
Synthesen
kommentiert.
Die in allen Publikationen
veröffentlichten Daten stammen
aus der Datenbank New
Cronos. New Cronos setzt sich
zusammen aus dem alten
Cronos sowie REGIO und ist
nicht mehr in Form von
Zeitreihen, sondern in Form von
multidimensionalen Tabellen
dargestellt. New Cronos ist
somit eines der Produkte zur
Verbreitung statistischer Daten,
das direkt aus der Eurostat
-Referenzdatenbank gespeist
wird.
Eurostatistics - data for
short-term economic analysis
is a monthly publication aimed
at providing, as rapidly as
possible, the latest statistical
data on the European Union
as a whole, each Member
State, the United States and
Japan.
Eurostatistics - data for short
term economic analysis
presents the most relevant
statistics on the economic
situation held by Eurostat.
The publication is deliberately
streamlined and does not
contain any methodological
notes, which are given in
Eurostat's specialized
publications.
Eurostatistics - Data for
short-term economic analysis
does not include comments.
For this,
Key Figures - bulletin
of economic trends and
summaries
will comment on
the most important indicators.
The data presented in all
publications are taken from
Eurostat's on-line database,
New Cronos. New Cronos
includes old Cronos and
Regio, both represented not
by chronological series but
through multi-dimensional
tables. New Cronos is a
dissemination product directly
from Eurostat's Reference
Environment.
Eurostatistiques - Données
pour l'analyse de la
conjoncture
est une publication
mensuelle qui a pour but de
fournir dans les meilleurs
délais les données statistiques
les plus récentes pour l'Union
européenne en tant
qu'ensemble, pour les pays
membres ainsi que pour leurs
principaux partenaires
extra-communautaires
(États-Unis d'Amérique et
Japon).
Eurostatistiques - Données
pour l'analyse de la
conjoncture
reprend les
statistiques les plus
importantes sur la situation
économique disponibles
auprès d'Eurostat.
Cette publication ne comporte
pas de notes méthodologiques.
Elles sont disponibles dans les
publications spécialisées
d'Eurostat.
Eurostatistiques - Données
pour l'analyse de la
conjoncture
ne comprend pas
de commentaires. Par contre,
les indicateurs les plus
importants sont commentés
dans le mensuel
Chiffres Clés
- Bulletin de la conjoncture
européenne et synthèses.
Les données présentées dans
les publications proviennent de
la base de données New
Cronos. New Cronos se
compose de l'ancien Cronos et
de Regio, représentés non plus
sous forme de séries
Z E I C H E N U N D S Y M B O L S A N D S I G N E S ET
A B K Ü R Z U N G E N A B B R E V I A T I O N S A B R É V I A T I O N S
o
%
T/T-l %
Ί7Τ-12 %
1990=100
1000
MIO
MRD-BN-MRD
t
TJ (GCV)
GWH
USD
ECU
SZR -SDR-DTS
SITC-SITC-CTCI
EU-15
EUR-11
B/L
AKP-ACP-ACP
Weniger als die Hälfte der
verwendeten Einheit
Prozent
Prozentualer Zuwachs
eines Vierteljahres
gegenüber dem
vorhergehenden
Vergleichszeitraum
(Monat,Vierteljahr, Jahr)
Prozentualer Zuwachs
eines Monats gegenüber
dem entsprechenden
Monat des Vorjahres
Basisjahr
in 1000
Million
Milliarde
Metrische Tonne
Terajoule = 10
9kJ
Gigawattstunde = 10
6kWh
USDollar
Europäische
Währungseinheit
Sonderziehungsrechte
specail drawing rights
Data less than the unit
used
Per cent
Percentage increase of
one period (month,
quarter, year) on the
corresponding previous
period
Percentage increase on
the corresponding month
of the previous year
Reference year
Thousand
Million
Thousand million
Ton
Terajoule=10
9kJ
Gigawatt hour (= 10
6kWh)
US dollar
European currency unit
Standard International
Trade Classification
Mitgliedstaaten insgesamt
Wirtschafts und
Währungsunion (B, D, E,
F, IRL, I, L, NL, A, Ρ, FIN)
BelgischLuxemburgische
Wirtschaftsunion
Länder Afrikas,
der Karibik und des
Pazifiks Abkommen
von Lomé
BIP-GDP-PIB
Bruttoinlandsprodukt
OPEC-OPEC-OPEP
Standard international
trade classification
Total of Member States
of the EU
Economic Monetary Union
(Β, D, E, F, IRL, I, L, NL, A,
Ρ, FIN)
BelgoLuxembourg
economic union
African, Caribbean and
Pacific countries of the
Lomé Convention
Donnée inférieure à la
moitié de l'unité utilisée
Pourcentage
Accroissement en
pourcentage d'une période
(mois, trimestre ou année)
sur la periode précédente
Accroissement en
pourcentage d'un mois sur
le mois correspondant de
l'année précédente
Année de base
Millier
Million
Milliard
Tonne métrique
Terajoule = 10
9kJ
Gigawattheure = 10
6kWh
Dollar US
Unité monétaire
européenne
Droits de tirages spéciaux
Classification type pour le
commerce international
Ensemble des États
membres de l'UE
Union Monétaire
Economique (B, D, E, F,
IRL, I, L, NL, A, P, FIN)
Union économique
belgoluxembourgeoise
États d'Afrique, des
Caraïbes et du Pacifique
Convention de Lomé
Gross domestic product
Produit intérieur brut
EGKS-ECSC-CECA
Organisation der
erdölexportierenden
Länder
Europäische Gemeinschaft
für Kohle und Stahl
t RÖE-TOE-TEP Tonne Rohöleinhiet
Organization of petroleum
exporting countries
European coal and steal
community
Ton of oil equivalent
Organisation des pays
exportateurs de pétrole
Schaubilder
Graphics
Graphiques
SCHAUBILDER
GRAPHICS
GRAPHIQUES
ι / ι
f\f*
Veränderung des
Changes in gross domestic
Evolution du produit
~ r / 1
Bruttoinlandsprodukts
product
intérieur brut
eurostat
(Volumenindex 1990=100)
(Volume index 1990=100)
(Indice de volume 1990=100)
EU15
*
EUR11
■JPN
■USA
125
120
115
110
105
SCHAUBILDER
GRAPHICS
GRAPHIQUES
ι ι · > / \ ο 4 ι 4 I
eurostat
Veränderung des
Bruttoinlandsprodukts
(Volumenindex 1990=100)
Changes in gross
domestic product
(Volume index 1990=100)
Evolution du produit
intérieur brut
(Indice de volumel990=100)
DANMARK
0201
DEUTSCHLAND
1995
1996
1997
1998
EU15
Danmark
1995
1996
1997
1998
EU15
Deutschland
ESPANA
1995
1996
1997
1998
r = 1 EU15
Espana
1995
1996
1997
1998
EU15
France
ITALIA
1995
1996
1997
1998
EU15
Italia
1995
1996
1997
1998
SCHAUBILDER
GRAPHICS
GRAPHIQUES
ι y ι
Veränderung des
Ulfcj
:
Bruttoinlandsprodukts
eurostat
|
(Volumenindex 1990=100)
Changes in gross
Evolution du produit
domestic product
intérieur brut
(Volume index 1990=100)
(Indice de volume 1990=100)
1995
1996
1997
1998
1995
1996
1997
1998
EU-15
Österreich
I
1 EU15
c=¡
Portugal
«iîiTiî.
SVERIGE
0201
1995
1996
1997
1998
1995
1996
1997
1998
Γ = 1 EU15
Suomi/Finland
EU15
Sverige
0201
1995
1996
1997
1998
1995
1996
1997
1998
SCHAUBILDER
GRAPHICS
GRAPHIQUES
^2 06
ι r n e t a t
eurostat
Arbeitslosenquoten
insgesamt saisonbereinigt
Unemployment rates total
seasonally adjusted
Taux de chômage total
désaisonnalisé
25 η
2 0
1 5
-10
5
0
BELGIQUE/BELGIE
0601
1996
1997
1998
1999
= D
EU15
Γ = Ί EUR-11
Belgique/België
25
20
15
10-1
5
0
1996
I
I EU15
L
1997
— I bUH11
1998
>
■
ι
Danmark
1999
DEUTSCHLAND
1996
1997
1998
1999
0
F = n EU15
Π=^1 EUR11
Deutschland
1996
1996
I
I EU15
1997
I I
HJH11
1998
1999
ι
ι
hspana
1997
1998
1999
SCHAUBILDER
GRAPHICS
GRAPHIQUES
m 06
eurostat
Arbeitslosenquoten
insgesamt saisonbereinigt
Unemployment rates total
seasonally adjusted
Taux de chômage total
désaisonnalisé
IRELAND
0601
25
20
15
_
10
-1996
I
I EU15
1997
I — I bUH11
1998
^ H
Ireland
1999
ITALIA
1996
0601
EU15
1997
1998
1999
EUR11
Italia
LUXEMBOURG
25
2 0
-15
10
5
0
1996
EU15
1997
0601
25
20
15
10
1998
1999
EUR11
Luxembourg
NEDERLAND
0601
1996
I — I EU15
1997
I —■ I bUH11
1998
1999
H H
Nederland
25
20
15
10
5
0
25
2 0
15
10
0601
SCHAUBILDER
GRAPHICS
GRAPHIQUES
^ 0 6
■ m e t a t I
eurostat
Arbeitslosenquoten
Unemployment rates total
Taux de chômage total
insgesamt saisonbereinigt
seasonally adjusted
désaisonnalisé
SUOMI/FINLAND
1996
1997
1998
1999
EU15
Γ = Π EUR11
Suomi/Finland
1996
I — I EU15
1997
I I hUH11
1998
■ ■
Sverige
1999
UNITED KINGDOM
25
20
1 5
1 0
-0601
USA
25
20
15
10
1996
1997
1998
1999
^ 3
EU15
Γ ^ Π EUR11
United Kingdom
0601
1996
I
1 EU15
1997
I I
hUH11
1998
■ ■ ■
USA
1999
25 η
20
15-1
10
1996
1997
1998
1999
SCHAUBILDER
GRAPHICS
GRAPHIQUES
m
07
eurostat
Industrielle Produktion
Industrie insgesamt
(ohne Baugewerbe)
Trend 1995=100
Industrial production
Total industry
(excluding construction)
Trend 1995=100
Production industrielle
Ensemble de l'indudstrie
(sans bâtiment)
Tendance 1995=100
NACE Rev.1 CE
EU15
A
EUR11
■USA
■JPN
125
120
115
110
105
100
A A A A A
SCHAUBILDER
GRAPHICS
GRAPHIQUES
L^ 07
eurostat
Industrielle Produktion
Industrie insgesamt
(ohne Baugewerbe)
Trend 1995=100
Industrial production
Total industry
(excluding construction)
Trend 1995=100
Production industrielle
Ensemble de I'indudstrie
(sans bâtiment)
Tendance 1995=100
F98 M98 A98 M98 J98 J98 A98 S98 098 N98 D98 J99 F99 F98 M98 A98 M98 J98 J98 A98 S98 098 N98 D98 J99 F99
EU-15
Belgique/België
EU-15
Danmark
DEUTSCHLAND
0701
120
115
110-1
105
100
95
90
85
_
F98 M98 A98 M98 J98 J98 A98 S98 098 N98 D98 J99 F99
EU-15
Deutschland
ELLAD/
120-1
115-
110-
105-
10095
-90
\
8 5 ·
nn .
0701
F98 M98 A98 M98 J98 J98 A98 S98 098 N98 D98 J99 F99
EU-15
Ellada
SCHAUBILDER
GRAPHICS
GRAPHIQUES
m 07
eurostat
Industrielle Produktion
Industrie insgesamt
(ohne Baugewerbe)
Trend 1995=100
Industrial production
Total industry
(excluding construction)
Trend 1995=100
Production industrielle
Ensemble de I'indudstrie
(sans bâtiment)
Tendance 1995=100
M98 A98 M98 J98 J98 A98 S98 098 N98 D98 J99 F99
EU15
Ireland
F98 M98 A98 M98 J98 J98 A98 S98 098 N98 D98 J99 F99
EU
Italia
F98 M98 A98 M98 J98 J98 A98 S98 098 N98 D98 J99 F99
EU15
Luxembourg
F98 M98 A98 M98 J98 J98 A98 S98 098 N98 D98 J99 F99
Γ=~1 EU15
Nederland
RREICH
0701
F98 M98 A98 M98 J98 J98 A98 S98 098 N98 D98 J99 F99
PORTUGAL
0701
F98 M98 A98 M98 J98 J98 A98 S98 098 N98 D98 J99 F99
SCHAUBILDER
GRAPHICS
GRAPHIQUES
m
07
eurostat
Industrielle Produktion
Industrie insgesamt
(ohne Baugewerbe)
Trend 1995=100
Industrial production
Total industry
(excluding construction)
Trend 1995=100
Production industrielle
Ensemble de l'indudstrie
(sans bâtiment)
Tendance 1995=100
SUOMI/FINLAND
0701
SVERIGE
0701
F98 M98 A98 M98 J9B J98 A98 S98 098 N98 D98 J99 F99
EU15
Suomi/Finland
F98 M98 A98 M 9 8 * J98 J98 A98 Ξ98 098 N98 D98 J99 F99
EU15
Sverige
F98 M98 A98 M98 J98 J98 A98 S98 098 N98 D98 J99 F99
EU15
United Kingdom
F98 M98 A98 M98 J98 J98 A98 S98 098 N98 D98 J99 F99
EU15
USA
SCHAUBILDER
GRAPHICS
GRAPHIQUES
eurostat
Verbaucherpreisindizes Consumer prices indices
Indice des prix à la consommation
Gesamtindex
General index
Indice général
T/T-12%
T/T-12%
T/T-12%
EU-15
USA
■JPN
4,0
3,5
3,0
2,5
2,0
1,5
1,0
0,5
0,0
-0,5
-1,0
' " " / \
·.
~ · *
\
S~^J"
GRAPHICS
GRAPHIQUES
m
21
eurostat
Harmonisierte
Harmonized indices of
Verbraucherpreisindizes
consumer prices General
Gesamtindex T/T12%
index T/T12%
Indices harmonisés des prix
à la consommation
Indice d'ensemble T/T12%
BELGI
M98 A98 M98 J98 J98 A98 S98 098 N98 D98 J99 F99 M99 M98 A98 M98 J98 J98 A98 S98 098 N98 D98 J99 F99 H99
■ ■ Belgique/België
C==3 EU15
Ε Ξ 3
EUR11
^ β
Danmark
Ξ=3 EU15
ΓΞΞΞΠ EUR11
M98 A98 M98 J98 J98 A98 S98 098 N98 D98 J99 F99 M99
ΞΞ3 EU15
C
EUR11
Deutschland
2 , 5
2,0
-1,5
1,0
0,5
-^^fl
/ ' * " * . - " "
0,0
M98 A98 M98 J98 J98 A98 S98 098 N98 D98 J99 F99 M99
M98 A98 M98 J98 J98 A98 S98 098 N98 D98 J99 F99 M99
ι
1 Ellada
ΞΞ3 EU15
ΕΞΞΞΙ
EUR11
M98 A98 M98 J98 J98 A98 S98 098 N98 D98 J99 F99 M99
SCHAUBILDER
GRAPHICS
GRAPHIQUES
m
21
eurostat
Harmonisierte
Harmonized indices of
Verbraucherpreisindizes
consumer prices
Gesamtindex T/T-12%
General index T/T-12%
Indices harmonisés des prix
à la consommation
Indice d'ensemble T/T-12%
M98 A98 M98 J98 J98 A98 S98 098 N98 D98 J99 F99 M99 M98 A98 M98 J98 J98 A98 S98 098 N98 D98 J99 F99 M99
EU-15
EUR-11
Ireland
EU-15
Γ = Ί EUR-11
Italia
LUXEMBOUR
M98 A98 M98 J98 J98 A98 S98 098 N98 D98 J99 F99 M99 "98 A98 M98 J98 J98 A98 S98 098 N98 D98 J99 F99 M99
EU-15 Γ = 1 EUR-11
Luxembourg
Γ = ) EU-15 ΓΞΞΞ3 EUR-11
Nederland
0,0
m^m^m^m^m^^^^^^^^^^^^^^^
0,5
SCHAUBILDER
GRAPHICS
GRAPHIQUES
m
eurostat
Harmonisierte Harmonized indices of
Verbraucherpreisindizes consumer prices General
Gesamtindex T/T-12% index T/T-12%
Indices harmonisés des prix à la
consommation
Indice d'ensemble T/T-12%
SUOMI/FINLAND
M98 A98 M98 J98 I 1 Fll-15 I
J98
I
A98 S98 098
EUR-11
N98 D98 J99 F99 M99
^ H Suomi/Finland
M98 A98 M98 J98 J98 A98 S98 098 N98 D98 J99 F99 M99
EU-15
Ώ
EUR-11
Sverige
UNITED KINGDOM
M98 A98 M98 J98 J98 A98 S98 098 N98 D98 J99 F99 M99
SCHAUBILDER
GRAPHICS
GRAPHIQUES
m
eurostat
Wechselkurs
(Durchschnitt)
Exchange rate
(Mean)
Taux de change
(Moyenne)
Ί EUR = ... USD
- - - 1 EUR = ... YEN
1,5
1,4
1,3
1,2
1,1
1,0
. # ■ - \
170
160
150
140
130
120
110
100
SCHAUBILDER
GRAPHICS
GRAPHIQUES
^ 2 4
eurostat
Wechselkurs
(Durchschnitt)
Exchange rate
(Mean)
Taux de change
(Moyenne)
DANMARK
2401
ELLADA
2401
M98 A98 M98 J98 J98 A98 S98 098 N98 D98 J99 F99 M99 A99
1
EUR
= .
1
USD
= .
M98 A98 M98 J98 J98 A98 S98 098 N98 D98 J99 F99 M99 A99
1
EUR
=
...
1
USD
= .
0,90
0,85
0,80
0,75
0,70
0,65
0,60
0,55 1
0 50
M98 A98 M98 J98 J98 A98 S98 098 N98 D98 J99 F99 M99 A99 M98 A98 M98 J98 J98 A98 S98 098 N98 D98 J99 F99 M99 A99
SCHAUBILDER
GRAPHICS
GRAPHIQUES
=
Jr
eurostal
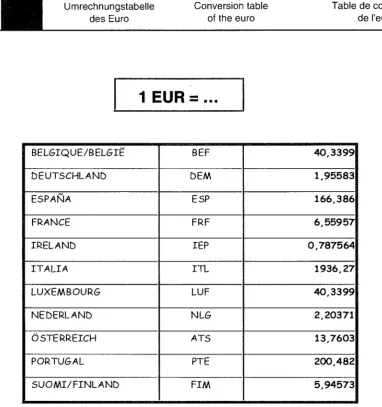
Umrechnungstabelle
des Euro
[image:27.595.87.470.107.515.2]Conversion table
of the euro
Table de conversion
de l'euro
1
EUR
=
...
BELGIQUE/BELGIË
DEUTSCHLAND
ESPAÑA
FRANCE
IRELAND
ITALIA
LUXEMBOURG
NEDERLAND
ÖSTERREICH
PORTUGAL
SUOMI/FINLAND
BEF
DEM
ESP
FRF
IEP
ITL
LUF
NLG
ATS
PTE
FIM
40,3399
1,95583
166,386
6,55957
0,787564
1936,27
40,3399
2,20371
13,7603
200,482
Tabellen
Tables
Tableaux
Volkswirtschaftliche Gesamtrechnungen
National accounts
1994
1995
1996
1997
1995
IV
1996 I
I
1997
1998 I
I
IV
Bruttoinlandsprodukt
0101
Mrd ECU
1990
VOLKSWIRTSCHAFTLICHE GESAMTRECHNUNGEN
NATIONAL ACCOUNTS
COMPTES NATIONAUX
Gross domestic product
BnECU
1990
Ξ £
EU15 EUR11 Β DK EL IRL NL RN
eurostat
Produit intérieur brut
Mrd ECU
1990
UK US JP
1994 1995 1996 1997 1995 1996 1997 1998 III IV III IV III IV III IV 5572.81 5700.86 5804.44 5959.09 1427.59 1430.17 1441.54 1447.17 1455.37 1460.36 1467.33 1486.30 1497.47 1508.00 1519.17 1527.89 1537.66 1540.54
0102
EU15 4393.99 4487.25 4561.43 4676.25 1123.43 1124.61 113321 1137.40 1143.68 1147.14 1150.94 1166.70 1175.45 1183.16 1193.16 1200.32 1208.31 1210.31 161.01 164.78 166.90 171.92 41.04 4127 41.25 41.51 42.01 42.15 42.19 42.83 43.40 43.49 43.99 4422 44.34 115.04 118.53 122.45 126.19 29.67 29.97 30.17 30.61 30.84 30.83 31.00 31.68 31.62 31.90 3228 32.08 32.76 32.79 1388.50 1405.39 1423.40 1454.73 350.37 351.32 353.46 354.05 356.91 358.19 357.79 364.42 364.93 367.40 372.26 370.45 375.32 376.82Veränderung des
Bruttoinlandsprodukts Volumen
(T/T1 %)
EUR11 Β DK D
68.00 69.42 71.07 73.32 EL 40323 414.19 42420 439.19 103.89 104.29 104.90 105.66 106.48 107.32 10825 109.27 110.39 111.44 112.46 113.54 114.57 115.43 E 973.86 994.15 1009.57 1032.76 249.18 247.99 251.37 251.16 253.10 253.97 254.17 257.33 259.61 261.68 263.72 266.09 267.08 268.97 F 43.16 482E 5224 57.8C
Chanç
IRL 883.56 90621 913.96 927.27 228.07 228.94 230.75 228.35 229.09 228.41 228.72 232.87 234.11 234.71 234.35 235.68 236.87 9.92 10.24 10.50 10.93 242.46 247.93 255.67 264.98 62.50 62.67 63.20 63.56 64.31 64.58 65.09 65.77 66.71 67.40 67.99 68.40 68.78 69.60 135.45 137.74 140.47 144.01 34.48 34.64 34.81 35.15 35.13 35.35 35.50 35.68 36.16 36.62 36.93 37.16 37.19 37.39ies in gross domestic product
volume terms
(T/T1
%)
I L NL A
57.33 58.96 60.84 62.97 14.65 14.93 15.15 15.22 15.13 15.33 15.55 15.75 15.71 15.95 16.12 16.29 16.23 Ρ 100.70 104.75 109.06 115.13 25.86 25.86 2627 26.36 26.99 27.37 27.39 28.30 28.69 29.03 29.34 29.70 30.16 RN 178.10 185.12 187.46 190.76 46.56 46.26 46.43 46.61 46.97 47.05 47.27 47.35 47.89 48.49 48.06 48.96 49.28 49.96 817.68 840.53 862.02 892.57 210.58 211.90 214.09 214.81 216.05 217.47 22023 222.47 22427 226.01 226.98 227.66 228.30 228.45 4859.24 4970.25 5141.52 5343.66 1249.09 1257.62 1267.98 1286.75 1293.40 1306.87 1320.43 1333.29 1347.06 1356.89 1375.34 1381.58 1394.09 1414.58 2479.38 2513.46 2643.88 2680.64 632.49 637.79 656.56 658.09 659.97 670.29 68126 664.31 671.17 664.94 656.84 652.08 650.19 645.00
Evolution du produit interieur
brutvolume
(T/T1 %)
s
UK US JP3.0 2.3 1.8 2.7 0.3 02 0.8 0.4 0.6 0.3 0.5 1.3 0.8 0.7 0.7 0.6 0.6 02 2.6 2.1 1.7 2.5 02 0.1 0.8 0.4 0.6 0.3 0.3 1.4 0.8 0.7 0.9 0.6 0.7 02 2.6 2.3 1.3 3.0 0.1 0.6 0.1 0.6 12 0.3 0.1 1.5 1.3 0.2 1.1 0.5 0.3 5.8 3.0 3.3 3.1 1.0 1.0 0.7 1.5 0.7 0.0 0.5 22 0.2 0.9 1.2 0.6 2.1 0.1
2.7 2
1.2 2
1.3 2
22 3
0.3 0.3 0.6 0.2 0.8 0.4 0.1 1.9 0.1 0.7 1.3 0.5 1.3 0.4
1 2.3
1 2.7
4 2.4
2 3.5
0.5 0.4 0.6 0.7 0.8
: 0.8
0.9 0.9 1.0 1.0 0.9
: 1.0
0.9 0.7 2.8 2.1 1.6 2.3 0.2 0.5 1.4 0.1 0.8 0.4 0.1 1.2 0.9 0.8 0.8 0.9 0.4 0.7 8.1 11.8 8.3 10.7
2.1 3
2.6 3
0.9 2
1.5 4
0.6 0.4 0.8 1.0 0.3 0.3 0.1 1.8 0.5 0.3 0.2 0.6 0.5
8 3.2
2 2.3
6 3.1
1 3.6
1.4 0.3 0.9 0.6 1.2 0.4
: 0.8
1.1 1.4 1.1 0.9 0.6
: 0.6
1.2 2.4 1.7 2.0 2.5 0.6 0.5 0.5 1.0 0.1 0.6 0.4 0.5 1.4 1.3 0.9 0.6 0.1 0.5 2.4 2.8 3.2 3.5 1.5 2.0 1.5 0.5 0.6 1.3 1.5 1.3 0.2 1.5 1.1 1.1 0.4 3.7 4.0 4.1 5.6 0.1 0.0 1.6 0.4 2.4 1.4 0.1 3.3 1.4 1.2 1.0 1.2 1.5 3.3 3.9 1.3 1.8 0.5 0.6 0.4 0.4 0.8 0.2 0.5 0.2 1.1 1.3 0.9 1.9 0.7 1.4 4.4 2.8 2.6 3.5 0.5 0.6 1.0 0.3 0.6 0.7 1.3 1.0 0.8 0.8 0.4 0.3 0.3 0.1 3.5 2.3 3.5 3.9 0.8 0.7 0.8 1.5 0.5 1.0 1.0 1.0 1.0 0.7 1.4 0.5 0.9 1.5 0.7 1.4 5.2 1.4 0.8 0.8 2.9 0.2 0.3 1.6 1.6 2.5 1.0 0.9 1.2 0.7 0.3 0.8
Die Daten für EUR15 wurden in einer zusammenhängenden Weise errechnet, die alle verfügbaren Daten der Mitgliedstaaten, die vierteljährliche Ergebnisse bereitstellen, verwendet.
Data for EUR15 are calculated statistically using data available from those Member States which compile quarterly accounts".
VOLKSWIRTSCHAFTLICHE GESAMTRECHNUNGEN
NATIONAL ACCOUNTS
COMPTES NATIONAUX
m
eurostat
1994 1995 1996 1997 1995 1996 1997 1998 1994 1995 1996 1997 1995 1996 1997 1998 III IV III IV III IV III IV III IV I II III IV I II III IV I II III IV0103
EU15 3379.64 3440.49 3516.28 358729 862.43 863.68 874.99 875.89 881.85 883.55 887.45 896.35 897.82 905.66 912.53 917.13 924.57 932.530104
EU15 1.9 1.8 22 2.0 0.1 0.2 1.3 0.1 0.7 0.2 0.4 1.0 0.2 0.9 0.8 0.5 0.8 0.9Inländischer privater Verbrauch
Mrd ECU
1990
EUR11 2671.58 2719.75 2773.00 2817.34 682.13 681.98 690.87 690.95 695.55 695.62 697.99 703.89 704.96 710.49 716.32 719.78 726.66 733.36 Β 103.55 104.42 106.30 108.50 26.14 26.33 26.45 26.57 26.59 26.71 26.92 26.99 27.25 27.32 27.79 28.33 28.14 DK 58.41 60.34 62.00 6423 15.20 15.23 15.34 15.37 15.53 15.71 15.74 16.21 15.92 16.31 16.36 16.57 16.68 16.84 D 899.16 920.05 940.09 945.64 230.28 230.83 234.22 233.43 236.09 235.55 234.41 237.28 235.76 237.56 238.73 237.81 241.86 244.63Veränderung des inländischen
privaten Verbrauchs Volumen
(T/T1 %)
EUR11 1.5 1.8 2.0 1.6 0.1 0.0 1.3 0.0 0.7 0.0 0.3 0.9 0.2 0.8 0.8 0.5 1.0 0.9 Β 1.6 0.8 1.8 2.1 0.5 0.7 0.5 0.5 0.1 0.4 0.8 0.3 1.0 0.3 1.7 2.0 0.7 DK 7.1 3.3 2.7 3.6 1.1 0.2 0.7 0.2 1.1 1.2 0.2 3.0 1.8 2.4 0.3 1.3 0.6 1.0 D 1.6 2.3 2.2 0.6 0.3 0.2 1.5 0.3 1.1 0.2 0.5 1.2 0.6 0.8 0.5 0.4 1.7 1.1 EL 50.95 52.36 53.3¿ 54.71 EL 2.C 2.Ê 1.S 2.6 E 251.01 255.00 260.04 268.12 63.74 64.02 64.47 64.91 6521 65.54 66.05 66.74 67.40 68.02 68.61 69.37 69.98 70.56 E 0.9 1.6 2.0 3.1 0.1 0.4 0.7 0.7 0.5 0.5 0.8 1.0 1.0 0.9 0.9 1.1 0.9 0.8 F 582.59 592.27 604.00 609.19 148.85 148.00 151.66 150.15 151.52 150.68 150.83 151.14 152.79 154.44 155.77 157.65 158.81 159.84
Private national consumption
BnECU
IRL 24.2 252C 26.7Í 28.41Changes
F 1.4 1.7 2.0 0.9 0.0 0.6 2.5 1.0 0.9 0.6 0.1 0.2 1.1 1.1 0.9 1.2 0.7 0.7 IRL 6.C 4.1 6.1 6.C1990
I 538.29 543.86 549.88 564.74 136.44 136.51 136.62 136.87 137.45 138.48 •39.52 40.61 141.07 141.16 141.91 142.39 143.28 L 5.26 5.33 5.44 5.58 NL 143.04 145.96 149.89 154.41 36.80 36.88 37.15 3723 37.68 37.83 38.14 38.54 38.59 39.13 39.57 40.08 40.62 A 76.15 78.35 79.92 80.50 19.65 19.67 20.00 2027 19.74 19.89 20.02 20.04 20.15 2024 2020 20.47 20.58 20.53in private national consumption
volume terms
(T/T1 %)
I 1.5 1.0 1.1 2.7 0.8 0.1 0.1 02 0.4 0.8 0.8 0.8 0.3 0.1 0.5 0.3 0.6 L 3.5 1.4 2.1 2.5 NL 22 2.0 2.7 3.0 1.6 0.2 0.7 0.2 1.2 0.4 0.8 1.1 0.1 1.4 1.1 1.3 1.4 A 1.8 2.9 2.0 0.7 0.3 0.1 1.7 1.4 2.6 0.8 0.6 0.1 0.6 0.5 0.2 1.3 0.5 02 Ρ 38.52 39.21 40.20 41.40 9.75 9.81 10.05 10.03 10.01 10.09 1025 1029 10.38 10.48 10.72 10.91 10.98 Ρ 22 1.8 2.5 3.0 2.0 0.6 2.5 0.2 0.2 0.8 1.6 0.4 0.8 1.0 2.3 1.8 0.6 RN 22.20 22.63 23.20 23.87 13.17 13.30 13.58 13.51 13.62 13.85 13.92 14.01 14.09 14.35 14.39 14.71 15.01Consommation nationale
privée
s
90.43 91.13 92.32 94.17 22.76 22.87 23.02 22.85 23.21 2323 2324 23.64 23.61 23.69 23.80 24.02 24.30 24.49Mrd ECU
UK 508.26 516.90 535.62 556.84 12925 130.50 132.52 133.50 13425 135.63 137.00 138.98 139.68 141.45 142.30 142.96 143.05 143.84us
3273.12 3360.38 3467.51 3585.07 845.24 850.10 857.80 867.76 871.73 878.00 88729 890.81 904.40 910.61 924.16 937.89 947.32 959.061990
JP 1463.91 1493.81 1537.84 1553.45 37720 378.61 384.13 382.95 383.50 387.77 401.62 381.37 387.34 383.65 384.93 384.40 383.87 383.53Evolution de la consommation
nationale privée volume
(T/T1 %)
RN 0.3 2.0 2.5 2.9 0.3 0.9 22 0.6 0.8 1.7 0.5 0.7 0.6 1.8 0.3 22 2.0
s
1.8 0.8 1.3 2.0 0.1 0.5 0.6 0.7 1.6 0.1 0.0 1.7 0.1 0.3 0.5 0.9 1.2 0.8 UK 2.9 1.7 3.6 4.0 02 1.0 1.6 0.7 0.6 1.0 1.0 1.4 0.5 1.3 0.6 0.5 0.1 0.6 US 3.3 2.7 32 3.4 0.7 0.6 0.9 1.2 0.5 0.7 1.1 0.4 1.5 0.7 1.5 1.5 1.0 12 JP 1.9 2.0 3.0 1.0 1.0 0.4 1.5 0.3 02 1.1 3.6 5.0 1.6 1.0 0.3 0.1 0.1 0.1Die Daten für EURI 5 wurden in einer zusammenhängenden Weise errechnet,die alle verfügbaren Daten der Mitgliedstaaten, die vierteljährliche Ergebnisse bereitstellen, verwendet.
Data for EUR15 are calculated statistically using data available from thoseMember States which compile quarterly accounts".
VOLKSWIRTSCHAFTLICHE GESAMTRECHNUNGEN
NATIONAL ACCOUNTS
COMPTES NATIONAUX
1994 1995 1996 1997 1995 1996 1997 1998 III IV III IV III IV III IV
0105
EU15 986.07 991.40 1004.60 1003.59 248.01 249.88 249.77 251.56 251.94 251.33 250.96 250.92 251.66 250.05 254.00 255.33 25523 253.88Staatsverbrauch
Mrd ECU
1990
EUR11 737.11 73925 748.71 748.39 184.98 186.66 186.41 187.54 187.66 187.09 187.33 187.35 187.69 186.02 189.56 190.62 190.17 188.57 Β 22.84 22.98 23.31 23.50 5.66 5.96 5.80 5.87 5.89 5.78 5.85 5.89 5.89 5.87 5.92 5.99 5.99 DK 29.19 29.83 30.78 31.11 7.49 7.53 7.60 7.68 7.75 7.75 7.71 7.78 7.81 7.81 7.92 7.94 7.98 8.07 D 173.09 172.33 172.80 169.15 43.02 43.78 42.97 43.38 43.17 4329 43.04 42.37 4224 41.41 42.67 42.71 41.96 41.47 EL 9.66 1021 10.3C 10.26 E 67.70 68.92 69.58 70.53 17.27 17.40 17.51 17.41 17.31 17.38 17.52 17.59 17.67 17.78 17.84 17.91 17.95 17.99Consumption of general government
BnECU
1990
F 190.79 190.75 195.66 198.00 47.71 48.02 48.49 48.80 49.08 4928 49.35 49.44 49.54 49.67 49.83 49.96 50.15 5028 IRL 5.89 6.04 6.13 6.42 I 154.73 153.52 153.93 152.60 38.38 38.45 38.51 38.58 38.51 38.33 38.14 38.17 3822 38.28 38.47 38.61 38.74 L 1.2C 1.22 1.2S 1.2S NL 34.21 34.49 34.92 35.43 8.65 8.63 8.62 8.79 8.73 8.78 8.76 8.81 8.90 8.95 9.02 9.03 9.11 A 25.71 25.7C 25.85 24.85 Ρ 9.71 9.96 10.14 10.35 2.49 2.50 2.52 2.53 2.54 2.55 2.56 2.58 2.59 2.61 2.65 2.67 2.69 RN 49.72 51.83 53.60 54.77 5.42 5.46 5.49 5.57 5.60 5.63 5.53 5.62 5.65 5.66 5.62 5.70 5.73-
J
r
eurostal
Consommation des
administrations publiques
Mrd ECU1990
s
50.59 50.11 50.02 48.99 12.48 12.39 12.30 12.36 12.69 12.57 12.08 12.16 12.43 12.25 12.36 12.41 12.51 12.58 UK 159.52 162.00 164.79 164.83 40.50 40.71 40.86 41.42 41.27 41.36 41.27 41.08 41.17 41.43 41.60 41.78 42.01 42.12 US 774.36 771.81 776.85 787.06 194.22 191.50 192.35 195.58 195.36 195.18 195.67 197.53 197.56 197.93 196.68 199.55 199.33 201.61 JP 229.62 237.21 241.54 245.20 59.53 59.81 60.12 60.02 59.90 61.68 60.17 61.71 62.44 61.09 61.51 61.61 62.08 61.741994
1995
1996
1997
1995
1996
IV
1997 I
I
1998 I
IV
Veränderung des Staatsverbrauchs
0106 Volumen
(T/T1 %)
EU15 EUR11 Β DK D EL
Changes in the consumption of general
government
volume terms (T/T1 %)
F IRL I L NL A P
Evolution de la consommation
des administrations publiques
volume(T/T1 %)
RN S UK US JP
0.8 0.5 1.3 0.1 0.8 0.3 1.3 0.0 1.7 0.6 1.4 0.8 2.9 2.2 3.2 1.1 0.8 0.4 0.3 2.1 1.1 5.7 1.0 0.4 0.3 1.8 1.0 1.4 1.1 0.0 2.6 1.2 5.0 2.6 1.5 4.8 0.3 0.8 0.3 0.9 1.5 2.4 5.1 0.3 0.6 0.8 1.2 1.5 2.5 0.0 0.6 3.9 2.1 2.5 1.8 2.1 2.6 4.2 3.4 2.2 0.7 1.0 0.2 2.1 1.4 1.6 1.7 0.0 0.4 0.3 0.7 1.3 2.4 3.3 1.8 1.5 0.4 0.8 0.0 0.7 0.2 0.2
0 2
0.0 0.3 0.6 1.6 0.5 0.0 0.5 0.6 0.9 0.1 0.6 0.1 -0.3 0.1 0.0 0.2 0.9 1.9 0.6
0 2
0.8 0.0 5.4 2.8 1.2 0.4 2.0 12 0.8 0.0 0.4 0.8 1.2 0.0 0.6 0.5 1.1 1.0 0.9 0.1 0.4 0.8 0.5 0.0 1.4 02 0.5 1.2 1.6 1.8 1.9 0.9 -0.5 0.3 -0.6 -1.6 -0.3 -2.0 3.0 0.1 1.8 1.2 0.5 0.7 0.6 0.6 0.6 0.4 0.8 0.4 0.4 0.7 0.3 0.4 0.2 0.3 0.4 0.6 1.0 0.7 0.6 0.4 0.1 0.2 0.2 0.3 0.3 0.3 0.4 0.3 0.1 02 0.1 0.2 -0.2 -0.5 -0.5 0.1 0.1 0.2 0.5 0.4 0.3 0.2 -0.3 -0.1 1.9 0.6 0.6 0.2 0.6 1.0 0.5 0.8 0.1 0.9 0.2 0.4 0.7 0.5 0.5 0.4 0.5 0.5 0.7 0.8 1.3 0.9 0.7 0.3 0.9 0.5 1.5 0.5 0.6 1.8 1.6 0.6 0.2 -0.6 1.4 0.5 0.9 0.8 0.7 0.4 2.7 0.9 -3.9 0.7 2.2 -1.5 0.9 0.4 0.8 0.6 0.4 0.5 0.4 1.4 0.4 0.2 0.2 -0.5 0.2 0.6 0.4 0.4 0.6 0.3 0.1 -1.4 0.4 1.7 0.1 -0.1 0.3 1.0 0.0 02 0.6 1.5 0.1 1.1 0.8 0.5 0.5 -0.2 -0.2 3.0 -2.5 2.6 1.2 -2.2 0.7 0.2 0.8 -0.6
Die Daten für EUR15 wurden ¡η einer zusammenhängenden Weise errechnet,die alle verfügbaren Daten der Mitgliedstaaten, die vierteljährliche Ergebnisse bereitstellen, verwendet.
Data for EUR15 are calculated statistically using data available from thoseMember States which compile quarterly accounts.
VOLKSWIRTSCHAFTLICHE GESAMTRECHNUNGEN
NATIONAL ACCOUNTS
COMPTES NATIONAUX
Wh
eurostat
1994 1995 1996 19971995 III
IV
1996 I
II III IV
1997 I
II III IV
1998 I
II III IV 1994 1995 1996 1997
1995 III
IV
1996 I
II III IV
1997 I
II III IV
1998 I
II III IV
0107
EU15 1101.84 1139.49 1157.67 1190.81 286.22 285.56 283.47 290.04 291.47 292.68 291.17 296.74 298.69 304.21 310.59 308.41 314.27 316.160108
EU15 2.4 3.4 1.6 2.9 0.6 02 0.7 2.3 0.5 0.4 0.5 1.9 0.7 1.9 2.1 0.7 1.9 0.6Bruttoanlageinvestitionen
Mrd ECU
1990
EUR11 887.97 914.66 921.60 940.68 229.30 228.50 225.24 231.36 231.95 233.04 230.95 234.30 236.10 239.33 243.84 241.92 246.10 246.61 Β 29.11 30.34 30.48 32.13 7.66 7.57 7.47 7.61 7.68 7.71 7.64 8.18 7.97 8.32 8.13 8.30 8.56 DK 21.22 23.84 25.03 27.66 6.02 6.22 6.05 6.14 6.33 6.50 6.61 6.95 7.03 7.10 7.56 7.26 7.42 7.28 D 308.71 308.62 304.95 305.14 76.14 75.39 74.56 76.28 76.97 76.69 75.30 77.02 76.32 76.60 78.83 75.72 77.34 78.27 EL 14.3 14.9; 16.2; 17.8tVeränderung der
Bruttoanlageinvestitionen Volumen
(T/T1 %)
EUR11 2.2 3.0 0.8 2.1 0.0 0.3 1.4 2.7 0.3 0.5 0.9 1.5 0.8 1.4 1.9 0.8 1.7 0.2 Β 0.1 4.2 0.5 5.4 0.9 1.2 1.3 1.9 0.9 0.3 0.9 7.1 2.6 4.4 2.3 2.0 3.1 DK 7.5 12.3 5.0 10.5 4.6 3.4 2.8 1.5 3.0 2.7 1.7 5.1 1.2 1.0 6.5 3.9 2.2 1.8 D 3.5 0.0 1.2 0.1 1.4 1.0 1.1 2.3 0.9 0.4 1.8 2.3 0.9 0.4 2.9 3.9 2.1 1.2 EL 2.7 4.2 8.8 9.6 E 84.43 91.39 92.59 97.26 23.11 22.97 22.99 23.10 23.19 23.33 23.66 23.99 24.53 25.12 25.65 26.16 26.81 27.47 E 2.5 8.3 1.3 5.1 0.7 0.6 0.1 0.5 0.4 0.6 1.4 1.4 2.3 2.4 2.1 2.0 2.5 2.5 F 184.99 189.57 188.65 189.25 47.39 47.28 46.90 4726 47.22 47.26 46.61 47.27 47.60 47.78 48.41 49.04 49.43 50.12
Gross fixed capital formation
BnECU
IRL I 6.6; 7.3! 8.3! 9.26Change,
F 1.3 2.5 0.5 0.3 0.4 0.2 0.8 0.8 0.1 0.1 1.4 1.4 0.7 0.4 1.3 1.3 0.8 1.4 IRL 12.2 10.S 13.7 10.S 154.83 162.34 165.47 166.82 42.24 42.86 42.75 42.81 42.68 42.50 42.35 42.70 43.16 43.92 44.20 44.30 44.80 44.911990
L 2.2( 2.3¿ 2.2Í 2.5Í3 in gross fixed
volume te
(T/T1 °,
I 0.0 4.9 1.9 0.8 1.8 1.5 0.3 0.1 0.3 0.4 0.4 0.8 1.1 1.8 0.6 0.2 1.1 02 L 8.8 6.5 2.5 132 NL 46.76 49.01 51.65 55.15 12.24 12.25 12.63 12.67 13.00 13.36 13.60 13.84 13.78 13.95 14.35 14.16 14.38 14.50 A 33.03 33.43 34.27 3522 8.31 8.42 8.54 8.51 8.42 8.74 8.77 8.54 8.77 9.05 9.72 9.04 9.32 8.97capital formation
rms
NL 2.2 4.8 5.4 6.8 2.8 0.0 32 0.3 2.6 2.8 1.8 1.8 0.4 1.2 2.9 1.3 1.5 0.9 A 8.4 12 2.5 2.8 0.4 1.4 1.5 0.4 1.0 3.7 0.4 2.7 2.8 3.1 7.5 7.0 3.1 3.7 Ρ 15.85 16.62 17.58 19.64 4.12 4.12 4.16 4.23 4.53 4.65 4.76 4.87 5.00 5.02 5.31 529 521 Ρ 3.4 4.9 5.7 11.8 3.3 0.1 12 1.6 7.1 2.7 2.2 2.4 2.6 0.4 5.9 0.4 1.6Formation brute de capital fixe
Mrd ECU
FIN 16.53 18.49 20.09 22.94 4.35 4.18 4.51 4.51 4.68 4.74 4.74 520 5.32 5.43 5.36 5.53 5.84s
26.68 29.97 31.09 29.61 7.67 7.77 7.85 7.73 7.85 7.65 720 7.64 729 7.46 7.69 8.10 827 8.38 UK 151.65 156.10 163.72 175.05 39.47 3926 40.49 40.75 4121 4128 42.19 43.44 43.77 45.66 46.66 46.34 47.56 48.95 US 85620 899.34 969.87 1039.09 22524 228.97 235.48 242.47 246.30 249.04 252.77 258.07 265.14 266.78 277.62 284.37 286.94 294.301990
JP 736.94 747.76 83423 816.90 188.02 194.46 205.10 210.52 208.65 210.35 209.18 204.17 203.64 20029 192.71 186.16 183.50 18127Evolution de la formation
brute de capital fixe volume
(T/T1 %)
FIN 2.8 11.9 8.7 142 2.4 3.7 7.8 0.1 3.7 1.3 0.1 9.9 22 2.1 1.4 3.2 5.6 S 2.0 12.4 3.7 ^».8 52 1.3 1.0 1.5 1.5 2.6 5.9 62 ^t.7 2.4 3.1 5.3 2.1 1.3 UK 3.6 2.9 4.9 6.9 2.0 0.5 3.1 0.6 1.1 02 22 3.0 0.8 4.3 2.2 0.7 2.6 2.9 US 6.6 5.0 7.8 7.1 0.4 1.7 2.8 3.0 1.6 1.1 1.5 2.1 2.7 0.6 4.1 2.4 0.9 2.6 JP 0.6 1.5 11.6 2.1 2.0 3.4 5.5 2.7 0.9 0.8 0.6 2.4 0.3 1.6 3.8 3.4 1.4 12
Die Daten für EURI 5 wurden in einer zusammenhängenden Weise errechnet,die alle verfügbaren Daten der Mitgliedstaaten, die vierteljährliche Ergebnisse bereitstellen, verwendet.
Data for EUR15 are calculated statistically using data available from thoseMember States which compile quarterly accounts".
1994 1995 1996 1997 1995
IV
1996 I
IV
1997 I I
1998 I I
IV
VOLKSWIRTSCHAFTLICHE GESAMTRECHNUNGEN
NATIONAL ACCOUNTS
COMPTES NATIONAUX
Wh
Bestandsveränderungen und
0109
statistische Abweichungen
Mio
ECU
1990
Changes in stocks and Statistical
discrepancies
Mio ECU1990
eurostat
Variations de stocks et
divergences statistiques
Mio
ECU
1990
EU15 EUR11 DK EL IRL NL RN UK US JP
16174 26371 -1342 27190 9173 19103 -2650 24136
495
401
47
-448413
531
484
653
9676 9110 1969 19086 -677 -158 -246 -438564
356
113
-1821 -999 1215 -5403 ^1904 -297453
541
723
-7680 1763 -5313 4432485
511
139
128
169
-2
-143 -199859
853
719
2858473
603
905
962
5349 4079 4018 3408746
1477 -633729
6519 5418 1703 2111 47115 24860 25931 5210081
4701 14380 12702 10852 8851 5618 -2110 -4361 ^190 2820 7548 5350 11472 15992 19748 12951 15774 8727 6816 3701 -2125 ^441 215 1984 7312 4513 10326 14809 17063 11967 13906 330 -213 -590 -448 471 589 -283 -519 23 330 919 -213 306 83 467 184 217 194 -74 80 184 318 130 201 493 222 754 2546 2208 1561 880 -147 986 3416 3418 5833 6838 7311 11076 11734 11056 104 108 77 58 40 -60 -276 -142 -532 -570 -479 -523 -578 -571 1591 -159 -2005 -950 -1800 -649 -1567 -1167 -1098 -1073 -246 -127 -1547 -875 2148 3301 2797 -2492 -3295 -2537 -2180 4681 -502 2372 4101 4821 1416 -65 -200 -307 209 -2 -38 -342 145 -13 19 645 -92 -99 -51 387 192 28 90 383 229 523 518 921 958 607 385 1261 164 96 167 180 298 261 250 195 279 237 391 399 450 1311 1147 1076 443 767 799 882 1031 648 926 950 1218 1174 508 208 -78 -248 -427 -180 795 -500 -18 728 671 966 -283 92 1490 1303 1724 -17 280 -430 77 723 707 449 430 1286 1100 1086 4099 4449 3862 6016 10379 6485 11645 15930 11210 14159 19215 11275 14707 12182 1214 1619 4192 3475 3324 3245 1693 3445 3956 3482 2981 2540 1679 1437Bestandsveränderungen und
0110
statistische Abweichungen
Volumen % des BIP
EU15 EUR11 DK EL
Changes in stocks and Statistical
discrepancies
volume terms % of GDP
IRL I L NL A RN
Variations de stocks et
divergences statistiques
volume % du PIB
υκ
us
JP1994 1995 1996 1997
1995 III
IV
1996 I
I!
IV
1997 I
I
1998 I
I IV
0.3
0.5
0.0
0.5
0.8
0.6
0.4
-02
-0.3 -0.002
0.5
0.4
0.8
1.1
1.3
0.8
1.0
0.2
0.4
-0.10.5
0.8
0.6
0.3
-0.2 -0.40.0
02
0.6
0.4
0.9
1.2
1.4
1.0
1.2
0.3
0.2
0.0
-0.30.8
-0.5 -1.4 -1.11.1
1.4
-0.7 -1.20.1
0.8
2.1
-0.50.7
0.4
0.4
0.4
0.5
0.3
1.6
0.6
0.7
0.6
-0.20.3
0.6
1.0
0.4
0.6
1.5
0.7
2.3
0.7 -1 0.6 -0 0.1 -C 1.3 -C
0.7
0.6
0.4
0.3
-0.10.3
1.0
0.9
1.6
1.9
2.0
3.0
3.1
2.9
.0 0.1 .2 0.1 .4 0.0 .6 -0.4
: 0.1
0.1
: 0.1
0.1
0.0
-0.1 : -0.3 -0.4 : -0.5 -0.5 -0.4 : -0.5 : -0.5 -0.5
-0.1 c
0.1 c
-0.5 1 -0.5 1
0.6
-0.1 -0.8 -0.4 -0.7 -0.3 -0.6 -0.5 -0.4 -0.4 -0.1 -0.1 -0.6 -0.3.7 -0.9 4
.9 0.2 E
.0 -0.6 1
.3 0.5 1
0.8
1.2
1.5
: -0.5 -0.1
0.1
0.1
1.7
1.2
1.8
2.4
2.4
1.5
.9 0.1 .0 0.0 .3 -0.1 .2 -0.1
: -0.0 -0.5 -0.4
: 0.1
: 0.1
: 0.1
-0.6
0.0
0.3
-0.00.8
-0.5 -1.10.6
0.6
0.5
2.0
1.1
0.6
0.1
0.3
1.1
0.7
1.5
1.5
2.5
2.6
1.6
1.0
3.4
2.4
0.8
1.0
1.5
1.5
1.1
0.6
1.1
1.2
2.0
1.7
1.6
1.2
1.8
1.5
2.4
2.5
2.8
45.5 20.5 18.37.2
5.1
4.4
4.1
1.7
2.8
2.9
3.2
3.6
2.3
3.2
3.2
4.1
3.9
0.4
0.8
-0.30.4
1.1
0.4
-02
-0.5 -0.9 -0.41.7
-1.1 -0.01.5
1.4
2.0
-0.60.2
0.8
0.6
02
0.2
0.7
0.6
0.8
0.0
0.2
-0.20.1
0.3
0.3
0.2
0.2
0.6
0.5
0.5
1.0
0.5
0.5
1.0
0.3
0.3
0.3
0.5
0.8
0.5
0.9
1.2
0.8
1.0
1.4
0.8
1.0
0.9
0.0
0.2
0.5
0.5
0.2
0.3
0.7
0.5
0.5
0.5
0.3
0.5
0.6
0.5
0.5
0.4
0.3
0.2
Die Daten für EUR15 wurden in einer zusammenhängenden Weise errechnet,die alle verfügbaren Daten der Mitgliedstaaten, die vierteljährliche Ergebnisse bereitstellen, verwendet.
Data for EUR15 are calculated statistically using data available from thoseMember States which compile quarterly accounts".