White Rose Research Online URL for this paper: http://eprints.whiterose.ac.uk/131538/
Version: Accepted Version
Article:
Karlstrom, L, Richardson, PW, O'Hara, D et al. (1 more author) (2018) Magmatic
Landscape Construction. Journal of Geophysical Research: Earth Surface, 123 (8). pp. 1710-1730. ISSN 2169-9011
https://doi.org/10.1029/2017JF004369
(c) 2018. American Geophysical Union. All Rights Reserved. This is the peer reviewed version of the following article: Karlstrom, L, Richardson, PW, O'Hara, D et al. (1 more author) (2018) Magmatic Landscape Construction. Journal of Geophysical Research: Earth Surface. ISSN 2169-9011 which has been published in final form at
10.1029/2017JF004369. This article may be used for non-commercial purposes in accordance with AGU Terms and Conditions for Use of Self-Archived Versions.
Reuse
Items deposited in White Rose Research Online are protected by copyright, with all rights reserved unless indicated otherwise. They may be downloaded and/or printed for private study, or other acts as permitted by national copyright laws. The publisher or other rights holders may allow further reproduction and re-use of the full text version. This is indicated by the licence information on the White Rose Research Online record for the item.
Takedown
If you consider content in White Rose Research Online to be in breach of UK law, please notify us by
Magmatic landscape construction
1
Leif Karlstrom1, Paul W Richardson1, Daniel O’Hara1, and Susanna K
Ebmeier2
Corresponding author: L. Karlstrom, Department of Earth Sciences, University of Oregon,
Eugene, OR 97403, USA. ([email protected])
1
Department of Earth Sciences, University
of Oregon, Eugene, OR 97403, USA
2
School of Earth and Environment,
Abstract. Magmatism is an important driver of landscape adjustment
2
over ∼10% of Earth’s land surface, producing 103
−106
km2
terrains that
3
often persistently resurface with magma for 1-10s of Myr. Construction of
4
topography by magmatic intrusions and eruptions approaches or exceeds
tec-5
tonic uplift rates in these settings, defining regimes of landscape evolution
6
by the degree to which such magmatic construction outpaces erosion. We
com-7
pile data that spans the complete range of magmatism, from laccoliths, forced
8
folds, and InSAR-detected active intrusions, to explosive and effusive
erup-9
tion deposits, cinder cones, stratovolcanoes, and calderas. Distributions of
10
magmatic landforms represent topographic perturbations that span > 10
11
orders of magnitude in planform areas and > 6 orders of magnitude in
re-12
lief, varying strongly with the style of magmatism. We show that,
indepen-13
dent of erodibility or climate considerations, observed magmatic landform
14
geometry implies a wide range of potential for erosion, due to trade-offs
be-15
tween slope and drainage area in common erosion laws. Because the
occur-16
rence rate of magmatic events varies systematically with the volume of
ma-17
terial emplaced, only a restricted class of magmatic processes is likely to
di-18
rectly compete with erosion to shape topography. Outside of this range,
mag-19
matism either is insignificant on landscape scales or overwhelms pre-existing
20
topography and acts to reset the landscape. The landform data compiled here
21
provide a basis for disentangling competing processes that build and erode
22
topography in volcanic provinces, reconstructing timing and volumes of
canism in the geologic record, and assessing mechanical connections between
24
climate and magmatism.
1. Introduction
The physical form of landscapes reflects mass transfer processes at the Earth’s surface
26
that change topographic elevations via uplift and subsidence relative to the geoid, and
27
erosion or deposition of surface rocks [England and Molnar, 1990]. Uplift and
subsi-28
dence mechanisms are diverse, including tectonic processes and bulk isostatic or flexural
29
adjustment of the crust in response to loads. Subsequent lateral gravitational potential
30
energy gradients then drive physical erosion that reduces surface topographic relief. For
31
terrestrial landscapes on Earth, tectonic uplift is usually considered to be the primary
32
large-scale process driving landscape evolution.
33
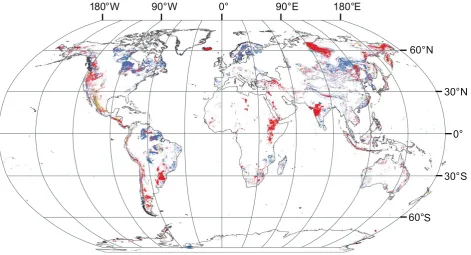
However in active or recently active volcanic environments, which occupy roughly 10%
34
of the global land surface (Figure 1, Wilkinson et al., 2009), tectonics may not be the
35
dominant driver of increases in relief [e.g.,Perkins et al., 2016a]. Instead, emplacement of
36
magma within the crust as intrusions or on the Earth’s surface through volcanic eruptions
37
may be primarily responsible for the changes in surface relief, and occur on temporal and
38
spatial scales that can deviate significantly from tectonic forcing [e.g., Hildreth, 2007;
39
Lee et al., 2015]. This type of topographic change is driven by deep mass influx from
40
the mantle, and consists of vertical surface motions relative to the geoid (rather than
41
exhumation of bedrock, England and Molnar, 1990). Most often, magmatism results
42
in the net increase of land elevation. Subsidence due to evacuating subsurface magma
43
reservoirs can also occur, such as during caldera collapse. Volcanic activity also strongly
44
affects geomorphic processes responsible for erosion [e.g., Montgomery et al., 1999; Gran
45
et al., 2011], sets substrate erodibility by creating new surface deposits [e.g., Jefferson
et al., 2010], and drives changes to Earth’s climate on a range of timescales [e.g., Self,
47
2006].
48
Volcanic impacts on surface evolution can be highly variable. For example, Mount
49
Mazama, a volcanic center in the Oregon Cascades arc, USA, has a ∼400 kyr history of
50
episodic magmatic landform construction including a central stratovolcano that reached
51
an elevation of ∼ 3700 m, with surrounding petrologically-related monogenetic edifices
52
and lava flows deposited over a ∼ 1000 km2
region of tectonic extension and faulting
53
[Bacon and Lanphere, 2006]. At 7.7 ka, the explosive Crater Lake caldera-forming eruption
54
destroyed the Mazama edifice, blanketing ∼ 106
km2
of western North America with
55
volcanic sediment [Sarna-Wojcicki et al., 1983]. Subsequently, post-caldera volcanism
56
and resurgent doming has partially refilled some of the subsided caldera floor towards the
57
regional surface. Thus the ‘uplift’ history of Mount Mazama is strongly non-monotonic.
58
The current landscape integrates post-Crater Lake geomorphic and volcanic activity with
59
topography that records prior interactions between magmatic uplift, erosion by rivers
60
and glaciers, and regional tectonics [Bacon and Lanphere, 2006; Robinson et al., 2017].
61
Although Mount Mazama is not representative of all volcanic centers, it is typical of most
62
arcs, ocean islands, continental rifts, hotspots, and large igneous provinces in the sense
63
that magmatism is a primary driver of landscape evolution.
64
Here we document the range of surface topography changes that are caused by extrusive
65
and intrusive magmatism, and then explore the role of landform shape on erodibility
66
across magmatic styles. This focus differs from studies of volcanic landforms focused on
67
volcanic processes [e.g.,Thouret, 1999;Kereszturi and N´emeth, 2012], specific geomorphic
68
impacts of volcanism [e.g., Waythomas, 2015], or the use of isolated magmatic landforms
as strain markers for tectonic processes [e.g.,Holm, 2001]. Instead we examine the generic
70
distribution of magmatic landform shapes, and how these shapes influence erosion. We
71
focus on landforms created by individual events where possible. Impacts of volcanism
72
on surface erodibility, while certainly important and variable between types of magmatic
73
activity, are not considered here.
74
In the example of Mount Mazama and at most long-lived volcanic centers, magmatic
75
construction is highly episodic, with large volume events occurring much less frequently
76
than small volume events. Eruption sequences generally follow a power-law
distribu-77
tion of volumes [Pyle, 2000] (commonly called a Magnitude-frequency distribution, where
78
‘Magnitude’ is usually defined by eruption mass, Newhall and Self, 1982). Wide-ranging
79
magmatic construction suggests variable large-scale geomorphic response of landscapes to
80
magmatic activity. Depending on the relative rates of production for magmatic landforms
81
compared to erosion, we expect distinct regimes of landscape evolution.
82
Construction of magmatic landforms is strongly influenced by pre-existing
topogra-83
phy [e.g., Dietterich and Cashman, 2014]. Because the most frequent magmatic
activ-84
ity generally generates the smallest volume landforms, landscapes can transition between
85
construction-dominated and erosion-dominated regimes if the rate and style of magmatism
86
or erosion varies. Feedbacks between eruption style and frequency, landform erodibility,
87
climate, and erosion should result in a complex interplay between dominant construction
88
and erosion at any given location. In some settings, erosion and redistribution of surface
89
topography may additionally affect the stress state of the crust to drive variations in the
90
frequency, Magnitude, and style of volcanic eruptions. This has been suggested for glacier
91
unloading and erosion [Jellinek et al., 2004; Sternai et al., 2016].
As we will demonstrate, magmatic landforms occur in the range of spatial scales where
93
fluvial incision influences bedrock erosion (∼>105
m2
). However, erosion from landsliding,
94
soil creep, and debris flows occurs in magmatic environments as well. In general, erosion
95
processes are often parameterized in terms of the influence of upstream drainage area Ad
96
and local surface slope S [Kirkby, 1971]. We will model erosion E as
97
E =kAmdSn, (1)
98
where k is a rock erodibility parameter, and the exponents m and n are semi-empirical
99
constants. Equation (1) when specified to fluvial erosion is the so-called stream power
100
law [e.g., Howard and Kerby, 1983], and extensive work has characterized the empirical
101
parameters [e.g., Whipple et al., 2000]. The exponent m characterizes fluvial drainage
102
basin shape, and is often found to be slightly larger than 0.5; n is often assumed to be
103
near unity [Harel et al., 2016]. Other erosion processes may be modeled with different
104
exponents m and n. For example, purely slope-dependent soil creep would implym = 0.
105
We use equation (1) as an index for erosion, recognizing that a combination of processes
106
operating at a range of scales often occur. Furthermore, by applying equation (1) at the
107
scale of each volcanic landform, we estimate maximum values of erosion potential.
108
In the following, we first categorize magmatic landforms according to emplacement
pro-109
cess, then compile planform areas A and landform heights h (total relief). Three classes
110
of magmatic activity are reviewed and examined in sequence: surface changes due to
in-111
trusions, surface changes from volcanic edifices built around vents, and surface changes
112
from volcanic eruption deposits that travel away from the vent. These classes
encom-113
pass most landforms associated with subaerial volcanism, with notable exceptions being
114
volcanic topography derived from interactions of ascending magma with ground water,
such as phreatic craters (maars) and rootless cones [e.g., Hamilton et al., 2010]. We also
116
neglect subglacial volcanic landforms such as tuyas, which form when lava erupts under
117
ice [e.g.,Komatsu et al., 2007]. After presenting landform data, assembled from published
118
databases and the literature, we then present a modeling framework with which to
eval-119
uate the influence of magmatic topography on erosion through specialization of equation
120
(1) to magmatic landform geometries. We end by discussing the role of emplacement rate
121
and landform shape on erosion at a landscape scale.
122
2. Surface relief changes from intrusions
Most magma delivered to the crust from the mantle ends up as intrusions rather than
123
eruptions on the Earth’s surface [White et al., 2006]. Although the surface expression
124
of intrusions (especially those at great depth) is often subtle and hard to distinguish
125
[Finnegan and Pritchard, 2009;Perkins et al., 2016b;Magee et al., 2017], crustal
thicken-126
ing from magma addition likely contributes a significant fraction of the background uplift
127
in volcanic provinces [e.g., Karlstrom et al., 2014a]. Surface relief changes from
intru-128
sions may or may not be accompanied by eruptive activity, and thus can be considered a
129
distinct type of landform.
130
The displacement of the Earth’s surface by active intrusions can be measured directly
131
using precise geodetic techniques such as repeat leveling, GPS networks or satellite-based
132
Interferometric Synthetic Aperture Radar (InSAR). Constraints on intrusion geometry
133
can also come from field studies of frozen and exhumed systems [e.g., Miller et al., 2009],
134
or geophysical survey methods including seismic reflection [e.g.,Magee et al., 2016],
resis-135
tivity or magnetotellurics [e.g.,Hill et al., 2009]. Estimations of uplift from such data are
136
challenging, and require assumptions about the relationships between intrusion
sions, depth of emplacement, and resulting changes in elevation at the surface. Frozen
138
intrusions suffer the additional uncertainty of whether the preserved structure resulted
139
from a single event or accumulated via multiple injections over extended time. Because
140
of this complexity, we briefly review models of uplift from magmatic intrusions before
141
presenting data.
142
2.1. Models for intrusions
Total uplift associated with an individual episode of intrusion depends primarily on its
143
depth, the change in intrusion volume and geometry, as well as the rheological properties
144
of the surrounding crust [Segall, 2010]. Estimates of maximum uplift magnitude in
re-145
sponse to intrusions come either from solving an elasticity or coupled fluid-solid mechanics
146
problem numerically, or by studying limiting cases that admit analytic solutions.
147
Analytic solutions exist for displacements caused by pressurization of rectangular,
spher-148
ical, ellipsoidal and ‘penny-shaped’ sources in a homogeneous elastic half space [Okada,
149
1985; Yang et al., 1988; Fialko et al., 2001]. Two simplified limits result from
intru-150
sions whose lateral dimension R (assuming axisymmetric intrusion geometry) is larger or
151
smaller than their depth below the surfaced. ForR/d >∼1, shallow intrusions are often
152
approximated as sills for which deformation is vertical elastic flexure of overlying rocks
153
[Pollard and Johnson, 1973]. For R/d ≪ 1, the so-called Mogi model [Mogi, 1958] of a
154
pressurized point source intrusion in an elastic half space applies.
155
These two limits provide useful intuition for interpreting observations of uplift by
mag-156
matic intrusions. Supporting Information section S3.1 and Figure S1 demonstrate that
157
flexural models imply maximum uplift of meters to 100s of meters, whereas ‘Mogi-type’
158
models predict maximum uplift in the range of ∼ 1 m (see also Galland and Scheibert,
2013). The range of observed active magmatic deformation magnitudes are well explained
160
by these models. However, significantly larger relief intrusion-derived magmatic landforms
161
imply a more protracted uplift history and likely require repeated intrusions to produce
162
observed landform shapes.
163
2.2. Landforms generated by intrusions
We compile two different types of intrusion observations to constrain surface
topogra-164
phy changes from subsurface magmatic activity: active deformation that can be related
165
directly to single intrusion events (InSAR data), and geologic observations of localized
166
surface uplift that may represent multiple intrusions over a range of timescales (laccoliths
167
and magmatic forced folds).
168
The first type of observation uses satellite-based InSAR methods to measure volcanic
169
and magmatic displacements on the scale of millimeters to centimeters with a repeat
in-170
terval of days to weeks [Pinel et al., 2014;Biggs et al., 2014;Biggs and Pritchard, 2017].
171
Unlike ground-based instrumentation, which can be installed at only a limited number
172
of points, InSAR allows measurements with a spatial resolution of tens of meters over
173
swath widths of up to 100s of km. This means that InSAR measurements capture the
174
shape and areal extent of active uplift, as well as displacement rates. We estimate
up-175
lift surface area from displacement signal radii provided in papers (or from figures where
176
necessary), assuming that the displacement fields are circular or elliptical (Supporting
In-177
formation). We include all signals attributed at least in part to magmatic intrusion (some
178
may include a hydrothermal contribution), but do not include the complex deformation
179
patterns associated with dike intrusion and fissure eruptions [e.g., Sigmundsson et al.,
180
2015]. Uncertainties in our estimated areas depend on instrument detection threshold
(and therefore instrumental parameters such as radar wavelength) as well as reporting
182
choices made by the authors of individual studies (e.g., satellite-line-of-sight rather than
183
true vertical displacement).
184
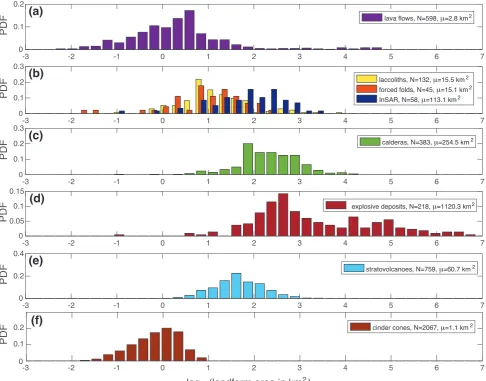
The areas of InSAR deformation associated with magma reservoirs vary over four orders
185
of magnitude from < 1 km2
to > 3000 km2
, with a mean value of 113 km2
.
Meter-186
scale or larger total uplift occurs for both gradual inflation (e.g., > 1.5 m since 2007
187
at Laguna del Maule, Chile, Le M´evel et al. [2015]) and episodic intrusion (e.g., ∼ 5 m
188
at Sierra Negra, Galapagos J´onsson [2009]). Episodes of uplift may be to some extent
189
reversed by subsequent subsidence, such as that caused by the removal of magma during
190
eruptions [e.g. Sigmundsson et al., 2010], the escape of gases, or the slow cooling and
191
contraction of intrusions [e.g. Caricchi et al., 2014]. As we cannot currently predict
192
which intrusions will eventually contribute to eruption (and corresponding co-eruptive
193
subsidence), we do not attempt to identify which episodes of uplift will be permanent.
194
Relating uplift to reservoir volume, shape and magma properties is further complicated by
195
bubble-rich magma, which dramatically increases magma compressibility and deceases the
196
surface deformation associated with intrusion of a particular volume [Rivalta and Segall,
197
2008]. Likewise, inelastic response of host rocks complicate inverting the surface signal
198
[Newman et al., 2001]. Both effects may be time-dependent [Segall, 2016]. Thus uplift
199
patterns detected by InSAR provide a snapshot of pressure changes over days to years
200
in part of a magmatic system, and are not uniquely related to total reservoir volume,
201
intrusion thickness, or material properties. InSAR measurements have also demonstrated
202
that in some circumstances magma can rise through the upper crust, or be removed
203
during eruption, without measurable deformation [Moran et al., 2006; Ebmeier et al.,
2013]. In general, elastic models of maximum uplift such as described in the Supporting
205
Information are consistent with uplift from episodes of intrusion measured by InSAR
206
(Figure 2 and Figures 3b-4b blue bars). Estimation of intrusion depth achieved through
207
modeling of InSAR data (Figure 2c, with black curve our power law fit) constrains the
208
range of intrusion depths that may have a surface influence generally.
209
In contrast to the event-based InSAR measurements, exhumed intrusive landforms such
210
as laccoliths, where shallow sills flex overlying rocks upward [e.g., Jackson and Pollard,
211
1988], provide geologic constraints on total possible uplift associated with older magmatic
212
intrusions. We use the surface area of laccolith exposure to describe their areal extent,
213
and the maximum thickness of the intrusion as a proxy for total surface uplift during
214
its development. The global compilation by Corry [1988] provides a sense of the range
215
of landforms seen, and the associated uncertainties in geometries. Corry [1988] suggests
216
these intrusions have thicknesses and topographic relief reaching several km (Figure 4b,
217
yellow bars) over planform areas ranging between<1−1000skm2
(Figure 3b yellow bars).
218
Erosional exhumation is common with this data, and we assume that laccolith thickness
219
is approximately the total relief. However, the database of Corry [1988] also includes
220
thickness data from geophysical surveys, and landforms reflecting protracted intrusive
221
processes that can not be consistently corrected for surface uplift solely caused by flexural
222
laccolith intrusion. The data point withh= 9500 m from this dataset, for example, comes
223
from the deeply exhumed Kiglapait layered mafic intrusion on Labrador and thickness is
224
estimated based on a gravity survey [Stephenson and Thomas, 1979] that may not relate
225
in a simple way to surface uplift. We retain these data for completeness – without redoing
the literature survey of Corry [1988] we cannot justify using some points and not others
227
– but suspect that h is an upper bound for surface uplift associated with laccoliths.
228
Laccolith heights in general are larger by an order of magnitude than estimates based
229
on flexural models (Supporting Information section S3.1), likely requiring repeated
in-230
trusions and plastic flow to generate the observed landforms. Field studies are
con-231
sistent with this assessment, suggesting in some cases repeated injections and inflation
232
over many thousands of years [Gilbert, 1877; Jackson and Pollard, 1988; Horsman et al.,
233
2005, 2009]. Numerical modeling of exposed laccoliths estimates construction rates of
234
∼ 1 m/yr [Saint-Blanquat et al., 2006]. These rates are generally consistent with large
235
uplift rates observed from InSAR (Figure 2a) and rapid co-eruptive intrusions observed
236
via satellite [Castro et al., 2016], although the total uplift magnitude of InSAR-observed
237
deformation is smaller.
238
Magmatic forced folds, which involve dome-like uplift but also characteristic faulting
239
patterns initiated by intrusions [e.g., van Wyk de Vries et al., 2014], provide additional
240
geologic constraints. Although they form a continuum with laccoliths (Corry [1988]
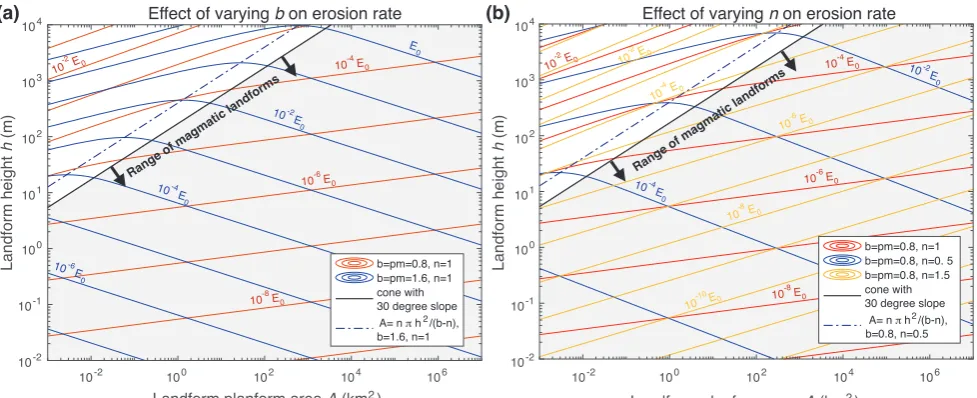
de-241
scribes fault-bounded ‘punched’ laccoliths and layered ‘Christmas tree’ laccoliths),
differ-242
ences in force balance (e.g., contribution of body forces) and material response (faulting)
243
results in a diversity of surface expressions that partially justify different nomenclature.
244
We use shallow intrusion data from the forced fold dataset ofMagee et al. [2017],
includ-245
ing strata-concordant sills, saucer-shaped sills, and hybrid sill-laccoliths. Large mafic sills
246
from this database were not included, because surface deformation (i.e., fold amplitude)
247
was not explicitly apparent. Magmatic forced folds exhibit thicknesses from 10s to 100s
248
of meters, and planform areas of ∼0.01−500 km2
(Figures 3b and 4b, red bars).
2.3. Subsidence from calderas
The presence of calderas is direct evidence for the existence of large quantities of melt at
250
shallow depths (at least transiently) as the reservoirs that feed large explosive eruptions.
251
Their dimensions are often used as a proxy for magma chamber horizontal cross-sectional
252
area [Karlstrom et al., 2012], and thus we classify them as intrusion-related magmatic
253
topography. Mafic calderas are not uncommon [Geyer and Marti, 2008], but most calderas
254
are associated with large volume eruptions that generally have more silicic compositions.
255
We consider calderas as representing a different class of landscape perturbation than
256
laccoliths and small shallow intrusions, which are not always associated with eruption.
257
Larger volumes of magma generate larger planform area calderas, compiled in Figure 3c
258
from the Collapse Caldera Database (CCDB) [Geyer and Marti, 2008] global dataset.
259
The CCDB idealizes caldera planform areas as ellipses.
260
As discussed in Section 1 for the case of Mount Mazama [Bacon and Lanphere, 2006],
261
calderas are often accompanied by a protracted prior history of volcanism and surface
262
elevation increase that may extend 100s of kyr, as well as post-caldera resurgent doming
263
and volcanism. So, while the caldera topographic change is instantaneous compared to
264
these timescales and uniformly negative over the caldera area, the integrated magmatic
265
history usually involves extensive magmatic construction. Subsidence magnitudes are in
266
the range of 100s-1000s of meters [Geyer and Marti, 2008]. However, resulting topographic
267
lows are often filled with eruptive deposits, and often exhibit post-eruption resurgence
268
domes or eruptive behavior. We therefore do not include calderas in our landform height
269
compilation, but do include the range of subsidence height values in our data synthesis
270
for completeness. Resurgent domes often involve significant topographic gain (100-1000s
m total height at∼1 cm/yr rates, e.g., Phillips et al., 2007), and they are a distinct type
272
of magmatic landform genetically related to caldera-forming systems.
273
3. Surface relief changes from volcanic eruptions
Eruptions occur on short timescales (minutes to 10s of years), evacuating subsurface
274
magma reservoirs and increasing the elevation of the land surface through deposition of
275
lava (in the case of effusive eruptions) or tephra and pyroclastic density current
emplace-276
ment (in the case of explosive eruptions). Eruptions sourced shallowly in the crust to some
277
extent redistribute geomorphic potential for erosion from magma chambers, because
sub-278
surface chambers deflate (or implode) syneruptively. However, deep chambers may not
279
generate surface relief at all if magma intrusion involves mass exchange within the crust,
280
and the presence of bubbles complicates the relationship between surface deformation
281
and volume change by making shallowly stored magma highly compressible [Rivalta and
282
Segall, 2008]. There is a great diversity in eruption style, volume, and frequency,
at-283
tributable in large part to variable magma compositions and ascent rates [Gonnermann
284
and Manga, 2013]. Products of even relatively small volume effusive and explosive
erup-285
tions are known to travel great distances, and so can have an extended region of influence.
286
Episodes of repeated eruptions are also known to construct magmatic landscapes that are
287
kilometers thick, in the case of large igneous provinces [e.g., Reidel et al., 2013] or ocean
288
islands [Clague and Sherrod, 2014].
289
3.1. Effusive eruptions
Effusive eruptions span the entire range of magma compositions. Mafic lava flows are
290
the most frequently occurring effusive eruptions and are also the largest; mafic lava flows
in flood basalt provinces are known to travel 100s of km [Reidel et al., 2013]. Controls
292
on subaerial lava flow thickness include rheology, the style of flow emplacement, eruption
293
volume, and substrate characteristics. Pahoehoe flows are emplaced as inflating sheets
294
that often maintain approximately constant thickness throughout their length (individual
295
lobes are rarely thicker than∼10 m), while a’a’ flows are more irregular [Griffiths, 2000].
296
Lava flow emplacement is strongly affected by pre-existing topography [Dietterich and
297
Cashman, 2014], exploiting pre-existing river channels [e.g., Branca, 2003] with dramatic
298
short-term [Crow et al., 2008] and long-term [Deligne et al., 2013] hydrologic impacts.
299
Dominantly basaltic landscapes such as Kilauea, Hawaii, USA, are relatively smooth on
300
scales greater than 10s meters, punctuated by eruptive cones, tumuli (surface flow
break-301
outs), pressure ridges, lava channels and lava tubes. These roughness features are formed
302
during flow emplacement and cooling. Lava flows form massive deposits that armor the
303
surface, and are often exposed in negative relief as surrounding higher elevation landforms
304
erode more quickly [e.g., King et al., 2007]. Lava flows are also well known to dam or
305
redirect pre-existing rivers [Crow et al., 2008; Ely et al., 2012], contributing to fluvial
306
drainage network reorganization.
307
A global compilation of lava flow areas does not exist, so we compile lava flow data from
308
the primary literature (Supporting Information). We include both single flows and flow
309
episodes (multiple flows with minimal time gaps and often similar compositions). Such
310
grouping reflects ambiguity in flow mapping as well as lack of vertical exposure. The
311
distribution of flow areas in Figure 3a reflects the variability in effusive eruptions, spanning
312
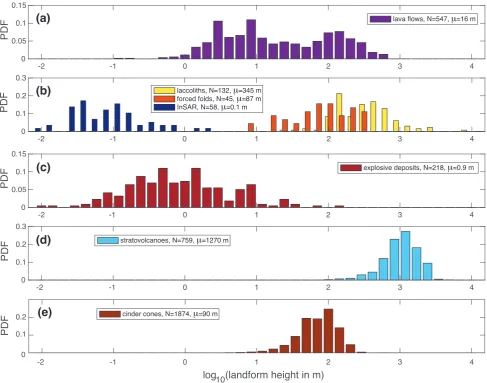
small flows associated with silicic eruptions and minor mafic episodes to flood basalts. The
313
distribution of flow thicknesses in Figure 4a is bimodal, reflecting the grouping of single
flows and flow episodes. For our purposes, this distribution serves to illustrate the range
315
of landform construction that is ‘short lived’ compared to timescales for erosion.
316
3.2. Explosive eruptions
Explosive eruptions are generally more widely dispersed than their effusive counterparts,
317
depositing fragmented magma as energetic pyroclastic density currents that can
simulta-318
neously erode the substrate and deposit material [e.g., Dufek, 2016] and ash clouds that
319
travel through the atmosphere 100s-1000s of km depending on the height of the eruption
320
plume before deposition [e.g., Jensen et al., 2014]. As with effusive eruptions, the vast
321
majority of explosive eruptions are small volume and thus represent minor perturbations
322
to surrounding landscapes. However, the largest explosive eruptions create continental
323
scale deposits. Thickness of the deposits can reach 100s of meters near the vent
[Wil-324
son, 1991], generally thinning dramatically as a function of distance to∼millimeter-range
325
thicknesses. Explosive eruptions typically last hours to days [Wilson and Hildreth, 1997].
326
Explosive eruption deposits are sometimes hot enough to weld together, forming tuffs
327
that armor the landscape and continue to flow (for example, rheomorphic explosive
de-328
posits flow after deposition, Andrews and Branney, 2010). Explosive deposits also may
329
include a large volume of unconsolidated tephra. These deposits enhance erosion rates
330
both proximally to the vent and downstream (at least transiently), and hence may have a
331
large erosional footprint [Montgomery et al., 1999]. Explosive eruptions in glaciated
land-332
scapes often mobilize lahars that represent a significant erosive agent [Waythomas, 2015],
333
and may induce sediment damming and outburst floods [Waythomas, 2001]. The largest
334
explosive eruptions are also known to perturb climate globally due to large volumes of
335
magmatic volatiles erupted (dominantly SO2 and CO2, Self, 2006).
In light of such large impacts on erosion rates and the dramatic thickness variations of
337
deposits, it is perhaps not surprising that a global distribution of explosive eruption areas
338
is difficult to assemble. A preliminary planform area compilation comes from the global
339
volume database on large explosive eruptions (LaMEVE, Brown et al., 2014, Figure 3d).
340
We use primary data compiled byMahoney et al.[2016], which include the maximum area
341
and thickness in the near-vent region of each eruption. Because these data do not include
342
eruptions smaller than those for which the eruption catalog is demonstrably statistically
343
incomplete, we supplement LaMEVE with a compilation from the primary literature
344
(Supporting Information) that includes eruptions from Hawaii, Iceland, Mount St. Helens,
345
and New Zealand. This compilation is certainly incomplete, especially for smaller volume
346
eruptions. Explosive eruptions span a much larger range of areas than other individual
347
volcanic events considered here, affecting>2 orders of magnitude larger areas than other
348
phenomena (Figure 3d). Explosive deposit thicknesses are generally small compared to
349
other volcanic events (Figure 4c).
350
4. Surface changes from volcanic edifices
Although localized, volcanic edifices are often the highest relief landforms in volcanic
351
provinces and thus have widespread geomorphic influence. Edifices form at the spatial
352
loci of eruptions - near-vent build ups of eruptive deposits and intrusions that may be
353
short (on the order of years for monogenetic eruptions) or long (100s of kyr for polygenetic
354
stratovolcanoes and shield volcanoes) lived. Polygenetic edifices are often constructed of
355
both effusive and explosive deposits - a testament to the diversity of volcanic processes
356
that can occur at a single location. Intrusions generally comprise a significant component
357
of volcanic edifice volume at stratovolcanoes [Annen et al., 2001] as well as basaltic centers
[Walker, 1986]. Intrusions are also known to promote edifice slope instability and
mass-359
wasting [van Wyk de Vries et al., 2014].
360
The spatial distribution of edifices is complex, but in a given magmatic province it is not
361
uncommon to find hundreds or even thousands of these landforms [e.g., Hildreth, 2007]
362
that span the full range of magmatic styles. Long-lived volcanic edifices in arcs tend to
363
parallel the convergent plate boundary and mirror the large-scale spatial distribution of
364
mantle wedge melt. Arc polygenetic stratovolcanoes are present globally with irregular
365
spacing at intervals of ∼ 30−60 km [de Bremond d’Ars et al., 1995]. It is not known
366
what governs the spacing of such volcanic centers, but deep spatial variability in magma
367
supply as well as stress interactions within the crustal magma transport system [Karlstrom
368
et al., 2009] or from surface loading due to the edifices themselves [Pinel and Jaupart,
369
2000] are viable candidates. Clustering of monogenetic edifices through time at some
370
volcanic centers suggests control by crustal and surface loads [Karlstrom et al., 2014b],
371
although spatial patterns of monogenetic vents in other regions are indistinguishable from
372
a random distribution [Connor and Hill, 1995].
373
Volcanic edifice morphologies are highly variable [Kereszturi and N´emeth, 2012;de Silva
374
and Lindsay, 2015]. They tend to be easily recognizable landforms, as is evidenced by
375
the large number of edifices discussed in the literature (our compilations contain nearly
376
ten times more edifices compared to other magmatic landforms). However they lack a
377
self-consistent shape, as protracted or spatially distributed eruption and erosion histories
378
make determination of edifice boundaries difficult [Bohnenstiehl et al., 2012; Euillades
379
et al., 2013; Grosse et al., 2014]. This is problematic for defining the area and relief
380
metrics of interest, and further complicated by limited-resolution digital elevation
els (DEMs) and background topography that may be a complex distribution of prior
382
magmatic landforms.
383
We focus on two classes of landform that represent end-members in the spectrum of
384
volcanic edifices. The database ofGrosse et al.[2014] documents the range of polygenetic
385
stratovolcano edifice sizes that are observed globally. It focuses on large-scale (> 2 km
386
basal width) composite and complex (grouped edifice) Holocene volcanoes from the Global
387
Volcanism Program database, using a slope-based algorithm [Euillades et al., 2013] to
388
automatically extract edifices from DEM data. Planform area and topographic relief
389
PDFs from this database are smooth and unimodal, with areas in the range of 1−1000
390
km2
and heights of 100s to 1000s of meters (Figures 3e and 4d).
391
Cinder cone fields are common in volcanic provinces (particularly those featuring
domi-392
nantly mafic compositions), and represent a short-duration, often monogenetic, end
mem-393
ber of volcanic edifice construction [e.g.,Wood, 1980;Luhr and Simkin, 1993]. No available
394
global compilation of cinder cone shapes exists, so we compile data from the literature.
395
Our compilation spans a variety of volcanic settings, including arcs, rifts, continental and
396
oceanic hotspots. We include data from the Trans-Mexican Volcanic Field [P´erez-L´opez
397
et al., 2011]; the Cima Volcanic Field [Dohrenwend et al., 1986]; Mauna Kea, Mt. Etna,
398
Nunivak Island, and the San Francisco Volcanic Field [Settle, 1979]; Lunar Crater Volcanic
399
Field [Scott and Trask, 1971]; Guatamala and El Salvador [Bemis et al., 2011]; the Tepic
400
rift (Mexico), Ethiopian rift, and Canary Islands [Tibaldi, 1995]; Medicine Lake, Newberry
401
Volcano, and the Springerville Volcanic Field [McGuire et al., 2014]. We compile
pub-402
lished data from the authors when available, and otherwise digitize geometric data from
403
figures using the WebPlotDigitizer tool (http://arohatgi.info/WebPlotDigitizer/). Cinder
cones are generally simply shaped landforms: quasi-conical structures often topped by
405
conspicuous craters composed of (often poorly consolidated) explosive deposits, spatter,
406
and intrusions associated with feeder dikes [e.g., Tadini et al., 2014] that often give rise
407
to multiple aligned cones when they breach the Earth’s surface. Cinder cones are
as-408
sociated with smaller volume volcanic eruptions, and are ubiquitous features of volcanic
409
landscapes. Cinder cone areas range between 0.01−10 km2
(Figure 3f) with heights of
410
10s to 100s of meters (Figure 4e).
411
5. Geometric controls on erodibility of volcanic landforms
Differential elevations at the Earth’s surface drive erosion according to processes that
412
depend on precipitation, temperature, surface slope, contributing drainage area, and
sur-413
face erodibility. In low-relief landscapes, drainage areas less than ∼ 103
−104
m2
imply
414
erosion dominantly from soil creep [e.g.,Gilbert, 1909]. Landsliding, earthflows, and
chan-415
nelization via debris flows generally occur at steeper slopes [Stock and Dietrich, 2003]. For
416
drainage areas of ∼105
m2
and above, fluvial channels can dominate erosion rate
[Mont-417
gomery, 2001]. High elevations with low temperatures experience erosion by ice [Egholm
418
et al., 2009] and wind.
419
With some exceptions, volcanic landforms develop planform areas that overlap with the
420
fluvial range of drainage areas (and glacial range at high elevations). Of course, planform
421
area need not scale with drainage area, and a number of erosion mechanisms depend
422
more on thresholds for slope and time-dependent weathering than drainage area [e.g.,
423
Montgomery and Dietrich, 1994]. Without imposing biases associated with a particular
424
erosion mechanism, the erosion potential of volcanic landforms as a function of their
drainage area and slope can to a large extent be assessed by comparing the planform area
426
of the landform with its height for different classes of magmatism.
427
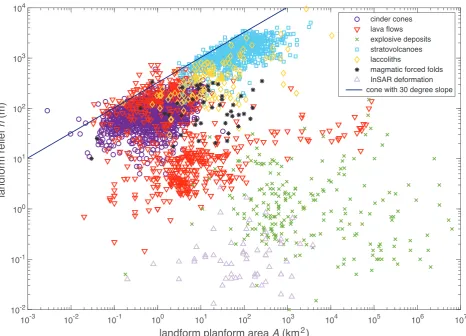
Figure 5 plots all of the planform area and height data compiled in sections 2-4. There
428
are two populations of landforms, one in which heights scale systematically with their
429
planform areas as expected if landform heights are limited by a critical slope (e.g., an
430
angle of repose), and one in which heights remain small but areas span a large range.
431
Although most magmatic landforms are not unconsolidated piles of granular material
432
for which the angle of repose is well-defined, the blue curve (for a reference 30 degree
433
sloped cone) roughly bounds landform shape. Eruption deposits (lava flows and explosive
434
deposits) are generally much larger in their planform area than height, although for lava
435
flows we again see two populations – single events and flow sequences which construct
436
much higher topography – present in the dataset.
437
Interpretations of planform area compared to landform height can be taken further if
438
an erosion law is assumed and landform geometry defined. For volcanic landforms, the
439
appropriate parameterization of equation (1) that would define the role of slope, drainage
440
area, or the exponents m and n is not well known. Erosion that depends primarily on
441
local slope thresholds as for debris flows [Stock and Dietrich, 2003] or rock avalanches
442
would imply m ≈ 0. However, examples of erosion controlled by upslope drainage area
443
on volcanic landforms are also plentiful [Seidl et al., 1994; Ferrier et al., 2013; Jefferson
444
et al., 2014; Waythomas, 2015].
445
Controls on the spatial structure of drainages in magmatic provinces may differ from
446
other tectonic environments. For example, channel network geometry that determines
447
Hack’s Law scaling in basaltic landscapes may be fundamentally controlled by the
tribution of lava flows [Seidl et al., 1994; Ely et al., 2012; Sweeney and Roering, 2017]
449
rather than self-organizing fluvial erosion. Slope-drainage area relations inherent to
vol-450
canic topography can be assessed based on the constructional process of interest. For
451
example, lava flows as approximated by axisymmetric viscous gravity currents on a flat
452
substrate exhibit surface slope that varies with planform area as S ∼ A−1/6 [Huppert,
453
1982] (this does not account for some important effects such as the apparent yield stress
454
of flowing magma, Wilson and Head, 1983). And volcanic edifice growth is often
ideal-455
ized as a self-similar ‘phreatic surface’ resulting from Darcy flow of magma onto the land
456
surface [Baratoux et al., 2009]. To further complicate matters, dominant erosional
pro-457
cesses probably evolve in time, as permeability reduction [Jefferson et al., 2010], chemical
458
weathering [Murphy et al., 2016], and compaction [e.g., Hildreth, 1983] potentially change
459
the hydraulic properties of the landform.
460
Given the large range of planform areas and thicknesses in Figure 5, it is an interesting
461
exercise to ask how an erosion law such as equation (1) varies with landform geometry
462
alone. In the spirit of other simple geometric modeling in volcanology [e.g., DePaolo and
463
Stolper, 1996], we make the assumption that all magmatic landforms are similar to cones
464
with planform areaAand heighth. As discussed above, this is a poor assumption for some
465
classes of magmatic landforms. Indeed, knowledge of constructional processes provides
466
the template for evaluating erosion. However, all magmatic landforms have a locus of
467
construction - for example a vent or feeder system - from which topography systematically
468
varies laterally. Although construction is commonly not axisymmetric around a locus (for
469
example eruptions onto a slope or into a background wind field), this geometric constraint
470
alone has important implications for erosion.
For cone-shaped landforms, the average slope is S = hqAπ and a scale for maximum
472
channel length is the hypotenuse of the coneL=qA/π+h2. In practice we expectL to
473
overestimate channel length somewhat as unchannelized steepland regions will exist above
474
the channel head. Assuming that stream drainage areaAd (different fromA) scales with
475
maximum channel length on the landform, we have Ad =kdLp, where kd is an empirical
476
constant [Hack, 1957].
477
An estimate for the erosion rate of a conical volcanic landform from equation (1) then
478
becomes
479
E =c
A
π +h
2
b/2
h √
A
!n
, (2)
480
where b=pm, and c=πn/2 kkm
d.
481
For solely slope-dependent erosionb≈0 and equation (2) becomesE =πn/2
k(h/√A)n,
482
which increases as landforms get taller and decreases as landforms get more areally
ex-483
tensive. Rapid magmatic uplift in this case might additionally trigger slope-dependent
484
thresholds that would further enhance erosion. For fluvial erosion operating according to
485
the stream power law, it is commonly assumed thatm ∼0.5, n∼1 in equation (1)
[Whip-486
ple and Tucker, 1999;Lague, 2014], withp∼1.6−1.9 [Whipple and Tucker, 1999]. Ferrier
487
et al. [2013] found m ∼ 0.59 for channels cutting into basaltic lava flows on the island
488
of Kauai. However, other parameter values have also been found. For example Crosby
489
and Whipple [2006] found m > 1 for a catchment in New Zealand containing many
wa-490
terfalls (assumed to be knickpoints propagating upstream), whileSeidl et al.[1994] found
491
b ∼1.1−2.1 for channels incising basaltic lava flows on the Hawaiian islands. The slope
492
exponent n is commonly assumed to be unity, although it has been observed to vary on
493
Earth [e.g., Harel et al., 2016].
The dependence of erosion rate on height for a conical landform with a constant planform
495
area A can be determined by differentiating equation (2),
496
∂E
∂h =
c h(A+πh2)
h √
A
!n
h2
+A
π
b/2
An+πh2
(b+n). (3)
497
This equation suggests that erosion rate goes up as h increases, regardless ofb and n.
498
The dependence of erosion rate on planform area is more complicated, due to the
pres-499
ence ofAin the numerator ofAdand denominator ofSwhen equation (1) is parameterized
500
for conical landforms. We find that
501
∂E
∂A =−
c hn 2πb/2A1+n/2
A+πh2b/2−1
A(n−b) +nπh2
. (4)
502
If b > n, ∂E/∂A is positive for A < πnh2
/(b−n) and negative for larger A, defining
503
parameter regions in which either drainage area and slope terms in equation (2) dominate
504
as planform area increases. If b ≤ n, ∂E/∂A is uniformly negative so that erosion rate
505
always decreases with increasing planform area, although ∂E/∂A exhibits an inflection
506
around the same point as for b > n.
507
Both regimes are illustrated in Figure 6, plotting contours of constant erosion rate (with
508
constant c = 6.5×10⁻⁴ taken to equal the stream power erodibility constant found by
509
fitting channel profiles from a basaltic landscape, Seidl et al., 1994) as a function of A
510
and h. The two panels separate the effects of varying exponents b and n. Gray shading
511
reflects the range of volcanic landforms from our database (Figure 5). Red curves are
512
for the conventional choices of m = 0.5, n = 1, and p = 1.6 [Whipple and Tucker, 1999;
513
Perron et al., 2008]. These choices result in uniformly decreasing erosion rate of landforms
514
with increasing planform areas. However, little drainage network scaling data specific to
515
volcanic landforms has been assembled. And detailed assessment of geometric form likely
must account for mechanics of landform construction, which is outside the scope of this
517
work.
518
Volcanic landforms are not generally observed above the curve A = πnh2
/(b−n) (a
519
30 degree angle of repose falls below this line, Figure 6). This likely reflects the greater
520
gravitational potential energy costs of adding height versus area during construction of
521
small landforms. Stratovolcanoes, laccoliths, and cinder cones all uniformly approach this
522
limit, consistent both with their localized emplacement and a prolonged history dominated
523
by construction versus erosion.
524
Observation of a second population of landforms in Figure 5, volcanic deposits with large
525
planform areas Aand small thickness h, suggests that slope and drainage area exponents
526
in equation (2) satisfyb ≤n(such as do the ‘conventional’ values ofp= 1.6, m/n= 0.5) so
527
that erosion rate decreases with increasing planform area in equation (4). This reduction
528
in relief as area grows increases the preservation potential of areally extensive magmatism:
529
if landscape erosion rate is constant, large magmatic landforms would be preferentially
530
preserved relative to small ones. Although erodibility and climate certainly do vary in
531
time and space, the observed distributions of magmatic landforms are reinforced by basic
532
geometric dependencies of typical erosion laws.
533
6. Discussion
The landform data presented in Sections 2-4 are expressed as empirical probability
534
density functions (PDFs) of landform area and height (Figures 3-4), representing a range
535
of volcanic processes. Summarized by the boxplots in Figure 7, we see a remarkable range
536
in both planform area (>10 orders of magnitude) and landform thickness (>6 orders of
537
magnitude) that exhibits systematic variation between styles of magmatic construction.
Landform PDFs also describe the likelihood for occurrence of a given landform height as
539
a function of area affected by intrusions, volcanic edifices built around vents, and volcanic
540
eruption deposits that travel away from the vent. Each of these processes itself is highly
541
episodic. Although they all represent the later stages of magma transfer from the mantle,
542
there are different physical controls on the occurrence of each class of volcanism that may
543
vary with tectonic setting [Wilkinson et al., 2009]. It is not the goal of this work to assess
544
these physical controls, however, the distributions themselves provide a tool for comparing
545
classes of magmatic events.
546
It is important to note that our compilation is hardly comprehensive, and may contain
547
some systematic biases. For example, small volume landforms are often super-imposed on
548
a background slope, whose influence on areas and topographic relief are not assessed here.
549
In any given long-lived volcanic province, thousands of vents and individual eruptions
550
are generally produced per million years [Hildreth, 2007], dwarfing the present dataset.
551
Burial and incomplete preservation limit the completeness to which the dynamic evolution
552
of volcanism may be characterized by surface landforms alone. We have attempted to
553
assemble a representative compilation that spans the range of observed areas and landform
554
heights, with enough samples to define the structure of the underlying distributions. With
555
such distributions we can begin to ask process-oriented questions.
556
For example, the PDF for laccoliths exhibits a larger mean area than that of lava flows.
557
Both of these features dominantly represent the mafic end of magma compositions, and
558
a quantitative comparison of the PDFs is a crude proxy for the degree to which magma
559
is stored in the shallow crust versus erupted. The ratio of median laccolith planform area
560
to median lava flow area is 6.6, the ratio of median laccolith thickness to median lava
flow thickness is 20, and the ratio of median laccolith volume (area times thickness) to
562
median lava flow volume is 91.3. This range is consistent with global intrusion/extrusion
563
ratio estimates of ∼ 2−100 based on petrology, stratigraphic mapping and geophysical
564
techniques [White et al., 2006].
565
Likewise, we may seek to interpret the systematic differences in area and inferred uplift
566
between intrusions measured with InSAR and geologic measurements of exposed
laccol-567
iths or forced folds. Our use of laccolith surfaces exposed by erosion to describe area likely
568
underestimates the true planform area of past uplift, as there is no geological record of the
569
flexural deformation of overlying rocks. This is reflected in Figure 3b, where the
distribu-570
tion of laccolith areas is smaller than surface deformation observed from InSAR. Another
571
possible reason for the smaller average uplift areas inferred from laccolith measurements
572
is that such shallow processes represent a small subset of the full InSAR dataset, which
573
includes larger volume changes at greater depths; for example, the growth of mid-crustal
574
magma bodies in the Central Andes [e.g. Pritchard and Simons, 2004; Ruch et al., 2008].
575
6.1. Competition between emplacement rate and erosion rate
As discussed in Section 1, the episodic nature of magmatism is inextricably linked to
576
magmatic landform construction because of the relationship between eruption frequency
577
and volume of magmatic mass emplaced. Explosive eruptions are the only class of
mag-578
matism for which this relationship has been investigated deeply, so we will use these events
579
as an example. The size and significant of an explosive eruption is typically quantified
580
using the mass erupted, which is used to define eruption MagnitudeM [Newhall and Self,
581
1982; Pyle, 2000; Mason et al., 2004] as
582
M = log10(mass erupted in kg)−7. (5)
Sequences of eruptions typically exhibit a power law relationship between frequency of
584
occurrence and magnitude from equation (5), and global magnitude-frequency relations
585
have been assessed by a number of workers from the LaMEVE explosive eruption database
586
used here. Recent maximum likelihood estimates for the return period of eruptions greater
587
than M = 4 from the last 100 kyr [Rougier et al., 2018] show roughly a 10 fold increase
588
in eruption recurrence rate for every 10 fold decrease in erupted mass (decrease by 1
589
of eruption Magnitude). Eruptions at all Magnitudes are likely under-represented in
590
the global catalog, arising from incomplete reporting, erosion, and burial by more recent
591
eruptions [Brown et al., 2014]. And for very large eruptions, the small number of recorded
592
events makes recurrence rates more uncertain. Rougier et al. [2018] estimate the return
593
period of M = 8 eruptions at 17 kyr with 95% confidence limits of +48 and−5.2 kyr, a
594
decrease from prior calculations [Mason et al., 2004; Sheldrake and Caricchi, 2017].
595
Considering global lithologic maps of volcanic rock outcrops, Wilkinson et al. [2009]
596
estimate that one third of the long-term decrease in the area of volcanic rocks at the
597
Earth’s surface on Myr timescales or longer is due to erosion while two thirds is due
598
to burial by younger deposits. We hypothesized in section 5 that the erosion rate of
599
magmatic landforms is set by their geometry (Figure 6). How does this scale to the
600
landscape (or global) scale? Does the preservation of magmatic events depend on their
601
style and Magnitude/frequency relationship?
602
There are several challenges that must be overcome to test these ideas. First, the
recur-603
rence rate of extrusive magmatism varies with its style [Marzocchi and Zaccarelli, 2006].
604
And there are few constraints on Magnitude-frequency relations for intrusive magmatism,
605
although mechanical considerations based on observed plutonic body sizes [Karlstrom
et al., 2017] suggest phenomenological differences in the emplacement and growth rates
607
of intrusions of different sizes. These are complications we cannot address with the
cur-608
rent dataset. A second obstacle is the lack of data on erodibility and more generally the
609
functional form of erosion laws appropriate for volcanic landforms. We expect that the
610
erodibility constant c in equation (2) will depend on style of magmatism as well as time
611
since deposition [Jefferson et al., 2010] and precipitation [Ferrier et al., 2013].
612
Still, since both planform area and height should influence magmatic landform erosion
613
(Section 5), we can make progress towards connecting construction to erosion by
examin-614
ing the influence of geometry on predicted erosion rates from equation (2). We normalize
615
erosion rate by the empirical constantcthat contains substrate erodibilitykfrom equation
616
(1) as well as the Hack’s law constantkd, removing the effects of climate and erodibility.
617
In the spirit of simplicity, we choose conventional exponents b = 0.8 and n = 1 for the
618
stream power fluvial erosion law as in Figure 6.
619
This normalized erosion rate is plotted in Figure 8 against landform mass ρAh/3
(as-620
suming a constant density of deposits ρ = 2700 kg m−3 with cone-like geometry), and
621
the corresponding Magnitude from equation (5). We fit the return periods calculated by
622
Rougier et al. [2018] to a power law, from which we estimate the return period in years
623
of explosive eruptions Tp as a function of Magnitude
624
log10(Tp) = (1.03±0.05)M −(4.07±0.30). (6)
625
This relation is used to produce the bottom blue axis, an estimate of the recurrence
626
rates (and hence landscape construction rates) for one class of magmatism (explosive
627
eruptions). Of course, the assumption of constant landform density is not uniformly valid,
628
and Magnitude-frequency relations derived for explosive eruptions may not extend to all
styles of magmatism. For example, large-volume stratovolcanoes integrate multiple events
630
over 100s of kyr [Hildreth, 2007] whereas eruption deposits of similar mass from a large
631
volume explosive eruption may represent a single eruptive episode. InSAR observations
632
of uplift are excluded from this analysis, since the relationship between the volume of the
633
uplifted area and the volume of the causal intrusion is complex.
634
Figure 8 compares two geometrical representations of construction and erosion – deposit
635
mass and erodibility – that motivate a mechanistic interpretation of Aand hfor different
636
magmatic styles. Is such information sufficient to infer process regimes of volcanic
land-637
scape evolution? We argue that geometry, along with some consideration of magmatic
638
style, can explain some first order trends in the dataset.
639
For example, the correlation between volume and erodibility exhibited by
stratovolca-640
noes, cinder cones, and intrusions in Figure 8 is consistent with localized construction.
641
Such landforms get more erodible as they grow in height and area (equations 3 and 4).
642
The largest volume landforms reflect repeated construction events over extended time.
643
However, departure from this geometrical trend for large volume single events (lava flows
644
and explosive deposits) is evidence of something more complex (Figure 8).
645
Large eruptions (both effusive and explosive) deposit over continental scales, flattening
646
topography. Very large explosive eruptions (> 500 km3
erupted volumes, termed “super
647
eruptions”) have not occurred in the historical record but have been documented to fill in
648
landscapes, redirecting rivers and reorganizing drainage patterns [Wilson, 1991;Manville,
649
2002]. Large effusive flood basalt eruptions also cover massive areas, although some
land-650
scapes remember pre-existing drainage patterns long after flood basalt eruptions. This
651
is the case for the ∼ 16 Ma Columbia River Basalts, USA [Reidel et al., 1989]. Single
eruptive events also affect global and local climate transiently, and hence affect
precipita-653
tion patterns [Self, 2006]. On longer timescales, weathering of these landforms has been
654
argued to influence the pCO2 forcing of global climate [e.g., Dessert et al., 2001]. Figure
655
8 suggests that long-term erosional response is influenced by landform geometry: effusive
656
and explosive eruptive landforms get flatter as they get bigger even if landform heights
657
increase slightly with volume, so overall slopes go down. As demonstrated by Figure 6,
658
whether this translates into increased or decreased erodibility depends on the exponents
659
b and n as well as the rate of landform height increase with area. The preservation of
660
large eruptive deposits (particularly lava flows) suggests that the shape of these landforms
661
promotes longevity by decreasing erodibility.
662
That smaller volume magmatic landforms exhibit a smaller range of normalized erosion
663
rates than their larger counterparts (by a factor of more than 1000) might be explained
664
solely by different constructional processes. Edifice construction (which includes both
665
extrusive deposits and intrusions) as well as purely intrusive landforms tend to be tightly
666
organized around a spatial locus due to cooling-induced rheological lockup and/or low
667
emplacement rates. Thus erodibility of small landforms will be dominated by height
668
changes. Because lava flows and explosive deposits tend to spread out, larger volume
669
landforms exhibit both area- and slope- dominated erosion up to the point (roughly A∼ 670
102
−103
km2
) where gravity limits landform height and average slopes fall below the angle
671
of repose. Emplacement rate compared to erosion rate also may play a role. Smaller
672
volume and more frequently occurring landforms of a single class (e.g., cinder cones,
673
stratovolcanoes) exhibit lower geometric potential for erosion (Figure 8). This regime
674
is commonly found on ocean islands, in monogenetic cones fields, and in arcs. Minimal
surface erosion occurs during typical constructional phases that might last 100s – 1000s
676
kyr [Clague and Sherrod, 2014]. Conversely, if small magmatic events occur in relative
677
isolation, any lasting landscape impact must come from changes in erodibility rather than
678
geometry as explored here.
679
The regime in which erosional processes operate on timescales similar to magmatic
680
recurrence times is the most complicated, as surface dissection by rivers can compete
681
with topographic infilling and smoothing by magmatism [Karlstrom and Perron, 2012].
682
However, landscapes within this regime are not uncommon. For example, in the last few
683
million years, the central Oregon Cascades, USA, have experienced numerous eruptions
684
from Cascades volcanoes (dominantly Newberry Volcano). This has resulted in erosion
685
rate variations and channel lateral migration of the Deschutes, Tumalo and Crooked
686
rivers [O’Connor et al., 2003; Jensen et al., 2009] as eruptions episodically fill in portions
687
of the eroding landscape. More work characterizing the topographic signatures of such
688
interactions, which likely contribute to the observed distributions of magmatic landform
689
shape (Figures 3-4), is needed.
690
7. Conclusions and future directions
Magmatism is largely outside the realm of traditional tectonic geomorphology, but the
691
same tools that have been influential in connecting tectonics to climate should be
appli-692
cable to volcanic settings. Magmatic provinces involve land surface uplift, the growth of
693
topography through eruption, and uniquely magmatic changes to erodibility of landscapes
694
that are comparable or larger than tectonic or climatic drivers (areas of ∼104
−108
km2
,
695
rates of ∼ 10−7 −10−1 m/yr, e.g., Wilkinson et al., 2009; Braun, 2010), over a large
696
fraction of Earth’s land surface area (Figure 1). In these terrains, landscape form could