by
S.G. Sunaryanto
A thesis submitted in partial fulfilment of the requirements for the degree of
Master of Arts in Demography
GRADUATE PROGRAM IN DEMOGRAPHY
NATIONAL CENTRE FOR DEVELOPMENT STUDIES THE AUSTRALIAN NATIONAL UNIVERSITY
DECLARATION
Except where otherwise indicated, this thesis is my own work.
Using the 1976 Indonesia Fertility Survey data, this study aims to identify which factors are most important in explaining the variation in the duration of breastfeeding and birth intervals, and to examine the patterns of breastfeeding and birth interval duration according to those factors. The factors that have been included are: place of residence, wife's and husband's education, age of mother, birth order and sex of the infant, method of contraception used and duration of breastfeeding.
Place of residence, wife's and husband’s education are found to have the greatest contribution in explaining the variation of the duration of breastfeeding. Shorter durations of breastfeeding are associated with urban residence and higher education. Age of mother and sex of the infant do not show a significant association with the duration of breastfeeding. Birth order and contraceptive use are also found to be associated with the duration of breastfeeding, however, their contributions in explaining the variation are not as great as either place of residence or wife's or husband’s education.
In the case of birth interval length, factors that are found to be most important in explaining the variation are the duration of breastfeeding and contraceptive use. Longer duration of birth intervals are associated with longer duration of breastfeeding and use of contraception. Factors of maternal age and birth order and sex of the infant do not have an association with the duration of birth intervals. Place of residence and wife's education, before controlling for other factors, seem to have a strong association with the duration of birth intervals. However, after controlling for other factors, the associations are likely to disappear. Presumably, the associations between these factors and the duration of birth intervals mainly are through the breastfeeding variable. Surprisingly, husband’s education has a quite strong association with the duration of birth intervals. It is presumed that the association is not related to the husband's education per se but it is related to the dominant opinion of the husband in decision making about having children.
ACKNOWLEDGMENT
I wish to express my appreciation to many individuals and institutions which have made possible completion of this thesis. Although 1 cannot specifically acknowledge all by name, I would like to thank in particular to my supervisor, Dr. Alan Gray, and my adviser, Dr. Paul A. Meyer, for their guidance, encouragement, and valuable help in the work completing this thesis.
I am thankful to Dr. David Lucas as the Director of the Graduate Frogram, National Centre for Development Studies, the Australian National University. Also 1 would like to thank to Ms. Chris McMurray and Ms. Marian May for their assistance and
help in computer problem and English.
Thanks are due to Prof. Dr. Kartomo Wirosuhardjo and Dr. Pamoedjo Rahardjo, both of the State Ministry of Population and Environment, Republic of Indonesia, who have made possible for me to get a scholarship and to study at the Australian National University.
the Dean of the Faculty of Agriculture of the same university, who gave me a chance and permit to study at the Australian National University.
To Ms. Nora of IDP and Ms. Pauline of Graduate House ANU who took care of me during my stay in Canberra, goes my warmest gratitude.
Indebtedness is expressed to all of my classmates who always gave encouragement and kept me company in sadness and happiness.
Last but not least, my deepest gratitude is to my very special persons : Inneke my wife, my lovely children Eko, Yanni, Sonni and Rinto to whom this work is dedicated.
LIST OF CONTENT
page.
ABSTRACT iii.
ACKNOWLEDGMENT iv.
LIST OF CONTENTS v i .
LIST OF TABLES viii.
LIST OF FIGURES x i .
LIST OF APPENDICES xii.
CHAPTER ONE : INTRODUCTION 1 .
1.1. Background and Objectives of the Study 1. 1.2. Demographic and Socio-economic Background
of Java and Bali 3.
CHAPTER TWO : BREASTFEEDING AND BIRTH INTERVALS :
A LITERATURE REVIEW 12.
2.1. Physiology of Lactation 13.
2.2. Effect of Breastfeeding on Birth Intervals 16.
CHAPTER THREE : METHODOLOGY 24.
3.1. Source of Data and Number of Cases 24. 3.2. Data Limitations and Variables Used 26.
3.3. Techniques of Analysis 33.
3.3.1. Bivariate Analysis 33.
3.3.2. Multivariate Analysis 35.
3.3.3. Examination of Two-way Interaction 38. CHAPTER FOUR : DIFFERENTIALS IN THE DURATION OF
BREASTFEEDING 41.
4.1. Type of Place of Residence 43.
4.2. Wife’s Education 46.
4.3. Husband's Education 48.
4.4. Age of Mother 50.
CHAPTER FIVE : DIFFERENTIALS IN THE DURATION OF
BIRTH INTERVALS 69
5.1. Type of Place of Residence 70
5.2. Wife's Education 72
5.3. Husband’s Education 75
5.4. Age of Mother 77
5.5. Birth Order of the Child 80
5.6. Sex of the Child 82
5.7. Method of Contraception Used 84
5.8. Duration of Breastfeeding 87
5.9. Multivariate Analysis 89
CHAPTER SIX : SUMMARY AND CONCLUSIONS 95 6.1. Differentials in the Duration of
Breastfeeding 95
6.2. Differentials in the Duration of
Birth Intervals 97
6.3. Conclusions and Implications 100
REFERENCES 102
APPENDICES 114
LIST OF TABLES
TABLES page
1.1. TOTAL LAND AREA, TOTAL POPULATION,
DENSITY AND ANNUAL GROWTH RATES OF THE SIX
PROVINCES IN JAVA AND BALI, 1971 AND 1980 . . 5. 1.2. TOTAL.FERTILITY RATES (TFRs), LIFE EXPECTANCY
AT BIRTH AND NET MIGRATION RATES (NMRs) OF THE SIX PROVINCES OF JAVA AND BALI, 1971 - 1980 . 6. 1.3. PERCENTAGE DISTRIBUTION OF POPULATION AGED
10 YEARS AND OVER EVER ATTENDING SCHOOL BY EDUCATIONAL ATTAINMENT IN ALL PROVINCES OF
JAVA-BALI , 1980 8.
1.4. PERCENTAGE DISTRIBUTION OF POPULATION AGED 10 YEARS AND OVER WHO WORKED DURING THE WEEK PRIOR TO ENUMERATION BY INDUSTRY,
JAVA-BALI, 1980 9.
1.5. PERCENTAGE OF GROSS REGIONAL DOMESTIC
PRODUCT AT CURRENT MARKET PRICE BY GROUP OF INDUSTRIAL ORIGIN IN ALL PROVINCES OF
JAVA-BALI, 1980 10.
2.1. MEAN DURATION OF LACTATION AND POSTPARTUM AMENORRHEA AMONG WOMEN WHO HAD WEANED
THEIR CHILDREN ... 19. 2.2. AVERAGE LENGTH OF PREGNANCY INTERVAL OF
LACTATING AND NON-LACTATING WOMEN ... 21. 4.1. MEAN DURATION OF BREASTFEEDING (in months]
BY TYPE OF PLACE OF RESIDENCE IN ALL
PROVINCES OF JAVA AND BALI, 1966 - 1974 . . . 44. 4.2. MEAN DURATION OF BREASTFEEDING (in months]
BY LEVEL OF WIFE’S EDUCATION IN ALL
PROVINCES OF JAVA AND BALI, 1966 - 1974 . . . 46.
4.4. MEAN DURATION OF BREASTFEEDING (in months) BY AGE OF MOTHER AT THE PENULTIMATE BIRTH IN
ALL PROVINCES OF JAVA AND BALI, 1966 - 1974 51 4.5. MEAN DURATION OF BREASTFEEDING (in months)
BY BIRTH ORDER OF THE PENULTIMATE CHILD IN ALL PROVINCES OF JAVA AND BALI, 1966 - 1974 . . . 53 4.6. MEAN DURATION OF BREASTFEEDING (in months)
BY SEX OF THE PENULTIMATE BIRTH IN ALL
PROVINCES OF JAVA AND BALI, 1966-1974 . . . 56 4.7. MEAN DURATION OF BREASTFEEDING (in months)
BY METHOD OF CONTRACEPTION USED DURING THE LAST CLOSED BIRTH INTERVAL IN ALL PROVINCES
OF JAVA AND BALI, 1966 - 1974 ... 58 4.8. ETAs, BETAS, PROBABILITIES OF F, AND MULTIPLE R
SQUARES IN THE BREASTFEEDING ANALYSIS . . . 65 5.1. MEAN DURATION OF BIRTH INTERVAL (in months)
BY TYPE OF PLACE OF RESIDENCE IN ALL
PROVINCES OF JAVA AND BALI, 1966 - 1974 . . . 71 5.2. MEAN DURATION OF BIRTH INTERVAL (in months)
BY LEVEL OF WIFE’S EDUCATION IN ALL
PROVINCES OF JAVA AND BALI, 1966 - 1974 . . . 73 5.3. MEAN DURATION OF BIRTH INTERVAL (in months)
BY LEVEL OF HUSBAND’S EDUCATION IN ALL
PROVINCES OF JAVA AND BALI, 1966 - 1974 . . . 76 5.4. MEAN DURATION OF BIRTH INTERVAL (in months)
BY AGE OF MOTHER IN ALL PROVINCES OF
JAVA AND BALI, 1966 - 1974 ... 78 5.5. MEAN DURATION OF BIRTH INTERVAL (in months)
BY BIRTH ORDER OF THE PENULTIMATE BIRTH IN ALL PROVINCES OF JAVA AND BALI, 1966 - 1974 . . . 81 5.6. MEAN DURATION OF BIRTH INTERVAL (in months)
BY SEX OF THE PENULTIMATE BIRTH IN ALL
PROVINCES OF JAVA AND BALI, 1966 - 1974 . . . 33 5.7. MEAN DURATION OF BIRTH INTERVAL (in months)
BY METHOD OF CONTRACEPTIVE USED IN ALL
PROVINCES OF JAVA AND BALI, 1966 - 1974 . . . 85
5.8. MEAN DURATION OF BIRTH INTERVAL (in months) BY THE DURATION OF BREASTFEEDING IN ALL
PROVINCES OF JAVA AND BALI, 1966 - 1974 . . . 37 5.9. ETAs, BETAS, PROBABILITIES OF F, AND MULTIPLE R
SQUARE IN THE BIRTH INTERVAL ANALYSIS . . . . 91
A. Percentage distribution of women according to the duration of breastfeeding, Jakarta. West Java, Central Java, Yogyakarta,
East Java and Bali
B. Degree of Urbanization for the Six Provinces of Java and Bali, 1961, 1971 and 1980
C. Variables Used and Their Categories in the Breastfeeding Multivariate Analyses
D. Variables Used and Their Categories in the Birth Interval Multivariate Analyses
E. Probability of F, Ratios of Interaction Sum of Squares Over Main Effect and
Total Sum of Squares in Two-way ANOVA in Breastfeeding Analysis
F. Probability of F, Ratios of Interaction Sum of Squares Over Main Effect and
Total Sum of Squares in Two-way ANOVA in Birth Interval Analysis
G. l Unadjusted and Adjusted Mean the Duration of Breastfeeding tin months) by Place of
Residence, Wife's and Husnad's Education, Age of Mother, Birth order and Sex of the Child, and Method of Contraceptive Used, Among Women in Java and Bali, West Java, Central Java, Yogyakarta and East Java,
1966 - 1974
G .2 Unadjusted and Adjusted the Mean Duration of Breastfeeding (in months) by Wife’s and
Husband's Education, Age of Mother, Birth Order and Sex of the Child and Contraceptive used among Women in Jakarta, 1966 - 1974
1 1 4.
115 .
116 .
117 .
119.
121 .
123 .
124.
G. 3 Un a d j u s t e d and Adju s t e d the Mean Duration of B re a s tf e e d i n g (in months) by place of
residence. Wife's Education, Birth Order and Sex of the Child, and Method of
C o n t r a c e p t i v e Used, among Women in Bali, 1966 - 1974
H.l U n ad j u s t e d and A d j u s t e d the Mean D u ration of Birth Interval (in months) by Place of
Residence, W i f e ’s and H u s n a d 's Education, Age of Mother, Birth order and Sex of the Child, and Me t h o d of C on t r a c e p t i v e Used, and
Dura t i o n of B r e a s t f e e d i n g Among Women in Java and Bali, West Java,, Central Java, Y o g y a ka r t a and East Java, 1966 - 1974
H.2 U n ad j u s t e d and A d j u s te d the Mean Dura t i o n of Birth Interval (in months) by W i f e ’s and H u s n a d 's Education, Age of Mother, Birth order and Sex of the Child, and Method of C o n t r a c e p t i v e Used, and Duration of
B r ea s t f e e d i n g A m o n g Women in Jakarta 1966 - 1974
H.3 Un a d j u s t e d and Adju s t e d the Mean Duration of Birth Interval (in months) by Place of
Residence, W i f e ’s and H u s n a d 's Education, Age of Mother, Birth order and Sex of the Child, and Method of C o n t r a c e p t i v e Used, and
D u r a t i o n of B r e a s t f e e d i n g Amo n g Women in Y og y a k a r t a 1966 - 1974
H .4 U n a d j u st e d and A d j u s t e d the Mean D u ration of Birth Interval (in months) by Place of
Residence, Wife's and Husn a d ' s Education, Age of Mother, Birthh order and Sex of
the Child, and M ethod of C on t r a c e p t i v e Used, and D u r a t i o n of B r e a s t f e e d i n g Among Women in Bali, 1966 - 1974
125
126
128
129
130
1.1. Background and Objectives of the Study.
Most population problems, especially in developing countries, are associated with high fertility rates. There are various factors affecting fertility. For the individual woman, the duration of birth intervals vincluding the open interval; determines the number of births during her reproductive period. The longer the birth interval, the lower the number of births. Physiologically, breastfeeding lengthens the period of infertility after birth, accordingly, any closed birth interval can be prolonged, and in the end it will affect fertility. Tyson ^1977: 3*+;, among others, argues that the level of fertility in a population is a function of the length of the birth interval.
However, aside from biological ones, breastfeeding is influenced by social factors. Many studies show that factors such as type of place of residence, education,
2
working status, occupation and age of mother, practices of contraception and supplementary feeding, survivorship and birth order of the child, and psychological and socio-cultural factors influence both incidence and duration of breastfeeding. Other studies attempt to explain the relationship between breastfeeding and birth interval through both physiological and demographic mechanisms.
For Indonesia, there are not many studies of these topics because few population surveys have gathered such information about breastfeeding and birth intervals. One population survey chat gathered quite detailed information about breastfeeding and birth intervals, and covered quite a wide area, is the 1976 Indonesia Fertility Survey vIFS;, part of the World Fertility Survey <.WFS;.
In view of the discussion mentioned above, the objectives of this study, are :
(. 1; to identify which explanatory factors are most important in explaining variation in the
duration of both breastfeeding and birth interval in Indonesia;
(.2; to examine the patterns of breastfeeding and birth intervals according to those factors, at the provincial level.
Factors that will be investigated in this study are : type of place of residence, wife's and husband's education, age of mother at the penultimate birth, birth order and sex of the penultimate birth, method of contraception used and duration of breastfeeding during the last closed birth interval .
1-2. Demographic and Socio-economic Background of Java and Bali.
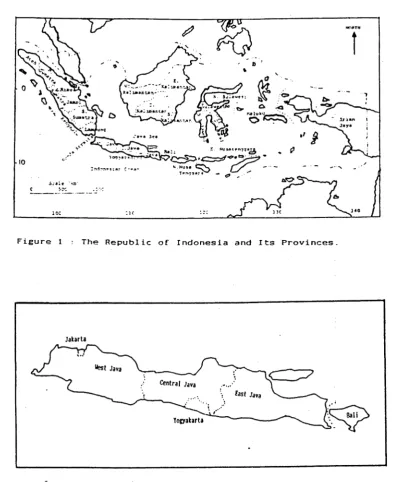
Java and Bali are the two most populous islands of Indonesia. Administratively, they are divided into six provinces: the Special Region of Jakarta (.Jakarta;, the national capital; West Java; Central Java; the Special Region of Yogyakarta (. Yogyakarta; , East Java and Bali
(.see Figures 1 and 2;.
'J l u H ’J
O
F i g u r e 1 : T h e R e p u b l i c of I n d o n e s i a and Its P r o v i n c e s .
Java
Yogyakarta
F i g u r e 2 : J a v a - B a l i a n d Its Six P r o v i n c e s .
[image:16.562.79.480.71.554.2]than that of Indonesia at the national level (.Table 1.1;. within each province (except Jakarta;, 78-65% of the population lived in rural areas (.Biro Pusat Statistik, 1963a-f: 3;.
Ta b l e l.l : t ot a l La n d a r e a, total p o p u l a t i o n, DENSITY a n d a n n u a l GROWTH Ra t e s
OF THE SIX PROVINCES IN Ja v a aND BALI, 1971 AND I960
Province Total Land Area
Total Population
1971 I960
Density
1971 I960
Annual Growth Rates 71-60
(Ki2 ; tS (thousand; [ % ) • > (thousand; (£;•> ipersons/ki2 ; (X;
Jakarta 590 0.03 4579 3.64 6503 4.4l 7761 11023 3.93
west Java 46300 2.41 21624 16.14 27454 16.61 467 593 2.66
Central Java 34206 1.76 21677 16.35 25373 17.20 Ö4Ü 742 1.Ö4
Yogyakarta 3169 0.17 2469 2.09 2751 1.67 765 666 1.10
East Java 47922 2.50 25517 22.46 29169 21.41 532 609 1.49
Java 132167 6.69 76066 63.63 91270 61.66 576 690 2.02
Bali 5561 0.29 2120 1.76 2470 1.67 361 444 1.69
Indonesia 1919443 100.00 119206 100.00 147490 100.00 62 77 2.32
Note : mt per cent of total land area of Indonesia. per cent of total population of Indonesia. Source : Abdurochin, 1986: 9-13.
6
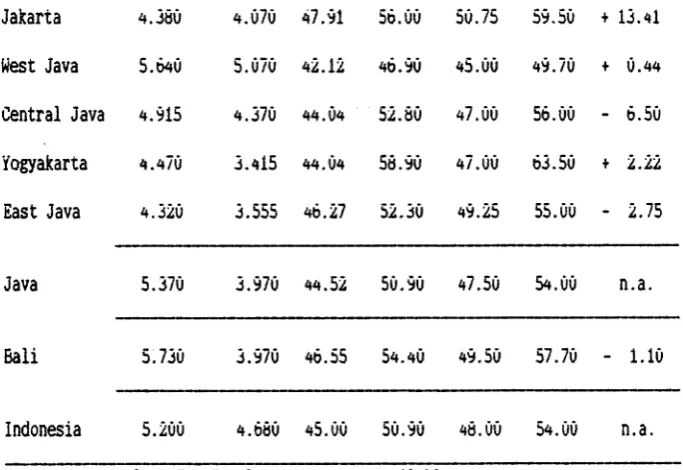
for Jakarta was not due to the high level of fertility but the high positive net migration rate, which was 13.-41 per 10ÜÜ (.Table 1.2). For west Java, unlike
[image:18.562.96.438.339.574.2]Jakarta, the annual growth rate was caused by both the
TABLE 1.2 : TOTAL FERTILITY RaTES (TFRs;, LIFE EXPECTANCY aT BIRTH aNB NET MIGRATION RATES (NMRs; FOR THE SIX PROVINCES OF JAVA aND BALI, 1971 - 1960
Provinces
TFRs (per wonan;^ Life Expectancy at Birth 21 NMRs 71-60 3> iper 1000; 71-75 76-79 M 71 M 60 F 71 F 60
Jakarta 4.360 4.070 47.91 56.00 50.75 59.50 + 13.41 west Java 5.040 5.070 42.12 46.90 45.00 49.70 + 0.44 Central Java 4.915 4.370 44. Ö4 52.60 47.00 56.00 - 6.50
Yogyakarta 4.470 3.415 44.04 56.90 47.00 63.50 + 2.22 East Java 4.320 3.555 46.27 52.30 49.25 55.00 - 2.75
Java 5.370 3.970 44.52 50.90 47.50 54.00 n.a.
Bali 5.730 3.970 46.55 54.40 49.50 57.70 - 1.10
Indonesia 5.200 4.660 45.00 50.90 46.00 54.00 n.a. Note : M = Male ; F = Feaale; n.a. = not available.
Source : Abdurochia, 1966 : li: p.26; 2>: p.37; 31: p.^j.
high level of fertility (.higher than the national level; and the positive net migration rate.
the lowest.
For the other three provinces, aside from generally lower fertility, low annual growth rates were caused by negative net migration rates. Table 1.2 presents in greater detail the Total Fertility Rates (. TFRs) and the Net Migration Rates of the six
provinces.
In order to get a perspective on the level of mortality, life expectancies at birth are also shown in Table 1.2 for the six provinces. Increases in life expectancy at birth for both males and females between 1971 and 1960 reflect improvements in the living standards within each province.
6
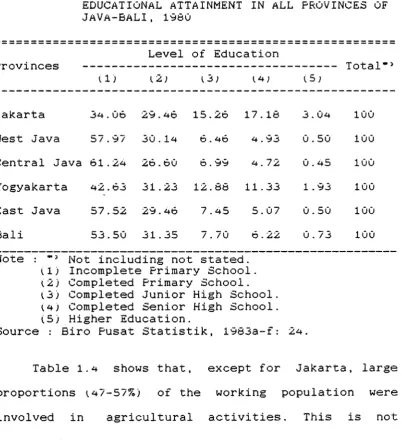
of the population attended school only for incomplete
primary level education. Jakarta's population was more
educated than that of any other province. However, it
should be noticed that as the census is De Facto, many
people in Jakarta and Yogyakarta may be studying there
temporarily but originate in other provinces, and will
return there on graduation.
TABLE 1.3 : PERCENTAGE DISTRIBUTION OF POPULATION AGED
10 YEARS AND OVER EVER ATTENDING SCHOOL BY EDUCATIONAL ATTAINMENT IN ALL PROVINCES OF J A V A - B A L I , 1980
Level of Education
Provinces --- Total" 1
llj \2) (.3; (.a ; (. 5 ;
Jakarta 3a .06 29 .a6 15.26 17.18 3.0a 100
west Java 57.97 30.1 a 6 . a6 a . 93 0.50 100
Central Java 61.2a 26.60 6.99 a . 72 0 .a5 100
Yogyakarta a2.63 31.23 12.68 11.33 1.93 100
East Java 57.52 29 .a6 7. a5 5.07 0.50 100
Bali 53.50 31.35 7.70 6.22 0.73 100
Note : Not including not stated.
(1; Incomplete Primary School.
{2) Completed Primary School.
{3 ) Completed Junior High School.
<.a; Completed Senior High School. i.5; Higher Education.
Source : Biro Pusat Statistik, 1963a-f: 2*4.
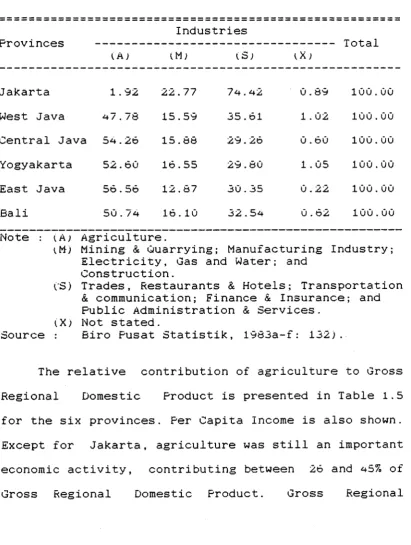
Table 1 .a shows that, except for Jakarta, large
proportions <.a7-57%; of the working population were
[image:20.562.81.484.320.765.2]surprising because 76-65% of the population resided in rural areas. This might reflect the relatively low levels of regional development.
TABLE 1.4 : PERCENTAGE DISTRIBUTION OF POPULATION AGED
10 YEARS AND OVER WHO WORKED DURING THE WEEK PRIOR TO ENUMERATION BY INDUSTRY, JAVA-BALI, I960
Provinces
A ;
Industries
tM; tS) IX;
Total
Jakarta 1 .92 22. 77 74 .<42 0 .69 100 .00 West Java <4? ., 76 15 ..59 35 .,61 1 ., 02 100 ., 00 Central Java 5*4 ., 26 15..66 29., 26 0 .. 60 100 ., 00 Yogyakarta 52..60 16..55 29..60 1 .. 05 100.. 00 East Java 56 ..56 12..67 30 .. 35 0 .. 22 100., 00 Bali 50 . 74 16 . 10 32 .54 0 . 62 100 . 00 Note : [ A ) Agriculture.
^M; Mining & Ouarrying; Manufacturing Industry; Electricity, Gas and Water; and
Construction.
VS) Trades, Restaurants & Hotels; Transportation & communication; Finance & Insurance; and Public Administration & Services.
[ X ) Not stated.
Source : Biro Pusat Statistik, 1963a-f: 132;.
[image:21.562.76.488.233.779.2]10
Domestic Product was highest in Jakarta and lowest in Yogyakarta, with the others falling in between. Jakarta also had the highest per capita income and Yogyakarta the lowest.
TABLE 1.5 : PERCENTAGE OF GROSS REGIONAL DOMESTIC PRODUCT AT CURRENT MARKET PRICE BY GROUP OF INDUSTRIAL ORIGIN IN ALL PROVINCES OF JAVA-BALI, 1080
Provinces
Group of Industrial Origin11 Total Per Capita21 Incoae
1rupiah;
IAJ iM; IS; Per cent Million rp.2>
Jakarta 1.^3
-- (%)
-24.46 74.11 100 3 966 071 624 747 West Java 26.19 33.79 40.02 100 5 651 547 207 724 Central Java 42.95 12.62 44.43 100 3 630 636 150 516 Yogyakarta 42.14 14.21 43.65 100 409 741 14Ö 302 East Java 36.76 17.06 40.16 100 5 956 263 205 126 Bali 44.92 13.06 41.62 100 405 996 197 692 Note : a/ iAj, iM; and iS; are the same as the note of Table 1.4.
b; Rp. 632.01 = US $ 1.00 (Econoaist Intelligence Unit, 1087-88: 12;. Source : l> Biro Pusat Statistik, 1067: 165;.
2> Biro Pusat Statistik, 1066: 620-622.
CHAPTER TWO
BREASTFEEDING AND BIRTH INTERVALS: A LITERATURE REVIEW
Breastfeeding is important for infant health, since it provides good nutrition, strengthens resistance to disease, and guarantees a hygienic food source iBuchanan, 1975: 5<4;. However, breastfeeding is not only important for infant health but also important for birth spacing. In the context of this study, this review focuses only on the second aspect.
Interest in the study of the relationship between breastfeeding and birth interval length has been increasing among physicians for some time and more recently among demographers, anthropologists and family planners t, Simpson-Herbert, 1977: 1). The physiological relationship between breastfeeding and birth interval has been investigated intensively by reproductive physiologists (Tyson, 1977; Delvoye et a l .. 1977; McNeilly, 1977/79; Gross and Eastman, 1985;. There have also been several demographic studies on the subject t.Singarimbun and Manning, 1976; Rosa, 1979; Jain et
a l ., 19/0; Jain and aongaarts, 1^81; Bongaaris, 1982; Hull, 1985;.
This section reviews some of the key studies relating breastfeeding and birth intervals. However, before reviewing those studies, it is necessary to understand a little about the physiology of lactation. Hence, this review deals first with the physiology of lactation, followed by the effect of breastfeeding on birth intervals.
2.1. Physiology of Lactation.
Lactation is a part of the human reproductive process. Thus, a discussion of breastfeeding cannot be separated from consideration of the reproductive process itself.
reproductive process is oxytocin, secreted by the pituitary gland {Buchanan, 1985: 52;.
During pregnancy, milk-producing tissues in the breast are being prepared. There is a proliferation of glandular tissues and ducts, stimulated by increases in estrogen, progesterone and lactogen {McCann et a l ., 1981: 5-4-3; . Aside from these hormones, concentration of prolactin -- the hormone that is considered to be responsible for initiation and maintenance of lactation { Tyson, 1977: 3a; -- also increases ifraser, 1979: 50;. However, its effect is inhibited by the high level of estrogen and progesterone {Reece, 1958: 232;.
temporarily after birth is called post-partum amenorrhea, and lactational amenorrhea is defined as the period of post-partum amenorrhea associated with breastfeeding (.Van Ginneken, 197^+: 201;.
Medical studies on breastfeeding show that the prolactin secretion is a response to a direct mechanical stimulation of the nipple (McNeilly, 1979: 152). In another publication McNeilly (1977: 11; clarifies that prolactin secretion occurs as soon as suckling begins and stops when the stimulus ends; the amount of prolactin secreted depends on the strength and the duration of the stimulus. Moreover, he adds that if both breasts are suckled simultaneously (thus doubling the stimulus;, the amount of prolactin secreted is also increased. If there is no suckling stimulus, the level of prolactin will return to normal within two (Shearman, 1979: li^+; or three weeks (.Simpson-Herbert and Huffman, 1981: 127; post-partum. The declining prolactin level is also affected by the frequency and the stage of lactation. The prolactin level of women who are nursing only one to three times per day declines more rapid than that of women who are nursing six times or more per day. Furthermore, the earlier the stage of lactation, the quicker the increase in prolactin due to the suckling stimulus
16
In summary, due to the hormonal mechanisms, breastieeding may lengthen the post-partum amenorrhea that is often called lactation amenorrhea. The suckling stimulus promotes the secretion of prolactin. The high level of prolactin inhibits the secretion of both Follicle Stimulating Hormone iFSH; and Luteinizing Hormone iLH). The low level of Follicle Stimulating Hormone iFSH) and Luteinizing Hormone t LH) suppresses follicle growth and ovulation. It. suppresses the menstrual cycle and consequently post-partum amenorrhea is prolonged.
2.2. Effect of Breastfeeding on Birth Interval.
Physiologically, due to its hormonal mechanism, breastfeeding lengthens post-partum amenorrhea. Because post-partum amenorrhea is one component of the birth interval ^Tyson, 1977: 3^+;, many studies, both medical and demographic, have investigated the relationship between breastfeeding and post-partum amenorrhea, rather than breastfeeding and the birth interval.
i. p . 259;. Further analysis showed a positive relationship between the period of lactation in months (.X; and the amenorrheic period in months (Y;, following the regression equation of Y = *+.31 + 0.397 X ip. 262;. Taking into consideration the age of the mother, the equations for younger and older taged 30 years or more; mother were: Y = <4.06 + 0.350 X and Y = 5.2-4 + 0. 4O4 X,
respectively. These indicate that amenorrheic periods for older mothers were longer than those of younger mothers. In addition, with the same duration of lactation, the older mothers had a longer additional period of amenorrhea, compared to the younger mothers.
18
Y - - 3.5/ + 0.508 Xx + 0.174 X2 . The two variables explained 39.3 per cent of the variation.
Another study by Ojofeitimi (1982), involved five different variables. The five independent variables that Ojofeitimi used were duration of formal education in years (Xx ) , duration of breastfeeding in months (X2 ), frequency of breastfeeding per day (Xg ) , age of the mother (X*) , and parity (X-*). His analysis showed that the duration of breastfeeding and frequency of breastfeeding per day were significantly (P<.05) correlated to the length of post-partum amenorrhea. The estimated equation was: Y = - 9.136 -.014Xx +.635X2 + 2.136X3 +.088>U +.215XS . Furthermore, he stated that the longer the mother breastfed her infant, the longer menstruation was delayed.
Based on nine selected surveys, Van Ginneken (1978: 189) noticed that lactation may have a substantial impact on the duration of amenorrhea.
[image:30.562.66.512.516.735.2]TABLE 2.1. : MEAN DURATION OF LACTATION AND POSTPARTUM AMENORRHEA AMONG WOMEN WHO HAD WEANED THEIR CHILDREN
Country
Type of
residence Lactation (months)
Postpartum amenorrhea (Months)
Zaire rural 26 20
Indonesia rural 25.5 22
Bangladesh rural 25 19
Korea urban+rural 23 13.5
India rural 21 11
Taiwan urban+rural 16 10.5
Thailand urban 12 6
Philippines urban 10 7
Colombia urban 8 4
Source : Van Ginneken, 19/8: 189.
findings suggest that breastfeeding prolongs the duration of post-partum amenorrhea. However, it is necessary to consider that menstruation is not always preceded by ovulation, but ovulation is always followed by menstruation unless there is a conception. Findings from India indicate that 12.2% of
[image:31.562.64.496.127.709.2]20
after resumption of menstruation, breastfeeding may inhibit the return of ovarian function (Santow, 1987: 156) On the other hand, Lucas (I960: 73) argues that about 5% of women become pregnant before the resumption of menstruation; Rosa (1979: 211) gives the percentage as 3-10%.
Other than postpartum amenorrhea, another variable that is usually used as a proxy for birth interval is the pregnancy interval. The pregnancy interval is defined as the period from a birth to the next conception (Van Ginneken, 1974: 201), and does not refer to the interval between successive pregnancies that do not begin with a live birth.
Five studies of populations that did not use contraception or used it only to a small extent,
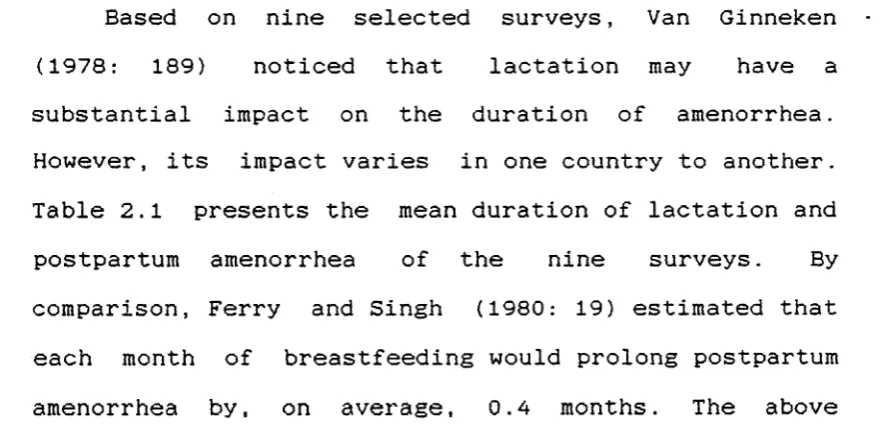
suggest that lactation lengthens pregnancy intervals substantially (van Ginneken, 1978: 185). Table 2.2 compares the average length of pregnancy interval of a group of lactating and non-lactating women. The lactating women were nursing mothers who had weaned their children; the non-lactating women were mothers who, because of foetal deaths or a still birth, had not nursed. Assuming that the length of pregnancies was the same (nine months and ten days approximately), the duration of birth intervals among lactating women would
TABLE 2.2 : AVERAGE LENGTH OF PREGNANCY LACTATING AND NON-LAGTATING
INTERVAL OF WOMEN
Country
Type of residence
Length of pregnancy interval
Lactating women N o n - l a c t .women
t. m o n t h s ; imonths;
Bangladesh rural 25 10
Nigeria rural 26.5 6
Senegal rural 2-4 11
India rural 22 12
Taiwan urban+rural 17 10
Source : Van Ginneken, 1976: 165.
A case study of breastfeeding, amenorrhea and
abstinence in a Javanese village showed that women who
nursed their infants for about 17 months had birth
intervals ranging from 16-23 months, while women who
nursed for about 26 months had on average birth
intervals of more than u7 months !. Singarimbun and
Manning, 1976: 177). Retrospective studies from Europe,
India and Taiwan showed that women who nursed for one
to two years and practised no contraception had birth
intervals 5 to 10 months longer than those who did not
nurse iVan Ginneken, 197-4: 201).
Although the findings mentioned above show an
interesting effect of breastfeeding on birth intervals
as breastfeeding delays the resumption of the menstrual
[image:33.562.70.481.81.674.2]22
there are some factors associated with both breastfeeding and birth interval. These include cultural factors ipost-partum abstinence; and socio economic factors. Several studies indicate that breastfeeding is usually accompanied by post-partum sexual abstinence and is affected by bottle-feeding practices.
CHAPTER THREE
METHODOLOGY
3.1. Source of Data and Number of Cases.
The data used in this study are drawn from the
1976 Indonesia Fertility Survey tlFS), which is a part
of the World Fertility Survey iWFS;. The 1976 IFS
covered six provinces of Java and Bali, namely:
Jakarta, West Java, Central Java, Yogyakarta, East
J a v a , and B a l i .
The target population of the survey was married
women under 50 years of age. The total number of
eligible respondents was 9, <4*49 but not all of them were
able to be interviewed. The number of interviewed
respondents was 9,293 ^Central Bureau of Statistics and
World Fertility Survey, 1976: 130;. However, the
available data tape (tape no. SR01), after some
correction and adjustment contained a total of 9,155
c a s e s .
In accordance wich che objective of the scuay and in order co avoid cruncacion effects, not all of the available cases are analysed. The cases analysed are women who have had two live births or more, and who had had birth for the second last time between two and ten years before the survey. The focus of this study is the last closed birth interval.
In order to avoid the disturbing effect of the survivorship of the infant (the second last birth; on the duration of breastfeeding, cases of mothers whose second last birth did not survive up to one year of age have been dropped from this study. The reason for this is that the effect of the survivorship of the infant on the duration of breastfeeding is already well known. The average duration of breastfeeding among mothers whose infants had died within the first year of life was much shorter than among mothers whose infants had died at a later age or were still alive at the time of interview tJain and Bongaarts, 1981:83;.
The two most important pieces of information needed in this study are the duration of breastfeeding and duration of birth interval. The questionnaire that was used in the 1976 IFS is the WFS core questionnaire.
26
breastfeeding that are used in the core questionnaire (in the English-language version) were simply :
(i) Did you feed ... (NAME OF THE SECOND TO LAST CHILD) ... at the breast ?
If the answer is ’Y E S ’, the following question is: (ii) For how many months did you feed him/her at
the breast ? (WFS, 1975:26).
Probably, because of either misinterpretation or misreporting, in 386 cases in the IFS data the duration of breastfeeding was longer than the duration of the birth interval. Considering the main objective of the study and the hormonal mechanism effect of breastfeeding, such cases have been excluded from this analysis, although the practice of continuing to feed an older child after the next birth is not unknown in Java.
with those restrictions, the total number of cases covered in this study is only 3599. The number of cases for each province was 654, 704, 805, 341, 696 and 399 for Jakarta, West Java, Central Java, Yogyakarta, East Java, and Bali, respectively.
3.2. Data Limitations and Variables Used.
as in any retrospective survey, response might not be free from memory lapse and misreporting.
Because only the core questionnaire was used, the special module on 'Factors Other than Contraception Affecting Fertility' was not included. Therefore, information about the post-partum amenorrheic period and post-partum abstinence, which are closely associated with the duration of breastfeeding and birth intervals, was not gathered in the survey. Consequently, the effect of breastfeeding on post partum amenorrhea, as well as the effect of post-partum abstinence on birth intervals, cannot be studied.
In addition, other information known to be closely related to either the duration of breastfeeding and the resumption of menstrual cycle, such as the frequency and the intensity of nursing, and the use of supplementary feeding, are not available. Consequently, the model examined in this study will not be able to explain variations in the duration of breastfeeding or birth intervals as thoroughly as if those pieces of information were available.
26
all of those possible factors will be considered in rhis study. The factors that will be investigated in this study are confined to type of place of residence, wife's and husband's education, age of mother at the second last birth, birth order and sex of the second last birth, and method of contraception used during the last closed birth interval. In birth interval analysis, duration of breastfeeding is added.
The following paragraphs discuss the variables used and their limitations. As the duration of both breastfeeding and birth interval are the focus of this study, they will be considered first.
Regardless of whether it is due to a custom that mothers wean on a child's birthday or misreporting or misinterpretation related to digit preference, heaping occurs in the duration of breastfeeding at multiples of six months from 12 months onwards. This heaping, as shown in Appendix A, was detected in all provinces.
Unlike the duration of breastfeeding, the duration of the last closed birth interval seems to be distributed normally. However, the validity of this variable is affected by the fact that there is no information about whether there was a miscarriage or stillbirth during that period. The last closed birth interval is defined as the period in months between the second last live birth and the last live birth preceding the time of interview.
30
residence; might differ from that at the time when the mother had her second last birth.
It might be possible to employ the variable of place of childhood residence to solve this problem. Unfortunately, the categorisation of these two variables is different. Current residence was classified as urban and rural, whereas childhood residence was classified as city, town and village.
Based on the discussion above, places of current: residence of mothers is assumed to be the same as at the time when those mothers had their second last births.
In addition, most studies using WFS data, for example by Jain and Bongaarts {1965;, Page et a l .
(1962;, Mosley et al .11962; and Ferry and Smith 1,1963;, among others, also attempt to use the current residence as an explanatory variable. Realizing such limitations, interpretation of the results of this study related to this factor {place of residence; should be interpreted with caution.
No major difficulties were identified for the variables of wife's and husband's education, birth order and sex of the second last birth. However, it should be noted that, in gathering information on education, the 1976 IFS employed three questions {Central Bureau of Statistics and World Fertility Survey, 19/6: 6**; as follows :
{i; Question 111 r'What was the highest level of school you attended : primary, junior high, senior high, academy or university ?'
{ii) Question 113 .-'Did you graduate from {.HIGHEST LEVEL ATTENDED;?'
{iii; Question 11*4 .-'Which class did you complete in (HIGHEST LEVEL ATTENDED;?'
32
Statistics and world Fertility Survey, 1976; classifies these variables into 'no schooling', 'primary incomplete, 'primary completed', 'junior high', 'senior high and more’. However, the available data tape of the 1976 IFS used in this study provides only years of schooling. Hence, the categories employed in this study are based on the years of schooling and labelled according to the level of Indonesia educational system. Considering the small number of cases studied within each province, variable of wife's and husband's education in this study are classified into 'No School’, 'Some Primary’, 'Completed Primary' and
'Junior High School +'.
Although the question constructed for gathering information on age of respondent was quite clear and provided interviewers with a transformation table of the various calendar systems, age misreporting is not likely to have been absent. Retrospective information collected in any survey in most developing countries especially in rural areas; is affected by memory lapse and digit preference.
she stopped breastfeeding or for how long she was using contraception.
3.3. Techniques of Analysis.
In order to achieve one of the objectives of the study, to examine the patterns of duration of both breastfeeding and birth interval and to determine if the differences among categories within each variable are statistically significant or not, techniques of bivariate analysis, that is one-way Analysis of Variance (ANOVA), are applied. Subsequently, since a phenomenon -- in this case the duration of either breastfeeding or birth interval -- actually is not only associated with one factor or another but with several factors simultaneously, techniques of multivariate analysis, multi-way ANOVA and Multiple Classification Analysis (MCA), are used. All the analyses were
performed with the SPSS-X package program.
3.3.1. Bivariate Analysis.
3*4
interval; among categories within each factor would be examined to determine whether the difference is statistically significant.
The mathematical model that will be tested in the One-way ANOVA is :
^ i J = \ + A i + Ü, i j ,
where : Y u = observed duration of either breastfeeding or birth interval tin months;
Y = mean duration of breastfeeding or birth interval tin months;.
At = effect related to factor A for category i; the factor is either place of
residence or wife's or husband's
education, or birth order or sex of the infant, or method of contraception and/or duration of breastfeeding in the birth interval analysis.
Etj = random error.
There are seven 'multiple range’ tests that are available in the additional test in the subprogram of one-way ANOVA. One of the tests that is chosen to be applied in this study is 'Scheffe's test'. The reason in selecting this test is that 'Scheffe's test’ is stricter than the other tests and it is exact, even for unequal group sizes tKim and Kohout, 1975:^28;.
each province. Note that this analysis examines mean durations rather than the medians which are frequently used in survival analysis of intervals, because means are implicitly selected in the choice of analysis of variance as the analytical technique. In addition, in order to examine the differences among provinces, the same techniques are also applied. The results of these analyses are presented in Tables 4.1 to 4.7 and Tables 5.1 to 5.8 for breastfeeding and birth interval analyses respectively.
3.3.2. Multivariate Analysis.
The techniques of multivariate analysis used in this study are multi-way ANOVA and Multiple Classification Analysis (MCA). The purpose of using these techniques is that by using them the gross and the net effect of each explanatory variable (factor), as well as which factors have the greater contribution in explaining variation in the dependent variable, can
be observed.
Since there is no higher priority for any particular factor, the classic experimental approach is used in this study, rather than the hierarchical
approach (Kim and Kohout, 1975: 406). As noted by Overall and Spiegel (1964, cited by Kim and Kohout,
36
s i t u a t i o n in which the factors do not have a known
causal order, and in which there are higher priorities
to the m a i n e f f ects rather than to the inte r a c t i o n
ef f e c t s .
The m a t h e m a t i c a l models that would be tested in this study are:
<. i ) h J k 1 m n o —
v ii;
Y + A i + Bj +
ck
A i b j + A i C k + A j.D
f'jGk + BjDi + BjE,
CkDi +
f
ktm + CkF,D x Em + Dx Fr, + d xg,
Fm-P n + FmG0 +
i1 nG0 + K “ 1j k XmnoX
U J k 1 m n o p
bl + F m + B n + G 0 +
+ A i E m + Aj.Fr, + A iG0
+ + B j G o +
+ G ^ G ^ +
+
i + Aj. + tij + C»< +
AiBj + A i C k + Aj.Di
BjCk + BjDi + B jEm
CkDx + C * E m + C k F n
Diüm + Di F,-» + DiGco
Fm fr. +HmGo + Em Hp,
** + f n H p +
+ E 1 j. J k 1 m n o p
Dl + ü m + i-r» + G 0 + Hp, +
+ A ± Em + Aj.Fr, + A i G 0 + A i H p + + BjFr. + BjG 0 + B jHp +
+ C kG 0 + C k Hp + + DiHp, +
w h e r e ,
Y i j k i m n o = o b s e r v e d d u r a t i o n of b r e a s t f e e d i n g
Y = mean duration of either breastfeeding or birth interval
Ai = effect related to place of residence for category i
Bj = effect related to wife's education for category j
£k = effect related to husband's education for category k
Bi = effect related to age of mother at the second last birth for category 1
£m = effect related to the birth order of the second last birth for category m
Fn = effect related to sex of the second last birth for category n
Gc = effect related to the method of
contraception used during the last closed interval for category o
Hp, = effect related to duration of breastfeeding for category p
AiBj to G0Hp = two-way interaction effects. ^ ‘ijkimno and E S jkimnop = random error.
Since there is no need to study the effects of higher-order interaction, option >4 of the ANOVA subprogram has been applied. By applying this option, the sum of squares of higher-order interactions are pooled into the error iresidual; sum of squares
^Norusis, 1985: 199;.
The two models were applied for Java and Bali (.as a whole; and for each province. The summarized results
38
breastfeeding and birth interval analysis are presented in Tables 4.8 and 5.9 respectively. The Eta cofficient is a ratio which shows how well a given factor can explain the variation in the dependent variable, while the Beta coefficient is the adjusted correlation ratio which can be compared to the partial correlation in multiple regression analysis (ESCAP Secretatriat, 1979 :121). In addition, the complete results (including the number of cases, the unadjusted and adjusted mean duration of breastfeeding and birth interval) can be
seen in Appendices G and H respectively.
3.3.3. Examination of Two-way Interaction.
The condition for using MCA is that there should be no interactions among factors (Andrew et a l .. 1975:
is continued to the second stage by computing the ratio of sum of squares of interaction over sum of squares of main effect. If the ratio is less than 1:10, the interaction is ignored. If the ratio is greater or equal to 1:10, the examination is continued to the third stage by computing the ratio of sum of squares of interaction over total sum of squares. If the ratio is less than 1:100, the interaction is negligible. If it is greater than 1:100, the interaction is not negligible.
For Java-Bali in aggregate, by the three criteria mentioned above, all possible interactions were negligible, whereas for some provinces they were not.
Therefore, in the analysis of the model, any pair of factors whose interaction cannot be ignored, is combined. By combining the two factors, the categories of the new factor become more detailed. Accordingly, the number of cases in each category becomes smaller
■4Ü
The mean duration of breastfeeding among women in Java and Bali, as shown in Table 4.1 is 16.5 months. This figure is slightly shorter than reported in the
'Principal Report Volume 1' of the 1976 IFS (.19,2 months; (, Central Bureau of Statistics and World Fertility Survey, 1976: Table 5. 13;. This is because in this study the cases in which duration of breastfeeding is longer than duration of birth interval have been dropped.
In comparison, McNicoll and Singarimbun (1963; who review some findings of selected micro-level studies related to breastfeeding, find that the mean duration of breastfeeding in Maguwoharjo (1972-73) and Sriharjo 11969-70; -- both are in Yogyakarta -- were 16 and 26 months respectively (p.57). In Ngaglik (.Yogyakarta,
1976;, it was found that 53% of women aged 20-29 and 71% of those aged 30-39 breastfed their last child at least 2-4 months (p.58). In Cermee and Duduk Sampeyan 1961), it is reported that 6-4% of
-41
respondents breastfed their last child for 2*4 months or longer and most of the rest did so for 12-23 months <p.59). The median length of breastfeeding reported in Boyolayar and Kadilayu {.Central Java, 1970;, and Serpong ^West Java, 1972-75; were 16, 2^+ and 16 months respectively ip.59). In Banyutowo and Karimunjawa {.Central Java, 1975;, the mean duration of breastfeeding was 2*4 months ip.59). The authors of the various studies did not always present their results in a comparable way. It is necessary to mention that all the places above are classified as rural areas.
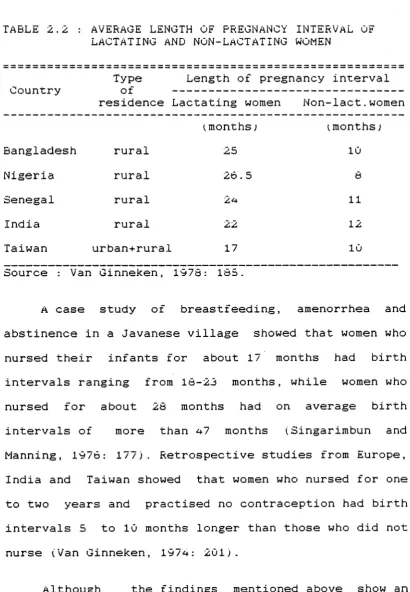
4.1. Type of Place of Residence.
The mean duration of breastfeeding in urban and rural areas in the six provinces are presented in Table 4.1. As in other studies ^Jain and Bongaarts, 1961; Knodel and Debavalya, I960; Page et a l ., I960 among others;, especially in developing countries, in all provinces the duration of breastfeeding in urban areas is significantly iP<.05; shorter than in rural areas. Ferry and Smith (1963; examined breastfeeding differentials among the 26 wFS participant countries whose first report had been published. They found that in most of the countries, urban mothers breastfed at least two months less than rural mothers did. In Paraguay, Syria, Jordan, Trinidad and Tobago, the difference was only one month; and in Guyana, the duration was nearly the same. Surprisingly, in Jamaica,
breastfeeding duration in rural areas was shorter by one month than in urban areas.
TABLE 4.1 : MEAN DURATION OF BREASTFEEDING tin months;
BY TYPE OF PLACE OF RESIDENCE IN aLL
PROVINCES OF JAVA AND BALI, 1966 - 19/4
provinces
Type of place of residence Urban
Urban Rural rural
Jakarta 13.01
{654;
— 13.01*
(654 ;
West Java 14.93 20.23 16.79
(191) (513; l 704 ;
Central Java 13.74 22.02 20.07*
1190; <. 615; 1 805 ;
Yogyakarta 17.10 25.16 24.45
1 30; (311) 1341 ;
East Java 13.34 21.74 19.63
(175) 1521; (, 696 ;
Bali 12.61 17.53 17.06
l 36; 1361; 399 ;
Java - Bali 13.53 21.29 16.53
(1276) (2321; t 3599;
Note: 1;
2;
3;
Source :
All the urban-rural contrasts are significant
(P < . 0 5 ; .
Significantly less than the next highest figure in the column tP<.05;
Figures in parentheses are the number of c a s e s .
Primary analysis of the 1976 Indonesia Fertility Survey (IFS) data tape.
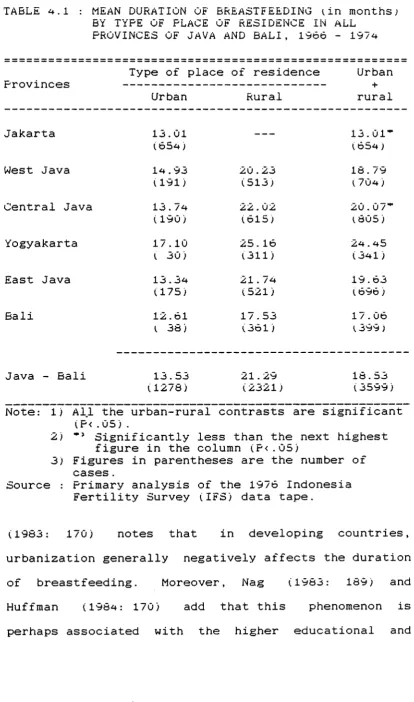
i1963: 170; notes that in developing countries,
urbanization generally negatively affects the duration
of breastfeeding. Moreover, Nag (1963: 169; and
Huffman ^1964: 170; add that this phenomenon is
[image:56.562.67.482.100.803.2]employment: opportunities for women and the greater use of breast milk substitutes in urban areas.