Int. J. Electrochem. Sci., 9 (2014) 736 - 759
International Journal of
ELECTROCHEMICAL
SCIENCE
www.electrochemsci.org
Electrochemically Reduced Graphene Oxide Pencil-Graphite
in
situ
Plated Bismuth-film Electrode for the Determination of
Trace Metals by Anodic Stripping Voltammetry
Keagan Pokpas, Salma Zbeda, Nazeem Jahed*, Nuralli Mohamed, Priscilla G. Baker, Emmanuel I. Iwuoha
SensorLab, Department of Chemistry, University of the Western Cape, Bellville 7535, South Africa.
*
E-mail: [email protected]
Received: 14 October 2013 / Accepted: 23 November 2013 / Published: 8 December 2013
An electrochemical platform was developed based on a pencil-graphite electrode (PGE) modified with electrochemically reduced graphene oxide (ERGO) sheets and in conjunction with an in situ plated bismuth-film (ERGO-PG-BiE). The ERGO-PG-BiE was used as a sensing platform for determining Zn2+, Cd2+ and Pb2+ by square wave anodic stripping voltammetry (SWASV). ERGO sheets were deposited on to pencil-graphite electrodes by cyclic voltammetric reduction from a graphene oxide (GO) solution. The GO, with flake thicknesses varying between 1.78 to 2.10 nm (2 sheets) was characterized using FT-IR, HR-SEM, HR-TEM, AFM, XRD and Raman spectroscopy. Parameters influencing the electroanalytical response of the ERGO-PG-BiE such as, bismuth-film concentration, deposition potential, deposition time and rotation speed were investigated and optimized. The ERGO-PG-BiE gave well-defined, reproducible peaks with detection limits of 0.19 µg L-1, 0.09 µg L-1 and 0.12 µg L-1
for Zn2+, Cd2+ and Pb2+ respectively, at a deposition time of 120 seconds. For real sample analysis, the enhanced voltammetric sensor proved to be suitable for the detection and quantitation of heavy metals below the US EPA prescribed drinking water standards of 5 mg L-1, 5 µg L-1 and 15 µg L-1 for Zn2+, Cd2+ and Pb2+ respectively.
Keywords: Electrochemically reduced graphene oxide, pencil-graphite electrode, bismuth-film, trace metals, anodic stripping voltammetry
1. INTRODUCTION
long biological half-life and non-biodegradable nature which eventually leads to their bioaccumulation in vital human organs [2.4]. In recent years, the increase in heavy metal contamination of food sources and drinking water [5] from anthropogenic activities such as mining and industrial processing [6] has become a global concern. In addition, contamination of drinking water from lead pipes and from the industrial sector are amongst the most common sources of heavy metal pollution in present times [7].
Electrochemical square-wave anodic stripping voltammetry (SWASV) is currently widely regarded as a convenient alternative technique for measuring trace amounts of heavy metal ions. This analytical technique’s advantageous features are, its high sensitivity, good selectivity, low cost and portability and multi-element measuring capability at the lower parts per billion levels [8,9]. A criticism often leveled at the stripping voltammetric technique is the use of mercury working electrodes which pose a health hazard and as a consequence there is a shift towards the search for more environmentally friendly mercury free working electrodes [10,11].
Much work and research has been put into the search for alternative electrode materials resulting in the use of antimony and bismuth working electrodes as, alternatives to mercury working electrodes. The thin bismuth-film electrode shows similar or comparable results to that of mercury-film electrodes since bismuth, is capable of forming “fused” alloys with trace metals which is analogous to the amalgams formed with mercury [12,13]. Moreover, bismuth coated electrodes offer many attractive properties including, the simple preparation [10], high sensitivity, good stripping signal and excellent resolution of peaks [14].
Graphene, a 2D allotrope of carbon composed of sp2 hybridized carbon atoms arranged in a honeycomb structure [7] is an exciting material for many device applications. Since it was first produced in 2004 it has attracted lots of attention and has shown to significantly improve the sensitivity in various applications due to rapid electron transfer [15] and high surface-to-volume ratio [16]. The use of graphene in applications such as electronics, sensing and energy conversion has been suggested and shown to be applicable on a wide variety of conductive and non-conductive substrates [7,9,15,17-19].
Techniques for immobilizing electro-active materials such as graphene on electrode surfaces are crucial in the development of sensitive, high performance electrochemical sensors. Amongst the commonly used immobilizing techniques are, drop casting, dip coating and passive adsorption [7,17,20,21] of graphene solutions, prepared via the chemical reduction of graphene oxide [15,22-25]. Electrochemical reduction is seen as a promising alternative due to its fast and green synthesis approach [26-29]. Recently a direct electrochemical reduction method of preparing reduced-graphene films at electrode surfaces in order to control film thickness and limit structural defects in graphene sheets was proposed [26,27].
Pencil graphite has been previously used as an electrode substrate material in different applications of stripping analysis [30-32] including the determination of trace metals at a BiE [17] and the adsorptive stripping voltammetric determination of trace nucleic acid [32]. Pencil-graphite electrodes (PGEs) offer many attractive features; it is a good conductor of electricity, needs almost no pretreatment, has low cost, readily available and has low background current. All of these properties make it a good alternative to the glassy-carbon and gold electrodes (GCE and GE) [17].
graphite electrodes from a colloidal graphene oxide solution. The modified pencil-graphite electrode in conjunction with an in situ plated bismuth-film (ERGO-PG-BiE) was used for the determination of trace metals (Zn2+, Cd2+ and Pb2+) by anodic stripping voltammetry (ASV).
2. EXPERIMENTAL PROCEDURE
2.1. Reagent
All chemicals used in this study were analytical reagent grade and used without further purification. Standard stock solutions (1,000 mg L-1, atomic absorption standard solution) were obtained from Sigma-Aldrich and diluted as required.
Acetate buffer (0.1 M, pH 4.6) was used as supporting electrolyte and prepared by mixing glacial acetic acid and sodium acetate followed by diluting the solution with ultra-pure distilled water (Millipore). A pH meter (Metrohm 827 pH lab.) was calibrated using pH 4 and pH 7 calibration buffer solutions and, then used to verify the pH of the acetate buffer (supporting electrolyte) solution.
2.2. Apparatus
Square-wave anodic stripping voltammetric measurements were performed using a 797 VA COMPUTRACE instrument (Metrohm, Switzerland) controlled by a personal computer. A three electrode electrochemical system consisting of an electrochemically reduced graphene oxide pencil-graphite bismuth-film electrode (ERGO-PG-BiE) served as the working electrode. An Ag/AgCl (saturated KCl) and platinum wire served as the reference and counter electrodes, respectively. All experiments were performed in a one compartment 20 mL voltammetric cell at room temperature.
of 1 – 5 N m-1 and a resonance frequency of 60 – 100 kHz. The samples for AFM were prepared by drop coating the graphite/water and graphene oxide/water (5 μL) dispersion onto a silicon wafer.
2.3. Synthesis of graphene oxide(GO)
Graphite oxide was synthesized from graphite powder according to the Hummers method [33] with some modification. Graphite powder (2 g) and sodium nitrite (1 g) were mixed with sulfuric acid (50 mL) in a clean dry conical flask and stirred at room temperature for 30 minutes, followed by subsequent mixing in an ice bath for 20 min. Potassium permanganate (7 g) was added gradually over a 30 minute period with constant stirring. The resulting solution was allowed to reach room temperature prior to being placed in a water bath set at 35 oC and, left to stir for 2 hours. The flask was returned to the ice bath with constant stirring. Ultra-pure water, 150 mL, was added before the addition of approximately 5 mL hydrogen peroxide until effervescence ceased. The flask was removed from the ice bath and allowed to stir at room temperature overnight and centrifuged for 20 minutes. Three successive acid washes were performed followed by one with ultra-pure water. The resulting product was the dried for 48 hours in a vacuum oven. The prepared graphite oxide (10 mg) was exfoliated in 10 mL of 0.1 M acetate buffer solution (pH 4.6) by ultrasonication for 1.0 hour to give a 1.0 mg mL-1 GO solution.
2.4. Preparation of electrochemically reduced grapheme oxide pencil graphite electrode (ERGO-PGE)
The pencil-graphite rods (Pentel, HB of 0.5 mm in diameter and 6 cm in length) were purchased from the local book store. A plastic syringe served as a holder into which the pencil rod was inserted exposing 1 cm of the rod tip at one end of the syringe. In order to establish electrical connection with the potentiostat a copper wire was attached to the other end of the pencil rod and passed through the top of the syringe.
The 1 cm rod tip was immersed in 10 mL of GO dispersion (1 mg mL-1) and cyclic voltammetric reduction of GO was performed with constant stirring in the potential range between -1.4 and +0.3 V for seven successive cycles. The instrumental parameters used for the electrodeposition procedure were as follows; deposition time (120 s), frequency (50 Hz), amplitude (0.04 V) and voltage step (0.004 V).
2.5 Electrode cleaning
To achieve accurate and reproducible results in quantitative analysis impeccable electrode hygiene was applied. The pencil-graphite electrodes were thoroughly cleaned before their use. A small quantity of ethanol was placed onto soft tissue paper and the surface of the electrode gently wiped followed by thorough rinsing with ultra-pure water. Successive dipping of the PGE in a 6 M HNO3
2.6. Procedure for square wave anodic stripping voltammetry (SWASV) analysis
The electrodes were immersed into the electrochemical cell containing, 10 mL of acetate buffer (0.1 M, pH 4.6), 10 µL of Bi3+
stock solution (1000 µg mL-1), and the target metal ions. A reduction potential (-1.4 V) was applied to the working electrode (ERGO-PGE) with constant stirring at 1000 rpm for 120 seconds resulting in the in situ deposition of the bismuth film and target metal ions (Zn2+, Cd2+, and Pb2+) onto the ERGO-PGE. After a brief rest period (10 seconds) the potential was scanned from -1.4 V to +0.3 V by applying a square- wave waveform to the ERGO-PGE. At the end of the scan the ERGO-PGE was electrochemically cleaned from the residual metals by applying a potential of 30 s at +0.3 V, with stirring.
2.7. Sample preparation
Tap water was collected in our laboratory after allowing water to run for 1 minute. For the determination of Zn2+, Cd2+ and Pb2+; 8 mL sample of tap water and 2 mL of 2 M acetate buffer was added to the electrochemical cell and the analysis was performed as described by the procedure in Section 2.6.
3. RESULTS AND DISCUSSION
3.1.1. Fourier Transformed Infrared Spectroscopy (FT-IR)
0 500 1000 1500 2000 2500 3000 3500 4000 4500
10 20 30 40 50 60 70 80 90 100
1026 1260
1401 1589
3117
1760
%
T
ra
n
s
m
it
ta
n
c
e
Wavenumber (cm-1)
[image:5.596.169.421.481.669.2]Graphite Graphene oxide
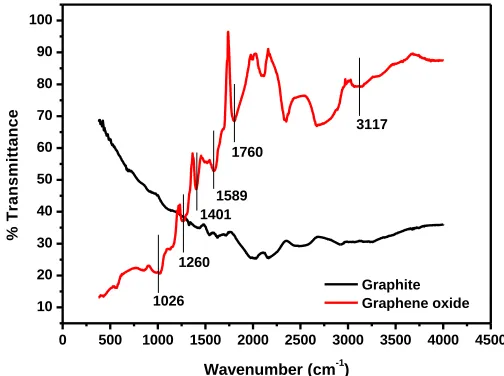
Figure 1. FT-IR spectra of Graphite and Graphene Oxide (GO)
following characteristic IR peaks appear, the O-H stretching vibration at 3117 cm-1, the C=O stretching vibration at 1760 cm-1 [34] and aromatic C=C stretching vibration at 1589 cm-1 [35]. The peak at 1401 cm-1 is associated with the bending C-O-H vibration [35], while the peaks at 1260 cm-1 [36] and 1026 cm-1 are due to the C-O stretching vibration occurring in epoxides and alcohols [34] within the graphite structure.
3.1.2. Raman Spectroscopy
The change in structure after the chemical transformation, from pure graphite 2(a) to graphene oxide 2(b) was investigated by Raman spectroscopy. The Raman spectrum for graphite in Figure 2(a) reveals a strong G band at 1575 cm-1, a significantly weaker D band at 1350 cm-1 and a moderate 2D band at 2721 cm-1. The G band occurs as a consequence of the symmetry which allows first order scattering of the E2g mode (of sp3 hybridized carbon atoms) to occur in the neatly ordered graphite structure [25]. The ratio of the intensities of the D and G bands (ID/IG), used as a measure of disorder
or defects within the structure [37,38] was calculated as 0.25 for graphite, demonstrating the highly ordered structure.
Graphene oxide [Figure 2(b)] on the other hand shows a significant decrease, broadening and Raman shift to 1600 cm-1 for the G band while the D band at 1360 cm-1 is considerably larger than in Figure 2(a). This increase is attributed to the reduction in size of the in-plane sp2 domains caused by the insertion of the epoxy, carboxyl, carbonyl and hydroxyl groups between the individual layers of the graphite [22]. A calculated ID/IG ratio of 0.975 was obtained, depicting an increase in structural
disorder.
0 500 1000 1500 2000 2500 3000
0 20 40 60 80 0 300 600 900 1200
(b)
D G ID/IG= 0.975
(a)
Raman Shift (cm-1)
In
te
n
s
it
y
(
a
b
s
.u
n
it
s
)
2D
[image:6.596.172.412.473.644.2]D G
Figure 2. Raman spectra of (a) Graphite and (b) Graphene Oxide.
3.1.3. X-ray Diffraction (XRD)
structure of graphite [39] while the strong, distinguishable 002 peak at 26.56o with inter-planar distance of 0.34 nm imply a highly ordered carbon structure [40]. In the XRD spectrum of GO the presence of a 001 peak at 9.81o corresponds to an interlayer spacing of approximately 0.7 nm and confirms the presence of oxygen containing functional groups which in turn, facilitates the hydration and exfoliation of the graphene oxide sheets in aqueous media [18].
0 10 20 30 40 50 60
4000 6000 8000 10000 12000 0 20000 40000 60000
(b) (001)
(100) (100)
(a)
(004) (002)
In
te
n
s
it
y
(
a
rb
it
ra
ry
u
n
it
s
)
[image:7.596.149.432.183.371.2]2 (degrees)
Figure 3.X-Ray Diffraction Patterns for (a) Graphite and (b) Graphene Oxide.
3.1.4. Atomic Force Microscopy (AFM)
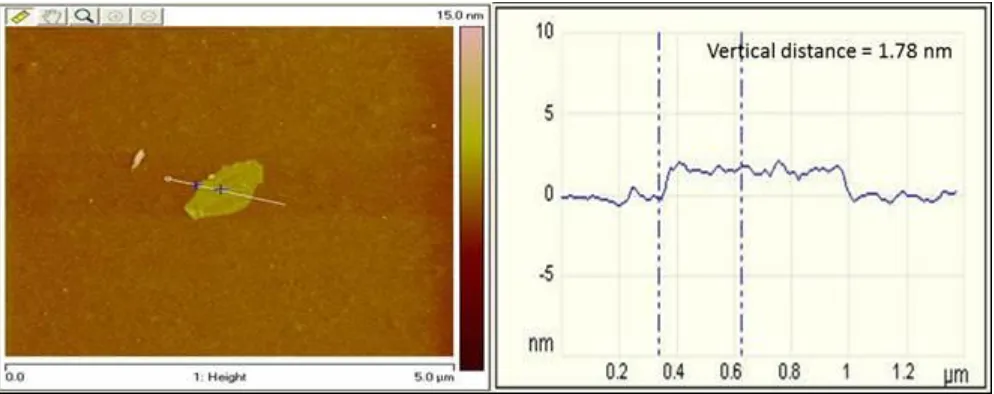
Figure 4. Tapping Mode AFM topographic image and height profile of GO (average thickness 1.80 nm), corresponding to two GO sheets.
[image:7.596.53.550.456.653.2]
oxide dispersion (1 mg mL-1) onto a silicon substrate. The cross-sectional view across the plain of the GO flake gave an estimated vertical distance (thickness) ranging from 1.78 - 2.10 nm and flake lengths of approximately 0.6 µm. Typically the thicknesses of individual GO sheets are in the range of 0.7 - 1.0 nm [25, 41] hence, the flake shown in Figure 4 corresponds to two GO sheets stacked together and is consistent with that reported by Marcano et al. [36].
3.1.5. High Resolution Transmission Electron Microscopy (HRTEM)
Samples for HRTEM analysis were prepared by ultrasonication in pure ethanol and then drop-casted onto Cu grids. The HRTEM image, Figure 5(a) of pure graphite is portrayed as thick dark flakes with distinct sharp, straight edges demonstrating its crystalline nature. At higher magnification highly ordered packing of graphene sheets are observed as highlighted by the arrows in Figure 5(b). The GO image, Figure 5(c), however is significantly different in graphitic structure when compared to that of graphite. Here, large transparent “wavy” sheets having soft edges are seen with entanglement and folding being portrayed as large wrinkles within sheets. An increase in transparency suggests regions of monolayer graphene [42]. Upon examination, at higher magnification of flake edges [Figure 5(d)] small regions of individual graphene sheets are observed. A lack of complete separation in non-aqueous media, such as ethanol is observed. This behaviour can presumably be attributed to the strong interlayer hydrogen bonds between the oxygen functional groups of adjacent graphene oxide layers in GO [43].
[image:8.596.130.489.430.718.2]
3.2.1. Electrochemical reduction of graphene oxide (GO)
Repetitive cyclic voltammograms obtained from the direct electrochemical reduction of a GO colloidal solution (1.0 mg mL-1) onto PGEs are shown in Figure 6 and shows two anodic (I and II) and one cathodic (III) peak. The presence of conducting ERGO on the PGE surface is confirmed by the redox couple (II and III). An increase in anodic peak (II) at 0.2 V with increasing number of scans was observed [26] while the cathodic peak (III) at -0.6 V increases until the fifth cycle then stabilizers. The aforementioned redox behaviour can be attributed to the deposition of ERGO sheets that are formed by the reduction of GO sheets that are in direct contact with the electrode surface [26]. Furthermore, the large anodic peak (I) at -1.0 V decreased rapidly after the first cycle suggesting the conversion of the GO sheets to ERGO at the electrode surface.
-1.6 -1.4 -1.2 -1.0 -0.8 -0.6 -0.4 -0.2 0.0 0.2 0.4 -140
-120 -100 -80 -60 -40 -20 0 20 40 60 80
100 I
II
Cycle 1 Cycle 2 Cycle 3 Cycle 4 Cycle 5 Cycle 6 Cycle 7 Cycle 8 Cycle 9
C
u
rr
e
n
t
(
A
)
Potential (V) III
Figure 6. Cyclic voltammograms depicting the electrochemical reduction of 1.0 mg mL−1 GO in acetate buffer solution (0.1 M, pH 4.6) at the PGE using the following instrumental parameters: scan rate (10 mV s−1), deposition time (120 s); frequency (50 Hz); amplitude (0.04 V) and voltage step (0.004 V).
[image:9.596.140.451.299.514.2]
-1.6 -1.4 -1.2 -1.0 -0.8 -0.6 -0.4 -0.2 0.0 0.2 0.4 -100
-80 -60 -40 -20 0 20 40 60 80
(b) (a)
C
u
rr
e
n
t
(
A
)
Potential (V)
[image:10.596.172.413.82.270.2]Bare PGE ERGO-PGE
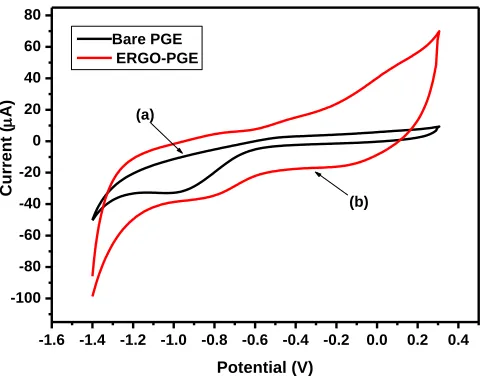
Figure 7. Cyclic voltammograms of (a) a bare PGE and (b) an ERGO-PGE in acetate buffer solution (0.1 M, pH 4.6) at the following instrumental parameters: scan rate (10 mV s−1), deposition time (120 s), frequency (50 Hz), amplitude (0.04 V) and voltage step (0.004 V).
3.2.2. Characteristic oxidation potentials of Bi3+ and target metal ions (Zn2+, Cd2+, and Pb2+)
Figure 8 shows well-resolved, symmetrical characteristic stripping peaks for Zn2+, Cd2+, Pb2+ and Bi3+ at the ERGO-Bi-PGE in 0.1 M acetate buffer solution (pH 4.6) appearing at -1.10 V, -0.75 V, -0.50 V and -0.06 V, respectively which arise from the redox reactions (equations 1 and 2) intrinsic to the anodic stripping analysis technique.
Mnn+ + né + Bi3+ → M (Bi) deposition step (reduction reaction) (1) M (Bi) → Mn++ né + Bi3+
stripping step (oxidation reaction) (2)
-1.6 -1.4 -1.2 -1.0 -0.8 -0.6 -0.4 -0.2 0.0 0.2 0.4
-100 0 100 200 300 400 500 600 700 800
Bi (-0.06 V)
Pb (-0.50 V) Cd (-0.75 V)
Zn (-1.10 V)
C
u
rr
e
n
t
(u
A
)
Potential (V)
[image:10.596.93.438.469.712.2]
3.2.3. Influence of the number of electrodeposition cycles.
The speed and ease of electron transfer through a film is of paramount importance to the performance and sensitivity of any electrode. Figure 9 show that the number of electrochemical reduction cycles influences the stripping peak currents of Zn2+, Cd2+ and Pb2+. A general increase in peak currents is observed for all three metal ions up to 7 cycles after which, the thickness of the graphene film impedes the flow of electrons to the electrode surface. A deposition of seven cycles was thus selected as the optimum number of cycles for the detection of heavy metal ions at the ERGO-PG-BiE.
0 2 4 6 8 10
0 5 10 15 20 25 30
35 Zn
Cd Pb
C
u
rr
e
n
t
(
A
)
Number of Deposition Cycles
Figure 9. Effect of number of cycles on the stripping peak currents of Zn2+, Cd2+ and Pb2+ at the ERGO-PG-BiE in 0.1 M acetate buffer (pH 4.6) at 120 s deposition time.
3.2.4. Microscopic characterisation of electrochemically reduced graphene oxide modified pencil-graphite electrode (ERGO-PGE)
[image:11.596.139.445.254.486.2]
Figure 10. HRSEM images of bare PGEs (a) 100 times magnification, (b) 3000 times magnification and ERGO- PGEs (c) 100 times magnification, (d) 3000 times magnification.
3.2.5. Effect of electrochemically reduced graphene oxide on the stripping peaks currents
-1.4 -1.2 -1.0 -0.8 -0.6 -0.4
0 10 20 30 40 50 60 70 80 90 100
(c) (b)
(a)
C
urr
en
t
(uA
)
Potential (V)
[image:13.596.145.440.98.326.2](a) PGE (b) ERGO-PGE (c) ERGO-PG-BiE
Figure 11.SWASV of 30 μg L-1 Zn2+, Cd2+ and Pb2+ at (a) bare PGE, (b) ERGO-PGE and (c) ERGO-PG-BiE. Supporting electrolyte (0.1 M acetate buffer, pH 4.6), deposition potential (-1.4 V), deposition time (120 s), frequency (50 Hz), amplitude (0.025 V) and voltage step (0.005 V).
3.2.6. Film Stability and Reproducibility
The stripping peak currents of Zn2+, Cd2+ and Pb2+ showed little or no change during the preparation of the modified electrodes as well as its application to the detection of 20 μg L-1
of target metal ions in 0.1 M of acetate buffer (pH 4.6), at the same conditions. Relative standard deviation (RSD %) for the oxidation peaks were calculated to be in the range of 1 – 3.5 % for all three target metal ions. The low standard deviation provides evidence as to the good reproducibility in preparing the ERGO-Bi-PGEs.
3.3.7. Effect of Supporting Electrolyte
The ERGO-Bi-PGE was evaluated in different electrolyte solutions; 0.1 M acetate buffer solution (pH 4.6), 0.1 M HCl solution (pH 2) and 0.1 M phosphate buffer solution (pH 7.1) containing 30 µg L-1
-1.4 -1.2 -1.0 -0.8 -0.6 -0.4 0
20 40 60 80 100
(c) (b)
C
u
rr
e
n
t
(
A
)
Potential (V)
0.1 M Acetate Buffer 0.1 M HCl
0.1 M Phosphate Buffer
(a)
Figure 12. SWASV of 30 μg L-1 of Zn2+, Cd2+ and Pb2+ at ERGO-Bi-PGE with supporting electrolyte: (a) 0.1 M acetate buffer (pH 4.6), (b) 0.1 M HCl and (c) 0.1 M phosphate buffer (pH 7.1). Deposition potential (-1.4 V), deposition time (120 s), frequency (50 Hz), amplitude (0.025 V) and voltage step (0.005 V).
3.2.8. Effect of the bismuth ion (Bi3+) concentration
0 1000 2000 3000 4000 5000 4
8 12 16 20 24 28 32 36 40
Cu
rr
en
t
(
g
.L
-1 )
Bi Concentration (g L-1)
[image:14.596.171.414.98.286.2]Zn Cd Pb
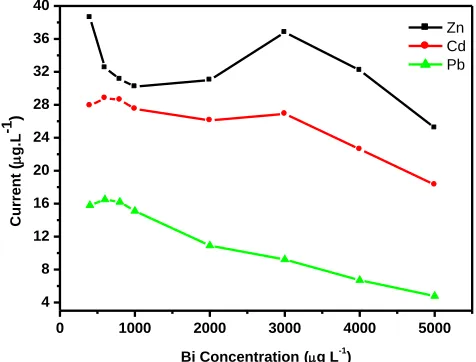
Figure 13. Effect of bismuth ion concentration on the stripping peak current of Zn2+, Cd2+ and Pb2+ at electrochemically reduced graphene oxide pencil graphite bismuth film electrode (ERGO-PG-BiE) in a 0.1 M acetate buffer solution (pH 4.6) containing 20 µg L-1 of each metal.
The effect of the bismuth ion concentration on the stripping peak currents of Zn2+, Cd2+ and Pb2+ at the unmodified pencil graphite electrode (PGE) in Figure 13, was investigated in a 0.1 M acetate buffer solution (pH 4.6) containing 20 µg L-1
[image:14.596.172.410.441.622.2]
concentrations varying from 200 to 4000 µg L-1. In this controlled environment, the concentration of the bismuth solution was directly proportional to the thickness of the Bi-film [17]. The stripping current for all three metals showed similar behavior in the range of 200 – 800 µg L-1 where the stripping currents increased to a maximum with increasing concentration followed by the decrease in peak current with increasing Bi3+ concentration. As a consequence of this behavior a bismuth ion concentration of 800 µg L-1 was selected for the developing the in situ deposited bismuth film.
3.2.9. Optimisation of Instrumental Parameters
Amongst the various stripping waveforms (differential pulse, cyclic and square-wave), the square-wave modulation combines high sensitivity with high speed. In addition, square-wave voltammetry shows insensitivity towards dissolved oxygen and is advantageous since the analysis can be performed without the time-consuming deoxygenating step [2,17]. The square-wave parameters affecting the analytical response at the EGO-PG-BiE are the amplitude, deposition potential, deposition time, frequency and rotation speed and their effect is shown in Figure 14.
The amplitude in Figure 14(a) was varied from 10 to 100 mV and showed an increase in stripping peak currents (for all three metals) with increasing amplitude up to a maximum, followed by a gradually decrease. Cadmium and zinc show steeper rising slopes demonstrating their enhanced dependence on amplitude. A 40 mV amplitude of was selected for subsequent experiments based on the information that any further amplitude increases does not result in a significant increase in peak current.
The influence of deposition potential on the peak currents of Zn2+, Cd2+ and Pb2+ at the ERGO-PG-BiE was investigated in the potential range from +0.2 V to -1.7 V, Figure 14(b). At potentials more positive than the oxidation potentials of individual metal ions no stripping peaks were observed due to the suppression of the reduction reaction responsible for the deposition of metal ions from solution onto the electrode surface. A general increase for all three metal ions is observed with increasing negative potentials up to -1.4 V, due to the preferential reduction and deposition of metal ions at the electrode surface. Since electrode saturation results in the decrease in stripping response between -1.4 V and -1.7 V, a potential of -1.4 V was chosen as the optimal deposition potential.
The effect of deposition time on the peak currents of the target metal ions, Figure 14(c), was studied over the time interval from 30 to 600 seconds. As the deposition time increased so did the stripping peak current for each metal ion since, a longer time allowed for more metal to be deposited onto the electrode surface. At deposition times greater than 540 seconds the peak heights level off suggesting surface saturation of the electrode, hence a deposition time of 120 s was used for further analysis.
Effect of rotation speed during the pre- concentration step was studied from 200 to 2000 rpm and shown in Figure 14(e). As the rotation speed increased, so does the peak currents of the metal ions being analyzed. Rotation speed enhances sensitivity of stripping analysis as it facilitates the movement of metal ions from the bulk solution to the electrode surface. A rotation speed of 1000 rpm was chosen in all further experiments.
Figure 14. Effect of amplitude (a), deposition potential (b), deposition time (c), frequency (d) and rotation speed (e) on the stripping peak current of Zn2+, Cd2+ and Pb2+ at electrochemically reduced graphene oxide pencil graphite bismuth film electrode (ERGO-PG-BiE) in a 0.1 M acetate buffer solution (pH 4.6) containing 20 µg L-1
of each metal and 1000 µg L-1 of bismuth.
0 20 40 60 80 100
5 10 15 20 25 30 35 40 Cu rrent ( A ) Amplitude (mV) Zn Cd Pb (a)
-1.8 -1.6 -1.4 -1.2 -1.0 -0.8 -0.6 -0.4 -0.2 0.0 0 5 10 15 20 25 (b) C urre nt ( uA )
Deposition Potential (V)
Zn Cd Pb
0 100 200 300 400 500 600
0 20 40 60 80 100 120 140 Zn Cd Pb C u rr e n t ( A )
Deposition Time (s)
(c)
0 20 40 60 80 100
0 5 10 15 20 25 30 35 40 45 50 C u rr e n t (u A ) Frequency (Hz) Zn Cd Pb (d)
0 400 800 1200 1600 2000
5 10 15 20 25 30 35 40 Cu rrent ( A )
Rotation Speed (rpm)
Zn Cd Pb
[image:16.596.108.490.174.679.2]
3.2.10. Analytical performance of the electrochemically reduced graphene oxide modified pencil graphite bismuth-film electrode
The analytical performance of ERGO-PG-BiEs were investigated by simultaneous and individual analysis of Zn2+, Cd2+ and Pb2+ over a low (2 – 20 μg L-1)and a high (10 – 100 μg L-1) concentration range. A slight shift in the peak potentials towards more positive potentials was observed for all three metal ions due to the IR-drop effect [7] since the oxidation of the metals became less reversible [49]. Figures 15 and 16 show the voltammograms and calibration plots for simultaneous and individual analyses, respectively. Calibration plots constructed from data obtained from voltammograms were used to calculate the detection limits and are presented in Table 1. Only the voltammograms and calibration curves for simultaneous and individual analyses at ERGO-PG-BiE over 10 – 100 μg L-1 range are presented in Figures 15 and 16.
Figure 15. SWASV and corresponding calibration plots of simultaneous analysis of Zn2+, Cd2+ and Pb2+ obtained at ERGO-PG-BiE over 10 – 100 µg L-1. Supporting electrolyte (0.1 M acetate buffer, pH 4.6), deposition time (120 s), deposition potential (-1.3 V), rotation speed (1000 rpm), frequency (50 Hz), amplitude (0.04 V) and sweep rate (0.2975 V s-1).
The standard deviation of the blank was calculated from ten replications in the presence of Bi3+ ions. Detection limits (3σ blank/slope) of the target metals for both individual and simultaneous analysis were determined using a deposition time of 120 s and are summarized in Table 1. A summary of previously reported analyses for Zn2+, Cd2+ and Pb2+ on Bismuth-film electrodes are shown in Table 2. Furthermore, a comparison of results for simultaneous and individual analysis (Figure 15) show improved sensitivity and detection limits for individual analysis at the ERGO-PG-BiE over both the high and low concentration ranges. The increase in analytical performance was attributed to the lack of competition for available active sites on the electrode surface in individual analysis; more target metal ions could form alloys with the bismuth-film and bind to the electrode surface in the deposition step. For simultaneous analysis, the opposite was observed. Metal ions co-deposited to form the fused alloys.
-1.4 -1.2 -1.0 -0.8 -0.6 -0.4
0 50 100 150 200 250
Pb Cd
C
ur
re
nt
(
A
)
Potential (V)
Zn (a)
0 20 40 60 80 100 120
0 50 100 150 200 250 300
C
u
rr
e
n
t
(u
A
)
Concentration (g L-1)
Zn Cd
Pb R2
= 0.998
R2 = 0.999
R2 = 0.999
[image:17.596.63.533.290.458.2]
Figure 16. SWASV and corresponding calibration plots for individual analysis of (a and b) Zn2+, (c
and d) Cd2+ and (e and f) Pb2+ obtained at ERGO-PG-BiE over 10 – 100 µg L-1. Supporting electrolyte (0.1 M acetate buffer, pH 4.6), deposition time (120 s), deposition potential (-1.3 V), rotation speed (1000 rpm), frequency (50 Hz), amplitude (0.04 V) and sweep rate (0.2975 V s
-1
).
-1.3 -1.2 -1.1 -1.0 -0.9 -0.8
10 20 30 40 50 60 C u rr e n t (u A ) Potential (V) Zn (a)
0 20 40 60 80 100
0 5 10 15 20 25 30 35 40 45 50 (b) C u rr e n t (u A )
Concentration (ug L-1)
Zn
R2 = 0.998
-1.0 -0.9 -0.8 -0.7 -0.6 -0.5
0 20 40 60 80 100 120 140 160 180 200 Potential (V) C u rr e n t ( A ) Cd (c)
0 20 40 60 80 100
0 20 40 60 80 100 120 140 160 180
Concentration (g L-1)
Cu rr e n t ( u A) Cd
R2 = 0.996
(d)
-0.8 -0.7 -0.6 -0.5 -0.4 -0.3
0 20 40 60 80 100 120 Potential (V) Current ( A ) Pb (e)
0 20 40 60 80 100
0 20 40 60 80 100 120
Concentration (g L-1)
Table 1.Calibration data representing Simultaneous and Individual Analysis of Zn2+, Cd2+ and Pb2+ at ERGO-PG-BiE in 0.1 M acetate buffer solution (pH 4.6) and deposition time, 120 seconds.
Analytical Parameter Simultaneous Analysis (2 – 20 (µg L-1)
Individual Analysis (2 – 20 (µg L-1)
Zn2+ Cd2+ Pb2+ Zn2+ Cd2+ Pb2+
Sensitivity
(µA L µg-1) 1.30 (±0.093) 1.09 (±0.104) 0.823 (±0.044) 0.549 (±0.021) 0.855 (±0.037)
0.673 (±0.019)
Correlation Coefficient (R2) 0.991 0.985 0.993 0.965 0.988 0.993
Detection Limits
(µg L-1) 0.255 (±0.046) 0.108 (±0.009) 0.127 (±0.008) 0.199 (±0.029) 0.099 (±0.002) 0.115 (±0.012) Analytical Parameter Simultaneous Analysis
(10 – 100 µg L-1)
Individual Analysis (10 – 100 µg L-1)
Zn2+ Cd2+ Pb2+ Zn2+ Cd2+ Pb2+
Sensitivity
(µA L µg-1) 2.74 (±0.039) 2.43 (±0.027) 1.52 (±0.021) 0.503 (±0.009) 1.80 (±0.023) 0.115 (±0.029)
Correlation Coefficient (R2) 0.995 0.998 0.997 0.996 0.992 0.995
Detection Limits
(µg L-1) 0.262 (±0.035) 0.103 (±0.009) 0.159 (±0.009) 0.209 (±0.005) 0.097 (±0.011) 0.115 (±0.005)
A summary of previously reported detection limits for Zn2+, Cd2+ and Pb2+ at various Bismuth-film electrodes presented in Table 2 shows that the detection limits obtained at the ERGO-PG-BiE compare well with other modified electrodes in this category.
Table 2. Aselected summary of previously reported detection limits for Zn2+, Cd2+ and Pb2+ at various Bismuth-film electrodes (BiFE).
Metals ions detected Electrode Substrate Measurement Technique
Deposition Time (s)
Detection Limit (µg L-1)
Reference
Pb2+, Cd2+, Zn2+ BiF-PGE SWASV 120 Pb2+ = 0.40 [17]
Cd2+ = 0.30 Zn2+ = 0.40
Pb2+ , Cd2+ Nafion-G BiFE DPASV 300 Pb2+ = 0.02 [9]
Cd2+ = 0.02
Pb2+, Cd2+, Zn2+ NC(Bpy)BiFE SWASV 120 Pb2+ = 0.08 [49] Cd2+ = 0.12
Pb2+ , Cd2+ Bi film C-paste SWASV 120 Pb2+ = 0.80 [50] Cd2+ = 1.00
Pb2+ , Cd2+ Bi/GNFs-Nafion/GCE
DPASV 300 Pb2+ = 0.02 [51]
Cd2+ = 0.09
Pb2+, Cd2+, Zn2+ Bi-CNT/GCE SWASV 300 Pb2+ = 1.30 [52] Cd2+ = 0.70
Zn2+ = 12.0 Pb2+ , Cd2+ Bi nanopowder on
carbon
SWASV 180 Pb2+ = 0.15 [53]
Cd2+ = 0.07 Pb2+, Cd2+, Zn2+
Simultaneous Analysis
ERGO-PG-BiE SWASV 120 Pb2+ = 0.13 This Work Cd2+ = 0.10
Zn2+ = 0.25 Pb2+, Cd2+,Zn2+
Individual Analysis
ERGO-PG-BiE SWASV 120 Pb2+ = 0.12 This Work Cd2+ =0.09
[image:19.596.35.561.454.767.2]
3.2.11. Application to Tap Water Samples
Tap water samples were collected in our laboratory and analyzed for Zn2+, Cd2+ and Pb2+ ions using the electrochemically reduced graphene oxide modified bismuth film electrode (ERGO-PG-BiE). Both individual and simultaneous analysis was performed and the amount of metal ions present in the water samples were quantified by the standard additions method. None of the heavy metal ions were detected in the original tap water samples when using a deposition potential of 120 seconds suggesting that the concentration of the metal ions were below their detection limits. However, upon spiking tap water samples with 20 µg L-1
and 30 µg L-1 of each metal ion yielded good recovery percentages (Table 3) for the individual analysis of all three metals ions.
Table 3. Recovery percentages for Zn2+, Cd2+, and Pb2+, at the ERGO-PG-BiE in tap water samples using a deposition time of 120 seconds.
Simultaneous Analysis
Metal ion Original (µg L-1) Added (µg L-1)
Found (µg L-1)
RSD (%) Recovery (%)
Zn2+ ND 20 11.97 10.00 59.87
ND 30 20.61 1.49 68.69
Cd2+ ND 20 16.83 6.03 84.13
ND 30 28.51 2.17 95.03
Pb2+ ND 20 16.51 1.98 82.55
ND 30 34.79 4.02 96.32
Individual Analysis
Metal ion Original (µg L-1)
Added (µg L-1)
Found (µg L-1)
RSD (%) Recovery (%)
Zn2+ ND 20 21.15 6.48 89.11
ND 30 28.40 3.23 94.69
Cd2+ ND 20 17.89 5.57 89.43
ND 30 28.41 3.23 94.69
Pb2+ ND 20 17.43 2.63 87.17
ND 30 29.01 2.67 96.70
n = 3, where n is number of repetitive cycles performed ND, not detected
The recovery percentages for Cd2+ and Pb2+ obtained with simultaneous analysis were comparable those obtained with individual analysis however, the recoveries for Zn2+ ions was much lower. The lower recoveries for Zn can be largely attributed to errors arising from the distortion of the zinc oxidation peak current caused by hydrogen gas evolution.
A pertinent observation in Table 3 is the improved recovery percentages for metal ions obtained in tap water samples spiked with 30 µg L-1
[image:20.596.42.559.296.602.2]
highlights the fact that errors are enhanced when working with concentrations closer to the detection limit of the metal ions; these findings are similar to those reported by Yi et al. [48].
The results in Table 3 are satisfactory for water samples containing 20 – 30 µg L-1 of the metal ions whilst using a deposition potential of 120 seconds. However, in order to meet the United States Environmental Protection Agency’s (US EPA) maximum contaminant level (MCL) for zinc (5 mg L -1
), cadmium (0.005 mg L-1) and lead (0.015 mg L-1) in drinking water a longer deposition time of 360 seconds was required. Typical voltammograms obtained during the simultaneous analysis of heavy metal ions together with their corresponding standard addition curves is shown in Figure 17.
-0.9 -0.8 -0.7 -0.6 -0.5 -0.4 -0.3
4 8 12 16 20 24 28 32 36 40
(a) Pb
C
u
rr
e
n
t
(
A
)
Potential (V) Cd
Figure 17. Simultaneous analysis of tap water (pH 4.6) spiked with 5 µg L-1 of each of metal ion using a deposition time of 360 seconds. Square wave voltammograms (a) and corresponding standard addition calibration curves for Cd2+ (b) and (c) Pb2+.
[image:21.596.62.540.243.635.2]
Table 4. Recovery for the determination of Zn2+, Cd2+ and Pb2+ in tap water samples using ERGO-PG- BiE at 360 seconds.
Simultaneous Analysis
Metal ion Original (µg L-1)
Added (µg L-1)
Found (µg L-1)
RSD (%) Recovery (%)
Zn2+ ND 5 ND ND ND
Cd2+ ND 5 4.15 1.38 82.98
Pb2+ ND 5 5.21 2.02 104.19
Individual Analysis
Metal ion Original (µg L-1)
Added (µg L-1)
Found (µg L-1)
RSD (%) Recovery (%)
Zn2+ ND 5 ND ND ND
Cd2+ ND 5 5.19 2.74 103.80
Pb2+ ND 5 5.13 1.89 102.60
n = 3, where n is number of repetitive cycles performed ND, not detected
The recovery percentages obtained for the heavy metal ions ranged from 83 % and 104 % for Cd2+ and Pb2+, respectively with relative standard deviations within 5%. No Zn2+ was detected in the tap water sample at the 5 µg L-1
level nevertheless the ERGO-PG-BiE is capable of detecting Zn2+ well below the US EPA maximum contaminant level of 5 mg L-1. Furthermore, the results in Table 6 shows that the ERGO-PG-BiE in combination with square-wave anodic stripping voltammetry is suitable for monitoring trace levels of Zn2+, Cd2+ and Pb2+ in drinking water.
4. CONCLUSIONS
References
1. L. Sanita di Toppi and R. Gabbrielli, Environ. Exp. Bot., 41 (1999) 105
2. J. Wang, Stripping Analysis-Principles, Instrumentation and Application, VCH Publishers Inc., Deerfield Beach, FL, USA (1985)
3. R. Sharma and M. Agrawal, J. Environ. Biol., 26 (2005) 301
4. "Heavy Metals," LENNTECH, [Online]. Available: http://www.lenntech.com/heavymetals.htm. [Accessed: 10 November 2011].
5. J. Buffle and M. Tercier-Waeber, Trends Anal. Chem., 24 (2005) 172 6. X. Wang, T. Sato, B. Xing and S. Tao, Sci. Total Environ., 350 (2005) 28
7. C. Willemse, K. Tlhomelang, N. Jahed, P. Baker and E. Iwuoha, Sensors, 11 (2011) 3970 8. A. Ala, A. Walker, K. Ashkan, J. Dooley and M. Schilsky, The Lanchet, 369 (2007) 397 9. J. Li, S. Guoa, Y. Zhaia and E. Wanga, Anal. Chim. Acta, 649 (2009) 196
10.M. Goldcamp, M. Underwood, J. Cloud and S. Harshman, J. Chem. Educ., 85 (2008) 976 11.H. Xu, L. Zeng, S. Xing, Y. Xian, G. Shi and L. Jin, Electroanalysis, 24, no. 20 (2008) 2655 12.B. Claux and O. Vittori, Electroanalysis, 21, no. 19 (2007) 2243
13.G. Kefala, A. Economou, A. Voulgarapoulos and M. Sofooniou, Talanta, 61, (2003) 603 14.G. Long, L. Freedman and G. Doak, Encycl. Chem. Technol., (1978) 912
15.S. Zbeda, K. Pokpas, S. Titinchi, N. Jahed, P. Baker and E. Iwuoha, Int. J. Electrochem. Sci., 8 (2013) 11125
16.H. Yang, C. Shan, F. Li, Q. Zhang, D. Han and L. Niu, J. Mater. Chem., 19 (2009) 8856 17.D. Demetriades, A. Economou and A. Voulgaropoulos, Anal. Chim. Acta, 519 (2004) 167
18.F. Thema, M. Moloto, E. Dikio, N. Nyangiwe, L. Kotsedi, M. Maaza and M. Khenfouch, J. Chem., 2013 (2013)
19.J. Hass, W. de Heer and E. Conrad, J. Phys.: Condens. Matter, 20 (2008)
20.A. Erdem, H. Karadeniz and A. Caliskan, Electroanalysis, 21, no. 3-5 (2009) 464
21.M. Muti, S. Sharma, A. Erdem and P. Papakonstantiou, Electroanalysis, 23, no. 1 (2011) 272 22.J. Shen, Y. Hu, M. Shi, X. Lu, C. Qin, C. Li and M. Ye, Chem. Mater., 21 (2009) 3514 23.X. Lu, M. Yu, H. Huang and R. Ruoff, Nanotechnology, 10, no. 3 (1999) 269
24.C. Berger, Z. Song, X. Li, X. Wu, N. Brown and C. Naud, D. Mayou, T. Li, J. Hass, A.N. Marchenkov, E. H. Conrad, P.N. First and W. A. de Heer, Science, 312, no. 5777 (2006) 30 25.S. Stankovich, D. Dikin, R. Piner, K. Kohlhaas, A. Kleinhammes, Y. Jia, Y. Wu, S. Nguyen and R.
Ruoff, Carbon, (2007) 1558
26.L. Chen, Y. Tang, K. Wang, C. Liu and S. Luo, Electrochem. Commun., 13 (2011) 133 27.H. Guo, X. Wang, Q. Qian, F. Wang and X. Xia, ACS Nano, 3, no. 9 (2009) 2653
28.C. Su, A. Lu, Y. Xu, F. Chen, A. Khlobystov and L. Li, ACS Nano, 5, no. 3, (2011) 2332 29.Y. Shao, J. Wang, M. Engelhard, C. Wang and Y. Lin, J. Mater. Chem., 20 (2010) 743
30.V. Guzsvany, H. Nakajima, N. Soh, K. Nakano and T. Imato, Anal. Chim. Acta, 658 (2010) 12 31.S. Hocevar, Anal. Chem., 79, no. 22 (2007) 8639
32.J. Wang, A. Kawde and E. Sahlin, Analyst, 125 (2000) 5
33.W. Hummers and R. Offeman, J. Am. Chem. Soc., (1958) 1339
34.A. Bourlinos, D. Gournis, D. Petridis, T. Szabo, A. Szeri and I. Dekany, Langmuir, 19 (2003) 6050 35.W. Chen and L. Yan, Nanoscale, 2 (2010) 559
36.D. Marcano, D.V. Kosynkin, J.M. Berlin, A. Sinitskii, , Z. Sun, A. Slesarev, L.B. Alemany, W.Lu and J.M. Tour, ACS Nano, 4, no. 8 (2010) 4806
37.A. Eckmann, A. Felten, A. Mishchenko, L. Britnell, C. C. Krupke, K.S. Novoselov and C. Casiraghi, ACS Nano, 12 (2012) 3925
38.Y. Zhu, S. Murali, W. Cai, X. Li, J. Won Suk, J.R. Potts and R.S. Ruoff, Adv. Mater., 22 (2010) 3906
41.D. Chen, H. Feng and J. Li, Chem. Reviews, 112 (2012) 6027
42.D. Zhang, X. Zhang, Y. Chen, C. Wang and Y. Ma, Electrochim. Acta, 69 (2012) 364 43.S. Stankovich, R.D. Piner and S.T.Nguyen, R.S. Ruoff, Carbon, 44 (2006) 3342 44.J. Allen, V. Tung and R. Kaner, Chem. Reviews, 110 (2010) 132
45.Y. Shao, J. Wang, H. Wu, J. Liu, I. Aksay and Y. Lin, Electroanalysis, 10 (2010) 1027 46.A. Geim and K. Novoselov, Nat. Mater., 6 (2007) 183
47.W. Lu, P. Soukiassian and J. Boecki, "MRS Bulletin-Volume 37, Number 12," 2012. [Online]. Available: www.onlinedigeditions.com. [Accessed 15 August 2013].
48.W. Yi, Y. Li, G. Ran, H. Luo and N. Li, Microchim. Acta, 179 (2012) 171 49.F. Torma, M. Kadar, K. Toth and E. Tatar, Anal. Chim. Acta, 619 (2008) 173
50.I. Svancara, L. Baldrianova, E. Tesarova, S. Hocevar, S. Elsuccary, A. Economou, S. Sotiropoulos, Ogorevc and K. B. Vytras, Electroanalysis, 18 (2006) 177
51.D. Li, J. Jia and J. Wang, Talanta, 83 (2010) 332
52.G. Wang, W. Han, J. Park and S. Kang, Talanta, 76 (2008) 301-308 53.G. Lee, H. Lee and C. Rhee, Electrochem. Comm., 9 (2007) 2514

![Figure 5. HRTEM images showing selected features of Graphite [(a) and (b)] and Graphene Oxide [(c) and (d)]](https://thumb-us.123doks.com/thumbv2/123dok_us/1895816.147390/8.596.130.489.430.718/figure-hrtem-images-showing-selected-features-graphite-graphene.webp)