Int. J. Electrochem. Sci., 10 (2015) 2755 - 2763
International Journal of
ELECTROCHEMICAL
SCIENCE
www.electrochemsci.org
An Interference Study with Different Working Potentials for an
Amperometric Glucose Sensor
Kuo-Chiang Lin, Cheng-Yu Yang, Shen-Ming Chen*,Dou-Han Zhao, Yu-Shen Hou
Electroanalysis and Bioelectrochemistry Lab, Department of Chemical Engineering and
Biotechnology, National Taipei University of Technology, No.1, Section 3, Chung-Hsiao East Road, Taipei 106, Taiwan (ROC).
*
E-mail: [email protected]
Received: 20 November 2014 / Accepted: 29 December 2014 / Published: 19 January 2015
The correlation between working potential and amperometric response using an amperometric glucose sensor was investigated by amperometry. Influence of some potential interferents including bilirubin, creatinine, and uric acid was studied in real human blood samples. The test strips can provide correct glucose concentration values for an amperometric glucose sensor in the absence of interferents. The influence of interferents with different working potentials from +0.3 V to +0.7 V was considered based on average glucose values and coefficient of variation (CV). It shows low deviation at +0.5 V and +0.7 V for average glucose values and low CV values at +0.4 V for coefficient of variation. Optimization of working potentials can be further considered for various amperometric glucose sensors in the literature by the simple method.
Keywords: Glucose sensor, Amperometry, Bilirubin, Creatinine, Uric acid, Working potential
1. INTRODUCTION
Since Clark and Lyons pioneered the development of oxygen electrode-based enzyme electrodes in 1962 [1], enormous efforts have been devoted over the last 50 years to develop cost effective glucose biosensors with good sensitivity and stability [2–5]. Up to date, amperometric [6,7], potentiometric [8,9], coulometric [5], and impedimetric [10,11] glucose biosensors have been developed. The amperometric glucose biosensors are poised to play a leading role in blood glucose monitoring owing to its simplicity and easy-to-use methodology.
oxidized at the electrode, forming gluconolactone and hydrogen peroxide. The concentration of glucose can be determined by detecting the amount of hydrogen peroxide generated at the electrode. However, they may not function effectively for oxygen deficient blood samples and the interference caused by electroactive species in the blood, such as ascorbic acid, uric acid, and countless other drugs which could be present in the blood [12]. In the second generation sensors, a mediator was proposed to serve as both a replacement to the first generation mediator—oxygen—and as an enhancement for the electron transport process. This kind of sensors consisted of an immobilized enzymatic catalyst, glucose oxidase (GOx), on an artificial mediator. Various materials such as ferrocene derivatives and ferricyanide have been used as the artificial mediators [12]. In the third generation sensors, efforts were made to transfer the electron directly from the enzyme to the electrode. Some materials have been chosen as the substrate for immobilization of the GOx, since the enhanced surface area of electrode surface can increase the electron transfer rate [15,16]. They still suffered from the limitations arising from the dependency of enzyme’s activity on the temperature, humidity, interference, etc. Moreover, some additional problems were encountered because the electron transfer process was inhibited by the thick enzyme layer [12,13,16]. The problems associated with enzyme based glucose sensors have steered researchers to explore enzyme-free detection, which allow glucose to be oxidized directly on the electrode surface. Nonenzymatic glucose sensors constitute the fourth generation of glucose sensor technology. The related researches are going on all around the world, as evidenced by the exponential increase in the number of publications over recent years.
Although lots of works reported to novel materials to improve the performance of glucose sensors, it’s seldom to mention about the control of working potential applied to investigate the interference for a glucose sensor. In this work, different working potentials were applied to study the influence on an amperometric glucose sensor. The data were analyzed to understand the correlation between the working potentials and interference. The interference was determined by the average glucose concentration and the coefficient of variation (CV).
2. MATERIALS AND METHODS 2.1. Reagents
D-(+)-Glucose, uric acid, bilirubin, creatinine, glucose oxidase, and palladium(II) chloride were purchased from Sigma-Aldrich (USA). All other chemicals (Merck) used were of analytical grade (99%). Double distilled deionized water was used to prepare all the solutions. A phosphate buffer solution (PBS) of pH 7 was prepared using Na2HPO4 (0.05 M) and NaH2PO4 (0.05 M).
2.2. Apparatus
2.3. Preparation of glucose test strips
The glucose test strips were prepared using pH 7 PBS containing 1×10⁻³ M PdCl2, 1 mg ml-1
glucose oxidase, and 1×10⁻³ M K4Fe(CN)6. Then, the strips were dried out in the oven at the
temperature of 40 ℃. Hereafter, the glucose test strips were stored in refrigerator at the temperature of 4 ℃ before use.
3. RESULTS AND DISCUSSION
3.1. Cyclic voltammograms of glucose test strips
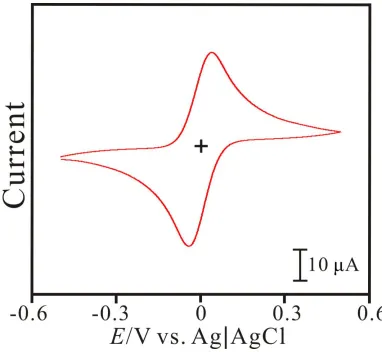
Fig. 1 depicts the typical cyclic voltammogram of potassium ferrocyanide using a palladium electrode in pH 7. It shows an obvious redox couple (E0’ = -0.002 V) with one anodic peak (Epa =
+0.039 V) and one cathodic peak (Epc = -0.042 V). It presents the redox processes of Fe(II)(CN)6
4-/Fe(III)(CN)63- involving one electron transfer. The peak-to-peak separation is estimated in 81 mV,
indicating the fast electron transfer process due to the quasi-reversible electron transfer process. This result might suggest the K4Fe(II)(CN)6 as an ideal redox mediator.
[image:3.596.122.504.365.717.2]
Fig. 2 displays the voltammograms of glucose test strips examined in human blood with [Glucose] = (a) 96.3 mg dL-1 and (b) 485 mg dL-1, respectively. At low concentration of glucose, curve (a) shows an obvious redox couple (E0’ = -0.014 V) with one anodic peak at Epa = +0.12 V and one
cathodic peak at Epc = -0.148 V in the scan cycle. It has a peak-to-peak separation of ΔEp = 0.268 V.
At high concentration of glucose, it can be seen that curve (b) shows E0’ = -0.015 V, Epa = +0.15 V, Epc
= -0.18 V with a larger peak-to-peak separation (ΔEp = 0.33 V). One can know that the peak-to-peak
separation is becoming large with the increase of glucose concentration. This result indicates the electron transfer is prolonged at high glucose concentration. This phenomenon can be explained as diffusion effect for the Fe(CN)64-/Fe(CN)63- redox processes. One can know that the current response
might vary with different working potential especially for an amperometric glucose sensor. By the result, it’s necessary to further investigating the correlation between current response and working potential.
Figure 2. Cyclic voltammograms of K-Jump glucose test strips examined in human blood with [Glucose] = (a) 96.3 mg dL-1 and (b) 485 mg dL-1. Scan rate = 0.1 Vs-1.
3.2. Amperometric response of glucose test strips with different working potentials
[image:4.596.113.479.284.615.2]
Figure 3. Amperograms of glucose test strips examined in human blood with [Glucose] = (a) 96.3 mg dL-1 and (b) 485 mg dL-1. Eapp. = +0.7 V.
Fig. 3 displays the amperograms of glucose test strips in human blood with different glucose concentrations. Both curve (a) and curve (b) show obvious curves bending to an asymptote line in three seconds. Furthermore, the current level is dependent on the glucose concentration. It indicates that the current value of the curve end can be provided for quantification of glucose concentration. However, some potential interferents should be further considered in the same time. Fig. 4-6 shows the amperograms of glucose test strips in human blood with different glucose concentrations in the presence of bilirubin, creatinine, and uric acid, respectively. One can know that the current values of the curve ends are slightly different. The result might indicate the influence of different potential interferents. It also provides a chance to investigate the interference caused by different interferents. Therefore, the follow-up experiments can be designed to discuss the correlation between current response and different interferents. The data of current responses with different interferents and working potentials can be further analyzed for interference study by mean values and correlation of variation.
[image:5.596.173.423.527.721.2]
Figure 5. Amperograms of K-Jump glucose test strips examined human blood in the presence of 2.5 mg dL-1 creatinine with [Glucose] = (a) 96.3 mg dL-1 and (b) 485 mg dL-1. Eapp. = +0.7 V.
Figure 6. Amperograms of K-Jump glucose test strips examined human blood in the presence of 10 mg dL-1 bilirubin with [Glucose] = (a) 96.3 mg dL-1 and (b) 485 mg dL-1. Eapp. = +0.7 V.
[image:6.596.156.439.68.287.2] [image:6.596.155.439.351.570.2]
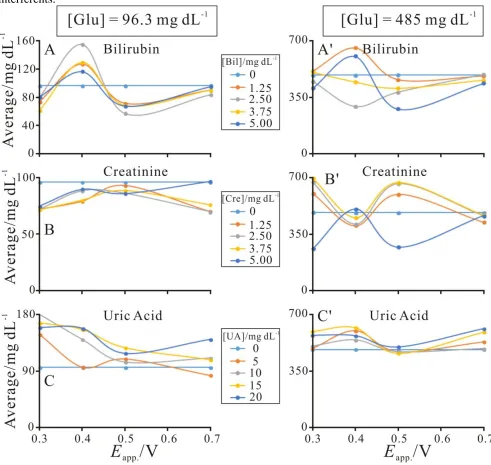
it exhibits a flat average line for different working potentials. The result indicates that the glucose test strips are very stable to present correct glucose values. However, the average glucose values vary with different working potentials in the presence of interferents. At low concentration of 96.3 mg dL-1, the most deviation from 96.3 mg dL-1-line is observed at 0.7 V, 0.5 V, and 0.5 V for bilirubin, creatinine, and uric acid, respectively. At high concentration of 485 mg dL-1, the most deviation from 485 mg dL-1
-line is observed at 0.7 V, 0.7 V (0.4 V), and 0.5 V for bilirubin, creatinine, and uric acid, respectively. By the results, 0.7 V and 0.5 V can be suggested as the better working potential. Further considering the related work [17], Johnson et al. claimed that an implanted glucose sensor was greatly minimized by reducing the applied potential from +0.6 V to +0.35 V. Therefore, 0.4 V can be another choice as a working potential for minimizing the current contribution from electrooxidizable interferents.
[image:7.596.52.543.252.717.2]
The correlation of variation with various working potentials was also analyzed for a glucose test strips. Fig. 8 shows the coefficient of variation (CV) estimated using amperometric glucose test strips applied different potentials in human blood with various interferents (n = 5). At low concentration of 96.3 mg dL-1, the lowest CV value is observed at 0.4 V, 0.4 V, and 0.4 V for bilirubin, creatinine, and uric acid, respectively. At high concentration of 485 mg dL-1, the most deviation from 485 mg dL-1-line is observed at 0.3 V, 0.3 V (0.4 V), and 0.4 V for bilirubin, creatinine, and uric acid, respectively. By the results, 0.4 V can be suggested as the better working potential.
As above results, the glucose test strips can show good average glucose values in the absence of interferents including bilirubin, creatinine, and uric acid. The influence of the interferents can be adjusted by control different working potential for an amperometric glucose sensor.
[image:8.596.53.541.265.726.2]
4. CONCLUSIONS
The glucose test strips have been successfully prepared by a simple method. The work is mainly focused on the correlation between working potentials and interference. It is mainly focused on the interference tests in real human blood serum samples regarding to different working potentials. The test strips can provide correct glucose concentration values for an amperometric glucose sensor in the absence of interferents. The influence of interferents on the test strips can be optimized with suitable working potentials for an amperometric sensor. It shows low deviation of average glucose values and low CV values for some specific working potentials. Optimization of working potentials can be provided for various amperometric glucose sensors in the literature by the simple method.
ACKNOWLEDGEMENTS
We acknowledge K-Jump© Health Co. and the Ministry of Science and Technology (Project No. 101-2113-M-027-001-MY3), Taiwan.
References
1. L.C. Clark, C. Lyons, Ann. N. Y. Acad. Sci., 102 (1962) 29–45.
2. C. Malitesta, F. Palmisano, L. Torsi, P.G. Zambonin, Anal. Chem., 62 (1990) 2735–2740. 3. S. Zhang, G. Wright, Y. Yang, Biosens. Bioelectron., 15 (2000) 273–282.
4. D.J. Shirale, V.K. Gade, P.D. Gaikwad, P.A. Savale, H.J. Kharat, K.P. Kakde, A.J.Pathan, M.D. Shirsat, Int. J. Electrochem. Sci., 1 (2006) 62–70.
5. A. Heller, B. Feldman, Acc. Chem. Res., 43 (2010) 963–973.
6. Z.Q. Gao, F. Xie, M.S.M. Arshad, J.Y. Ying, Sens. Actuators B: Chem., 111 (2005) 339–346. 7. L.Y. Jiang, H.M. Liu, J. Liu, Q.D. Yang, X.X. Cai, J. Electroanal. Chem., 619 (2008) 11–16. 8. B.K. Sohn, B.W. Cho, C.S. Kim, D.H. Kwon, Sens. Actuators B: Chem., 41 (1997) 7–11. 9. A. Fulati, S.M.U. Ali, M.H. Asif, N.U.H. Alvi, M. Willander, C. Brännmark, P. Strål-fors, S.I.
Börjesson, F. Elinder, B. Danielsson, Sens. Actuators B: Chem., 150 (2010) 673–680. 10. R.K. Shervedani, A.H. Mehrjardi, N. Zamir, Bioelectrochemistry, 69 (2006) 201–208.
11. D. Zane, G.B. Appetecchi, C. Bianchini, S. Passerini, A. Curulli, Electroanalysis, 23 (2011) 1134– 1141.
12. Z. Zhu, L.G. Gancedo, A.J. Flewitt, H. Xie, F. Moussy, W.I. Milne, Sensors, 12 (2012) 5996. 13. K.E. Toghill, R.G. Compton, Int. J. Electrochem. Sci., 5 (2010) 1246.
14. J. Wang, J. Pharm. Biomed. Anal., 19 (1999) 47.
15. S. Park, H. Boo, T.D. Chung, Anal. Chim. Acta., 556 (2006) 46.
16. M.M. Rahman, A.J.S. Ahammad, J.H. Jin, S.J. Ahn, J.J. Lee, Sensors, 10 (2010) 4855. 17. K.K. Johnson, N. Bryan-Poole, J.J. Mastrototaro, Electroanalysis, 6 (1994) 321.
![Figure 2. Cyclic voltammograms of K-Jump glucose test strips examined in human blood with [Glucose] = (a) 96.3 mg dL-1 and (b) 485 mg dL-1](https://thumb-us.123doks.com/thumbv2/123dok_us/1883562.145696/4.596.113.479.284.615/figure-cyclic-voltammograms-glucose-strips-examined-blood-glucose.webp)
![Figure 3. Amperograms of glucose test strips examined in human blood with [Glucose] = (a) 96.3 mg dL-1 and (b) 485 mg dL-1](https://thumb-us.123doks.com/thumbv2/123dok_us/1883562.145696/5.596.179.416.69.236/figure-amperograms-glucose-strips-examined-human-blood-glucose.webp)
![Figure 5. Amperograms of K-Jump glucose test strips examined human blood in the presence of 2.5 mg dL-1 creatinine with [Glucose] = (a) 96.3 mg dL-1 and (b) 485 mg dL-1](https://thumb-us.123doks.com/thumbv2/123dok_us/1883562.145696/6.596.156.439.68.287/figure-amperograms-glucose-strips-examined-presence-creatinine-glucose.webp)