Int. J. Electrochem. Sci., 10 (2015) 2088 - 2097
International Journal of
ELECTROCHEMICAL
SCIENCE
www.electrochemsci.orgElectrooxidation of Phenol at Palladium-Based Catalyst
Materials in Alkaline Solution
Boguslaw Pierozynski*, Tomasz Mikolajczyk, Grazyna Piotrowska
Department of Chemistry, Faculty of Environmental Management and Agriculture, University of Warmia and Mazury in Olsztyn, Plac Lodzki 4, 10-957 Olsztyn, Poland
*
E-mail: [email protected]; [email protected]
Received: 1 December 2014 / Accepted: 9 January 2015 / Published: 19 January 2015
This paper reports on kinetics of phenol electrooxidation reaction (PhER), examined on large surface area Pd-modified nickel foam electrode and comparatively on Pd wire surface in 0.1 M NaOH supporting electrolyte. The kinetics of PhER were monitored through potential-dependent, a.c. impedance-recorded values of charge-transfer resistance and capacitance parameters, also in relation to an important step of phenol molecule electrosorption on the catalyst surface.
Keywords: Phenol electrooxidation; PhER; Electrosorption of phenol; Pd-modified Ni foam; Electrochemical impedance spectroscopy.
1. INTRODUCTION
Electrochemical oxidation is one of the most attractive methods to be employed for the degradation of phenolic compounds, chemicals that present severe toxicity to industrially-produced (e.g. by refineries or drug manufacturing plants) wastewaters [1-9]. Previous studies involved examination of electrooxidation of numerous phenolic chemicals on a number of anode materials, including: noble/semi-noble (Pt, Ir, Ru) and transitional metals (Ti, Sb, Sn, Pb), their oxides and mutual compositions for variable physical and chemical conditions [1, 6, 8, 9-11].
from this laboratory, concerning the kinetics of hydrogen evolution reaction at carbon fibre and nickel-coated carbon fibre-based catalysts [16-20].
2. EXPERIMENTAL
0.1 M NaOH supporting solution was prepared from AESAR, 99.996 % NaOH pellets and ultra-pure water provided by the Direct-Q3 UV water purification system from Millipore (18.2 M cm water resistivity). Phenol concentration (Sigma-Aldrich, >99 %) was on the order of 1.2×10⁻² M. An electrochemical cell, made of Pyrex glass, was used during the course of this work. The cell comprised three electrodes: a Pd-modified Ni foam (at ca. 0.2 wt.% Pd) or a Pd wire (0.5 mm diameter, 99.9 % purity, Aldrich) working electrode (WE) in a central part, a reversible Pd (also 0.5 mm diameter wire of 99.9 % purity, Aldrich) hydrogen electrode (RHE) as reference and a Pt (1.0 mm diameter wire, 99.9998 % purity, Johnson Matthey, Inc.) counter electrode (CE), both placed in separate compartments (see details on the procedures for cleaning the cell and preparation of electrodes in Ref. 15).
Electrochemical a.c. impedance spectroscopy and cyclic voltammetry techniques were employed in this work. All measurements were performed at room temperature by means of the Solartron 12,608 W Full Electrochemical System, consisting of 1260 frequency response analyzer (FRA) and 1287 electrochemical interface (EI). The impedance experiments were carried-out at an a.c. signal of 5 mV and the frequency was swept between 1.0105 and 0.510-1
Hz, whereas CV measurements were performed at a sweep-rate of 50 mV s-1. The instruments were controlled by ZPlot 2.9 (Corrware 2.9) software for Windows (Scribner Associates, Inc.), where data analysis was performed with ZView 2.9 (Corrview 2.9) software package. The impedance spectra were fitted by means of a complex, non-linear, least-squares immitance fitting program, LEVM 6, written by J.R. Macdonald [21]. Finally, spectroscopic characterization of Pd-activated Ni foam electrodes was performed by means of Quanta FEG 250 scanning electron microscope (SEM).
3. RESULTS AND DISCUSSION
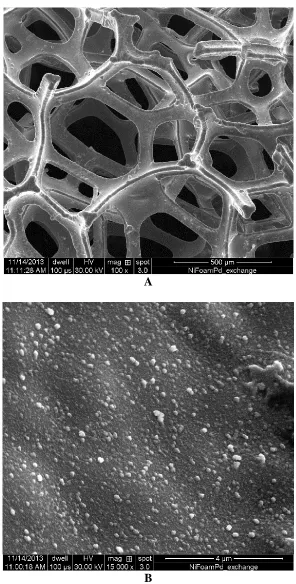
Figs. 1a and 1b illustrate the effect of spontaneous deposition of Pd at a low level (ca. 0.2 wt.% Pd) on the MTI-manufactured nickel foam, recorded for the magnifications of 100× and 15,000×, respectively. Thus, at the magnification of 15,000×, high-density of homogeneously distributed small Pd nuclei could explicitly be seen in Fig. 1b. In addition, the powder XRD-calculated average Pd grain size value came to 7 nm (see Ref. 15 again for details).
oxidized to produce p/o-hydroquinone species, finally leading to oxidative destruction of the aromatic ring [1, 3, 4, 6, 9].
A
B
[image:3.596.150.446.125.709.2]
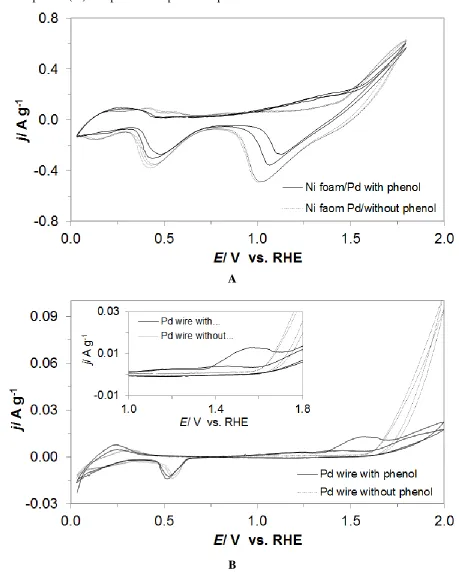
Then, a broad cathodic feature is observed (Fig. 2a), both in the absence and presence of phenol in solution. This reduction feature, detected in the CV profiles over the potential range ca. 0.8-1.3 V, corresponds to the reduction of Ni(II) oxidation products [22], in reference to an onset of the surface oxidation process(es) that proceeds at potentials positive to 1.5 V.
A
B
[image:4.596.66.525.136.710.2]
Moreover, another reduction peak, observed in Fig. 2a over the potential range ca. 0.3-0.7, refers to the reduction of Pd surface oxides [23], formed during an anodic voltammetric sweep, at the potential range: 1.5-1.8 V vs. RHE. In addition, voltammetric features observed on the Pd-activated Ni foam electrode for the potentials just positive to the reversible potential are characteristic of significantly inhibited, reversible H UPD (hydrogen underpotential deposition) process at this electrode surface (Fig. 2a).
Figure 3. Schematic representation of electrochemical phenol degradation processes [1, 3-6, 9].
[image:5.596.174.428.199.385.2]
B
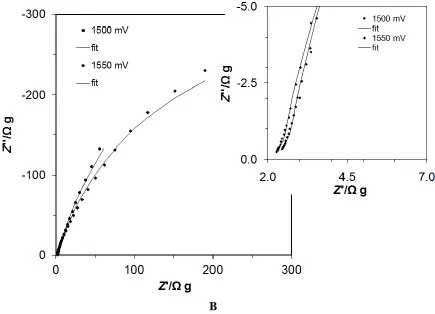
Figure 4. a) Complex-plane impedance plots for phenol electrooxidation on Pd-modified Ni foam electrode surface in contact with 0.1 M NaOH solution, recorded at room temperature for the stated potential values vs. RHE. The solid lines correspond to representation of the data according to equivalent circuit model shown in Fig. 5b; b) As in (a), but for Pd wire electrode.
Similar voltammetric behaviour was recorded on a Pd wire electrode, studied under analogous experimental conditions (see Fig. 2b), where a very-well pronounced PhER anodic feature is observed over the potential range: 1.4-1.7 V (also, see inset to Fig. 2b). However, in contrast to the behaviour derived at the Pd-modified Ni foam electrode, the Pd wire-produced voltammetric profiles are characterized by radically lower current-densities and apparent lack of the cathodic band that is otherwise responsible for the reduction of the Ni(II) oxidation products (Fig. 2a). Interestingly, the Pd surface oxidation process (see Fig. 2b again) in the absence of phenol proceeds at dramatically higher current-densities than that in the presence of C6H5OH (contrast to the behaviour recorded at the Pd-activated Ni foam electrode).
The a.c. impedance characterization of the phenol electrooxidation process on the Pd-modified nickel foam and the Pd wire electrode surfaces, in contact with 0.1 M NaOH solution, is shown in Figs. 4a and 4b, and in Table 1.
[image:6.596.85.520.74.388.2]
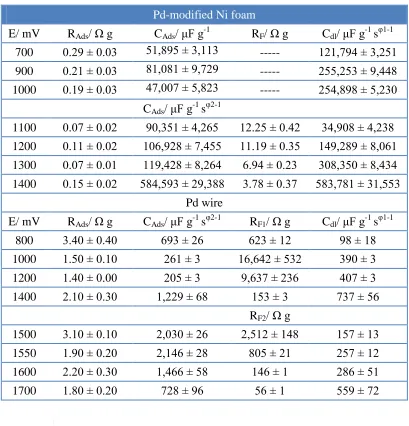
Table 1. Resistance and capacitance parameters for the processes of phenol electrosorption and electrooxidation (at 1.2×10⁻² M) on Pd-modified Ni foam and Pd wire electrode surfaces in contact with 0.1 M NaOH solution (at room temperature), obtained by fitting the equivalent circuits shown in Figs. 5a and 5b to the experimentally-obtained impedance data.
Pd-modified Ni foam
E/ mV RAds/ Ω g CAds/ μF g-1 RF/ Ω g Cdl/ μF g-1 sφ1-1 700 0.29 ± 0.03 51,895 ± 3,113 --- 121,794 ± 3,251 900 0.21 ± 0.03 81,081 ± 9,729 --- 255,253 ± 9,448 1000 0.19 ± 0.03 47,007 ± 5,823 --- 254,898 ± 5,230
CAds/ μF g-1 s φ2-1
1100 0.07 ± 0.02 90,351 ± 4,265 12.25 ± 0.42 34,908 ± 4,238 1200 0.11 ± 0.02 106,928 ± 7,455 11.19 ± 0.35 149,289 ± 8,061 1300 0.07 ± 0.01 119,428 ± 8,264 6.94 ± 0.23 308,350 ± 8,434 1400 0.15 ± 0.02 584,593 ± 29,388 3.78 ± 0.37 583,781 ± 31,553
Pd wire
E/ mV RAds/ Ω g CAds/ μF g-1 sφ2-1 RF1/ Ω g Cdl/ μF g-1 sφ1-1
800 3.40 ± 0.40 693 ± 26 623 ± 12 98 ± 18
1000 1.50 ± 0.10 261 ± 3 16,642 ± 532 390 ± 3
1200 1.40 ± 0.00 205 ± 3 9,637 ± 236 407 ± 3
1400 2.10 ± 0.30 1,229 ± 68 153 ± 3 737 ± 56
RF2/ Ω g
1500 3.10 ± 0.10 2,030 ± 26 2,512 ± 148 157 ± 13
1550 1.90 ± 0.20 2,146 ± 28 805 ± 21 257 ± 12
1600 2.20 ± 0.30 1,466 ± 58 146 ± 1 286 ± 51
1700 1.80 ± 0.20 728 ± 96 56 ± 1 559 ± 72
[image:7.596.94.503.135.561.2]
B
Figure 5. a) Equivalent circuit model for electrosorption of phenol on Pd-modified Ni foam electrode surface. The circuit exhibits a Faradaic adsorption pseudocapacitance, CAds, charged via a Faradaic electrosorption resistance, RAds in a parallel combination with the double-layer capacitance, Cdl (represented as the CPE), jointly in series with an uncompensated solution resistance, RS and; b) Equivalent circuit model for electrooxidation of phenol on Pd-modified Ni foam and Pd wire electrode surfaces, in the presence of adsorbed reaction intermediate. The circuit exhibits a Faradaic charge-transfer resistance, RF, the rate of adsorption (or desorption) of phenol (RAds) and the component which contains the contribution of the surface coverage of the adsorbed intermediate, CAds (represented here as the constant phase element - CPE). The above components are in a parallel combination with the double-layer capacitance, Cdl (also shown as the constant phase element), jointly in series with an uncompensated solution resistance, RS.
Thus, it is supposed that the impedance behaviour recorded for the potentials: 700-1000 mV represents phenol electrosorption reaction on the catalyst surface (see an equivalent circuit model in Fig. 5a). So, the charge-transfer resistance, RAds (0.29-0.19 g) and adsorption pseudocapacitance, CAds (81,081-47,007 µF g-1) parameters correspond to the process of phenol electrosorption [24] on the Pd-modified Ni foam surface (see Table 1). Furthermore, the recorded double-layer capacitance, Cdl parameter values oscillated between 121,794 and 255,253 μF g-1 sφ1-1. However, when a commonly used value of 20 F cm-2 in literature is taken as the Cdl value for smooth and homogeneous surfaces [25, 26] along with electrode mass of ca. 35.0 mg, an electrochemically active surface area of the Pd-activated Ni foam could be estimated at about 213 cm2 (at 700 mV), which corresponds to 6,086 cm2 g-1. In addition, the CPE-modified (constant phase element) equivalent circuit model (Fig. 5a) was used to derive the Cdl parameter values in this work. The CPE (capacitance dispersion) behaviour is typically observed in case of inhomogeneous surfaces, displaying surface defects and porosity [27-29]. Dimensionless φ1 and φ2 parameters (Table 1), which determine the constant phase angle in the complex-plane plot (0≤φ≤1) of the CPE circuit, varied between 0.80 and 0.95.
[image:8.596.113.492.73.278.2]
semicircles (see Figs. 4a and 5b), where a smaller, high frequency semicircle corresponds to the process of phenol electrosorption (inset to Fig. 4a), while a large diameter one refers to the Faradaic phenol oxidation reaction. Hence, the charge-transfer resistance, RF parameter (Table 1) corresponds to the oxidation process of phenol on the catalyst surface. The RF resistance reaches its minimum value of 3.78 g (at 1400 mV), which is close to the voltammetric’s peak current-density value in Fig. 2a. On the other hand, the recorded RAds and CAds adsorption parameters ranged from 0.07 to 0.15 g and from 90,351 to 584,593 μF g-1
sφ2-1, correspondingly. In addition, the Cdl parameter values varied between 34,908 and 583,781 μF g-1
sφ1-1. A dramatic increase of both capacitance components, recorded at the most positive potential value (1400 mV vs. RHE), most likely results from the presence of additional adsorption components that emerge during a sequence of phenol oxidation steps.
On the other hand, the impedance behaviour of the Pd wire electrode is entirely based on the two-semicircle equivalent circuit model, presented in Fig. 5b. Hence, the adsorption charge-transfer resistance, RAds and capacitance, CAds parameters oscillated between 1.40 and 3.40 g, and 205 and 2,146 μF g-1 sφ2-1, correspondingly for the potentials: 800 through 1700 mV. Most importantly, two phenol oxidation steps could clearly be identified for the palladium wire catalyst. Thus, an initial oxidation step (a single-electron charge-transfer step producing a phenoxy radical cation) covers the potential range ca. 800-1400 mV with the RF1 resistance values of 623 g (at 800 mV) and 153 g at 1400 mV (see inset to Fig. 2b). Then, RF2 resistance parameter (ranging from 2,512 g at 1500 mV to 56 g at 1700 mV) in Table 1 corresponds to a subsequent step of the PhER (see Figs. 2b and 4b, and Fig. 3 for details on the phenol oxidation scheme). Finally, a ratio of the charge-transfer resistance parameter values, recorded at 1400 mV for the Pd-wire and the Pd-activated Ni foam electrodes, came to about 40× while an analogous ratio of the Cdl parameter values reached 0.001× (see Table 1 for details). As the surface of nickel foam is only partially covered by the Pd deposits (Fig. 1b), a radical enhancement of the catalytic activity for the Pd-activated Ni foam (as compared to that of the Pd wire electrode) must be a result of extended modification of the catalyst’s surface area by the Pd nanoparticle nuclei.
4. CONCLUSIONS
References
1. R.A. Torres, W. Torres, P. Peringer and C. Pulgarin, Chemosphere, 50 (2003) 97. 2. D. Rajkumar and K. Palanivelu, J. Hazard. Mater., B113 (2004) 123.
3. C. Pirvu, A. Banu, O. Radovici and M. Marcu, Rev. Roum. Chim., 53(11) (2008) 1007. 4. G. Lv, D. Wu and R. Fu, J. Hazard. Mater., 165 (2009) 961.
5. X. Yang, J. Kirsch, J. Fergus and A. Simonian, Electrochim. Acta, 94 (2013) 259. 6. X. Li, Y. Cui, Y. Feng, Z. Xie and J. Gu, Water Res., 39 (2005) 1972.
7. H. Ma, X. Zhang, Q. Ma and B. Wang, J. Hazard. Mater., 165 (2009) 475.
8. M. Li, C. Feng, W. Hu, Z. Zhang and N. Sugiura, J. Hazard. Mater., 162 (2009) 455. 9. C. Zhang, Y. Jiang, Y. Li, Z. Hu, L. Zhou and M. Zhou, Chem. Eng. J., 228 (2013) 455. 10. S. Andreescu, D. Andreescu and O.A. Sadik, Electrochem. Commun., 5 (2003) 681. 11. G. Arslan, B. Yazici and M. Erbil, J. Hazard. Mater., B124 (2005) 37.
12. T. Mikolajczyk, M. Turemko and B. Pierozynski, J. Electroanal. Chem., 735 (2014) 32. 13. B. Pierozynski, T. Mikolajczyk and M. Turemko, Electrocatalysis, DOI
10.1007/s12678-014-0231-0.
14. B. Pierozynski and T. Mikolajczyk, Electrocatalysis, DOI 10.1007/s12678-014-0216-z.
15. B. Pierozynski, T. Mikolajczyk and I.M. Kowalski, J. Power Sources, 271 (2014) 231. 16. B. Pierozynski, Int. J. Hydrogen Energy, 38 (2013) 7733.
17. B. Pierozynski, I.M. Kowalski, T. Mikolajczyk and M. Turemko, Int. J. Electrochem. Sci., 8 (2013) 12264.
18. T. Mikolajczyk and B. Pierozynski, Int. J. Electrochem. Sci., 8 (2013) 11823. 19. B. Pierozynski and I.M. Kowalski, Int. J. Electrochem. Sci., 8 (2013) 7938. 20. B. Pierozynski and T. Mikolajczyk, Int. J. Electrochem. Sci., 7 (2012) 9697.
21. J.R. Macdonald, Impedance spectroscopy, emphasizing solid materials and systems, New York: John Wiley & Sons (1987).
22. M. Grdeń and A. Czerwiński, J. Solid State Electrochem., 12 (2008) 375.
23.E. Verlato, S. Cattarin, N. Comisso, A. Gambirasi, M. Musiani and L. Vazquez-Gomez, Electrocatalysis, 3 (2012) 48.
24.T. Bejerano, Ch. Forgacs and E. Gileadi, J. Electroanal. Chem., 27 (1970) 69. 25.A. Lasia and A. Rami, J. Applied Electrochem., 22 (1992) 376.
26.L. Chen and A. Lasia, J. Electrochem. Soc., 138(11) (1991) 3321. 27. T. Pajkossy, J. Electroanal. Chem., 364 (1994) 111.
28. B.E. Conway, Impedance Spectroscopy. Theory, Experiment, and Applications, Barsoukov, E. & Macdonald, J.R. (Eds.), Wiley-Interscience, John Wiley & Sons, Inc., Hoboken, N.J., 4.5.3.8 (2005) 494.
29. W.G. Pell, A. Zolfaghari and B.E. Conway, J. Electroanal. Chem., 532 (2002) 13.
![Figure 3 . Schematic representation of electrochemical phenol degradation processes [1, 3-6, 9]](https://thumb-us.123doks.com/thumbv2/123dok_us/1882399.145547/5.596.174.428.199.385/figure-schematic-representation-electrochemical-phenol-degradation-processes.webp)