This is a repository copy of
Foundation Relative Stiffness Effects in Sand under Static
Loading
.
White Rose Research Online URL for this paper:
http://eprints.whiterose.ac.uk/151035/
Version: Accepted Version
Proceedings Paper:
Jahanger, ZK, Antony, SJ orcid.org/0000-0003-1761-6306 and Hirani, A (Accepted: 2019)
Foundation Relative Stiffness Effects in Sand under Static Loading. In: AIP Conference
Proceedings (IConMEAS 2019). 2nd International Conference on Materials Engineering &
Science (IConMEAS 2019), 25-26 Sep 2019, Baghdad, Iraq. AIP Publishing . (In Press)
This is an author produced version of a conference paper accepted for presentation at the
2nd International Conference on Materials Engineering & Science (IConMEAS 2019).
Uploaded in accordance with the publisher's self-archiving policy.
[email protected] https://eprints.whiterose.ac.uk/
Reuse
Items deposited in White Rose Research Online are protected by copyright, with all rights reserved unless indicated otherwise. They may be downloaded and/or printed for private study, or other acts as permitted by national copyright laws. The publisher or other rights holders may allow further reproduction and re-use of the full text version. This is indicated by the licence information on the White Rose Research Online record for the item.
Takedown
If you consider content in White Rose Research Online to be in breach of UK law, please notify us by
1
Foundation Relative Stiffness Effects in Sand under Static
Loading
Zuhair Kadhim Jahanger
1,2, a), S.J. Antony
3,b)and Akash Hirani
4, c)1Research scholar, School of Chemical and Process Engineering, University of Leeds, LS2 9JT, Leeds, UK. 2Lecturer, PhD, Department of Water Resources Engineering, College of Engineering, University of Baghdad,
Al-Jadriya Campus, Baghdad, Iraq, ORCID number: 0000-0003-2869-9178.
3Associate Professor, PhD, School of Chemical and Process Engineering, University of Leeds, LS2 9JT, Leeds,
UK, ORCID number: 0000-0003-1761-6306.
3Graduated student, MSc, School of Chemical and Process Engineering, University of Leeds, LS2 9JT, Leeds, UK.
a) Corresponding author: [email protected] b)[email protected]
Abstract. In the geotechnical engineering applications, precise understandings are yet to be established on the effects of a foundation stiffness on its bearing capacity and settlement. The modern foundation construction uses the new available construction materials that totally change the relative stiffness of the footing structures–soil interactions such as waste material and landfill area of more residential purposes. Conventional bearing capacity equations were dealt with common rigid footing and thus cannot be used for reduced foundation rigidity. Therefore, this study investigates the effects of foundation relative stiffness on its load-displacement behaviour and the soil deformation field using compression test of a strip smooth footings on surface of sand of different packing densities. Nine experimental tests using three footing materials (plastic (P), rubber (R) and aluminium (A)) that differ in relative stiffness with three soil densities were used. This study has separated the effects of relative stiffness of the foundation systems on bearing capacity and settlement by defining the failure mechanism using digital particle image velocimetry (DPIV). The bearing capacity decreases as the foundation system stiffness increases. This decrease, however, is also associated with a smaller ultimate settlement. It is also apparent that a clear trend can be observed in dimensions of the slip surface when comparing rigid and flexible foundation systems. The soil particles in the failure zone under the footing have the highest vertical displacement for the increase in the rigidity of the footing system. A change in the relative stiffness of a foundation system affects the deformation of a granular media and particular analysis have been taken into the load-displacement behaviour, failure mechanisms and velocity fields.
Keywords: Relative stiffness, sand, strip footing, bearing capacity, landfill
INTRODUCTION
2
design foundation system with limitations. A foundation system consists of different parts interaction with one another, though for a specific footing structure-soil condition needs to ensure the most economical design. The prediction and utilisation of relative stiffness gain in bearing capacity equation allow more efficient foundation design.
The modern foundation construction uses the new available construction materials that totally change the relative stiffness of the footing structure–soil interaction such as geocell, and waste [5]. However, using footing– soil system that is not stiff (rigid) enough, makes the foundation with a flexible soil interface. Therefore, it is obviously interesting to study the effect of foundation-soil interface stiffness on its ultimate load, settlement and failure mechanism that have not yet covered by the common bearing capacity theory. Conventional bearing-capacity analyses were produced to deal with rigid footings and consequently are ignored the effect of reduced foundation-soil interface rigidity [4]. A change in the relative stiffness of a footing affects the deformation of a granular media and particular analysis will be taken into the load-displacement behaviour, failure mechanisms and velocity fields. Granular materials are ubiquitous in our daily lives but have not been studied as much as standard fluids and elastic solids so a lack of understanding in their behaviour exists, there is no continuum model to predict their behaviour under loading [6].
The aim of the study was to investigate the performance of a foundation structures-soil system interactions, as well as the effect of the overall foundation stiffness on the load-displacement behaviour and the deformation field subsoil using DPIV. The focus of this investigation was limited to smooth strip footings on loose, medium-dense and dense sand underlain by a rigid base.
SYSTEM RELATIVE STIFFNESS
In footing structures-soil interactions analysis, constant vertical displacement profile for rigid footings interacting with sand at the depth of the footing embedment is used by engineers [7-9]. But, the displacement in sand could vary significantly below the level of the footing-sand interface within the influence zone of depth about 2-4 times the width of the footing in homogenous sand and layered soils [10-13]. Reinforced concrete footings were designed first by Westergaard [14]. Westergaard stated that the subgrade was an elastic media, where the stiffness of the subgrade could be measured as the force that would cause unit deflection if it were spread over a unit area. The foundation structural behaviour can be characterised by its certain physical characteristics such as the stiffness (E). Therefore, when designing the footing on a granular stratum, it is important to know this parameter and the effect it has on the granular stratum in which it interacts with. A foundation system where there is a load acting on the ground beneath must consider the stiffness induced as this can effect parameters like the ultimate bearing capacity and the load-settlement [4]. The quantifying parameter Ks gives information on the
stiffness of the system or the flexibility.
(1)
Where Ks = the system stiffness; Eb= Young’s modulus of elasticity of the footing; ES = secant stiffness
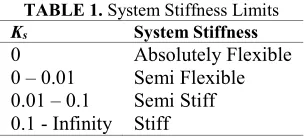
modulus of the soil; d = thickness of the footing; B = width of the footing. This equation uses a Winkler spring model and a function for the stiffness of the footing to determine a stiffness for the whole parameter. Westergaard [14] also suggested a measure of the stiffness of the subgrade compared to the stiffness of the foundation, termed the radius of relative stiffness. Table 1 below gives an indication of the values for Ks and places them in distinct
[image:3.595.222.375.597.666.2]categories so that the stiffness of the system can be determined [15].
TABLE 1. System Stiffness Limits
Ks System Stiffness
0 Absolutely Flexible 0 – 0.01 Semi Flexible 0.01 – 0.1 Semi Stiff 0.1 - Infinity Stiff
3
TABLE 2. Properties of footing material
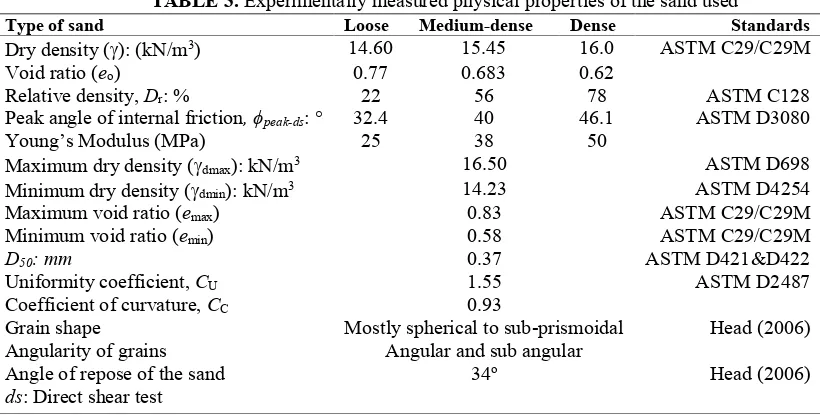
For the purposes of this study, dry silica sand collected from the UK was used as the granular material [7-13]. Table 3 highlights some key properties of the three different packing densities of sand and the physical properties used according to the American Society for Testing and Materials [16-17].
EXPERIMENTAL SETUP
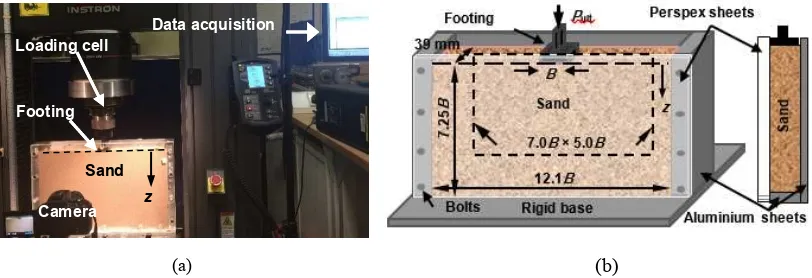
Bearing capacity tests of the footing were conducted in aluminium strong planar box of 460 mm in length, 300 mm in height, and 39 mm in thickness, filled with sand (Fig. 1a). Front wall of 15 mm thickness (Smooth Perspex) is used to eliminate any bending effects (Fig. 1b). The footing models located at the sand surface (Df = depth of
foundation=0) were smooth. The load was transferred through a 20 mm diameter and 3 mm thickness circular desk positioned at the centre of the footing. Such fitting to the loading machine; therefore, rotation of the footing was allowed as it approached failure. The footings were used with dimensions as shown in Table 2. The authors wish to point out that, in the case of strip foundation used in practice, around the ends of the strip footings three-dimensional condition could exist even if the footing is long. However, plane-strain condition could present for rest of the strip footings [1,10-11, 18] as assumed in the current two-dimensional plane-strain tests [4, 12-13,19].
(a) (b)
FIGURE 1. (a) Experimental setup (b) schematic diagram of the experimental setup, not to scale
The loose sand was set directly on the loading machine platform by pouring the soil uniformly across the width of the model box in layers using pluviation technique from Jahanger et al [10-11] so that any segregation of the grains was avoided during the construction process [7-13]. The preparation procedure was done directly on the loading machine baseplate. A hand scraper was used to gently level off the top surface of the sand layer. The disturbance of the constructed loose sample was avoided before applying the axial loading in our experiments. The mass of sand grains laid in the planar box to the required height pertains to the density of the loose sample. The medium-dense packing was achieved in three compacted layers using 50 blows per layer in 35 mm lifts by a predesigned hand compaction hammer (1.05 kg). The dense sand was prepared in five layers, compacted using 60 blows per layer [10-11].
TEST PROCEDURE
The experimental tests were done using universal testing system, Instron 5985L3398A strain-controlled machine (Instron, Norwood, Massachusetts at University of Leeds), shown in Fig. 1a [7-13]. A vertical compression loading was applied slowly on the centre of the footing (0.05 mm/s indentation velocity) using 5.0 kN load cell. The machine accuracy was measured to be with 0.1 N resolution for load and with < 0.001 mm for settlement. The macroscopic settlement of the footing (S) and load (P) were also read from the tests using Instron data acquisition software. The test was completed when failure occurred or when settlement of the footing = 20-25 mm. Hundreds of P-S readings were measured form each test, but only coarse data were presented in Fig.2 for
Material Symbol d (mm) B (mm) Eb(MPa)
Plastic P 2.3 38 2000
Rubber R 10 44 100
Aluminium A 16 38 70000
Camera
Data acquisition
Footing
Sand
[image:4.595.93.499.366.505.2]4
[image:5.595.75.485.112.320.2]better clarity. The sand from previous test was removed from the planar test box and the sand was refilled into the planar model box before starting a new test.
TABLE 3. Experimentally measured physical properties of the sand used
PARTICLE IMAGE VELOCIMETRY (PIV) ANALYSIS
In the field of fluid mechanics, Particle image velocimetry (PIV) is often used to track the motion of fluid flow using tracer particles [20]. It has been also used to study the displacement and(/or) strain distribution in some cases of granular materials [7-13, 21]). A Nikon D5500 camera that captures image at a high definition resolution of 24 megapixels was placed 70 cm away from the planar box model and was used to capture movement of the granular media. Two lights were used to illuminate the front of the planar box so a clear image could then be captured. The loading exhibited is quasi static so an image every 1 second was obtained in order to detect any movement. The resolution gathered of the images were 6000 × 4000 pixel and a field of view of 270 mm × 180 mm from the centre of the footing was taken and this is roughly 0.05 mm/pixel.
Dynamic Studio Software Platform (DSSP) is used to analyse the digital images acquired during test using digital PIV (DPIV) [22]. This functionality built in the DSSP was used to analyse the digital frames of the grains, and to compute the related velocity vectors of the grains and their evolution during load application within the sand layer. More details can be found elsewhere [7-13, 23].
RESULTS AND DISCUSSIONS
Average Footing Stress versus Settlement
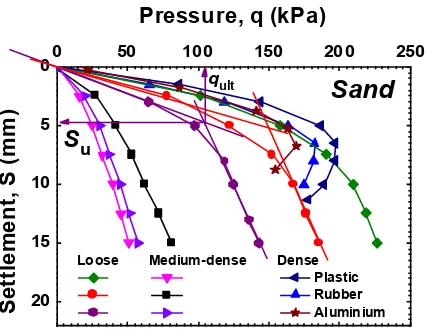
The load–settlement relationship for the footing structures-sand interactions (Some of average of three tests) interacting with sand (using coarse data only) is presented in Fig. 2. The load–settlement curves show punching (without a well-defined peak), local (moderate peak) and general (well-defined peak) shear failures for sand which are consistent with what described by Vesic [24] indicate the repeatability of the test conditions. The footing was loaded until a minimum settlement value of S = 20 mm was achieved. Ultimate bearing capacity was measured using the tangent intersection method, in which one marked ultimate bearing load qult and its corresponding ultimate settlement (Su) were inset in Fig. 2. Therefore, it can be seen that all tests were loaded well beyond the failure settlement. However, for the dense sand, the ultimate bearing load became well-defined when a sudden collapse occurred. The ultimate bearing capacity for a surface strip footing resting on granular soil of cohesion
c=0, and subjected to vertical load can be expressed by adding the Nq contribution to predict of bearing capacity
according to Terzaghi [25] as:
(2)
Where is the unit weight of the soil, Nq and N are the bearing capacity factor due to surcharge stress and unit weight of soil respectively. Both the bearing resistance and the failure strain (S/B) increases with an increase in packing density of sand.
Type of sand Loose Medium-dense Dense Standards
Dry density (): (kN/m3) 14.60 15.45 16.0 ASTM C29/C29M
Void ratio (eo) 0.77 0.683 0.62
Relative density, Dr: % 22 56 78 ASTM C128
Peak angle of internal friction, peak-ds:° 32.4 40 46.1 ASTM D3080
Young’s Modulus (MPa) 25 38 50
Maximum dry density (dmax): kN/m3 16.50 ASTM D698
Minimum dry density (dmin): kN/m3 14.23 ASTM D4254
Maximum void ratio (emax) 0.83 ASTM C29/C29M
Minimum void ratio (emin) 0.58 ASTM C29/C29M
D50: mm 0.37 ASTM D421&D422
Uniformity coefficient, CU 1.55 ASTM D2487
Coefficient of curvature, CC 0.93
Grain shape Mostly spherical to sub-prismoidal Head (2006)
Head (2006) Angularity of grains
Angle of repose of the sand
Angular and sub angular 34o
5
FIGURE 2. Load-settlement curves of footing interacting with loose, medium-dense and dense sand. The guide arrows show the ultimate load level (qult) of the sand packing
Table 4 summarizes ultimate bearing load (qult), last settlement reading before collapse occurred (Su). This
[image:6.595.73.526.355.498.2]result shows a good agreement between experimental measurements and the Terzaghi formula [25] for dense sand only. The soil before qult behaves like elastic, and after yield points (qult) plastic zone develops. Therefore, the stress–strain curve captures both elastic and plastic deformations.
TABLE 4. Summary of test results
Ultimate Load and Settlement as a Function of Footing Stiffness
Figure 3 shows the change of the ultimate load with footing system’s relative stiffness. It can be clearly seen the decrease in the bearing capacity as the foundation system stiffness increases. This decrease, however, is also associated with a smaller ultimate settlement (failure settlement). The ultimate bearing loads of the whole footing systems are consistently underestimated if one uses Terzaghi bearing capacity equation for predictions.
Leshchinsky and Marcozzi [5] have hypothesised based on experimental evidence that a high stress concentration could be exist around the edge of the rigid footing, which resulting in the development of progressive local failure of the soil by stressed beyond soil peak strength. This could be the reason for the apparent decrease in bearing capacity as the stiffness increased. Whereas, the flexible foundation system produces smaller stress concentrations that lead a collapse governed by peak strength along most of the failure surface; i.e., approximately uniform shear strength mobilization happens. Thus, the potential for a significant development of peak strength may lead to a lower bearing capacity for the rigid footing as compared with the flexible one.
20 15 10 5
00 50 100 150 200 250
Sand
S
uLoose Medium-dense Dense Plastic Rubber Aluminium
Pressure, q (kPa)
S
e
tt
le
m
e
n
t,
S
(
m
m
)
qult
Foundation system
Ks qult, kPa
(measured)
Su/B qult, kPa
(predicted)
qult ratio,measured to
predicted
System stiffness
P-L 0.0015 24 0.092 8.0 3.0 Semi-flexible
R-L 0.0041 37 0.079 9.0 4.2 Semi-flexible
A-L 17.417 28 0.077 7.7 3.7 Stiff
P-M 0.0009 192 0.131 32.4 5.1 Semi-flexible
R-M 0.0027 149 0.120 37.1 4.6 Semi-flexible
A-M 11.458 105 0.121 32.1 3.3 Stiff
P-D 0.0007 197 0.176 127 1.4 Semi-flexible
R-D 0.0020 182 0.156 145 1.5 Semi-flexible
A-D 8.7087 165 0.157 125 1.3 Stiff
6
FIGURE 3. Ultimate load versus relative stiffness foundation system
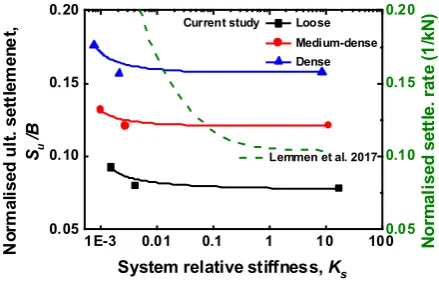
The increases in the bearing load with the flexibility of the foundation system, however, also lead to increase the corresponding settlement at failure (Fig. 4). This figure shows the normalised settlement (Su/B) plot versus the
foundation relative stiffness (Ks). Aggregate settlement occurs due to significant deformation of both of the footing
and the sand. The trend of the curves (Su/B) approach a constant value with the relative stiffness increases, which
indicates independent of the foundation relative stiffness (Ks), and the settlement then becomes dependent on the
sand packing density. Leshchinsky and Marcozzi [5] have stated reducing the stiffness, however, is also resulted with increased ultimate settlement. In addition, Lemmen et al [4] have concluded that with increasing stiffness, the settlement reduced, but up to a point. Once the footing classified as stiff, no more improving could be got by increasing stiffness. The design for many structures on sand is controlled by a tolerable settlement, especially as the required B increases, rather than by allowable bearing capacity. Analysing the plots, it can be gathered from experiments that as the relative stiffness increases beyond the semi-stiff region of (Ks =1.0) the normalised
settlement (Su/B) becomes constant at approximately 0.05, 0.12 and 0.15 for loose, medium-dense and dense sand
respectively.
FIGURE 4. Normalised ultimate settlement with system relative stiffness
Analysis of Surface Failure
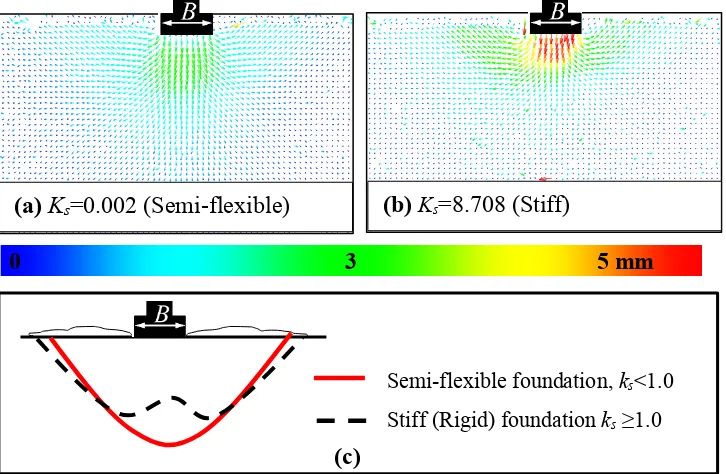
The displacement of the sand grains beneath the footing was determined with the use of DPIV [22]. Soil displacement is dependent on the applied stress on the soil and the flexibility of the footing [1]. Figure 5 presents the resultant displacement vectors and the average slip surfaces under ultimate load for semi-flexible and stiff foundation systems in loose and dense sand packings. The resultant displacement field of semi-flexible footing system is presented first on the left hand side, followed by the stiff to the right hand side. Each figure extends to a width of 3.5B form the footing centreline on both side and a depth of 3.7B from footing sand interface. It can be seen that a big difference has shown in the failure surface pattern for the packing density (i.e. between Fig. 5 (a) and Fig. 5 (b)) and for the footing relative stiffness. Displacement profiles are different for semi-flexible and stiff which collapse occurred symmetrically along the footing centre line with a failure mode of general shear. The materials beneath the footing base objects with the granular materials moving as if they are continuous extension
1E-3 0.01 0.1 1 10 100
0 50 100 150 200 250 300
Sand
Loose Medium-dense Dense U lt im a te l o a d , P u lt ( N )System relative stiffness, Ks
1E-3 0.01 0.1 1 10 100 0.05 0.10 0.15 0.20 0.05 0.10 0.15 0.20 Current study
Lemmen et al. 2017
N o rm a li s e d s e tt le . ra te ( 1 /k N ) Loose Medium-dense Dense N o rm a li s e d u lt . s e tt le m e n e t, Su /B
[image:7.595.196.416.450.593.2]7
of the footing, i.e., no slip surface at the footing-granular interface. The grains in this region under the footing have the highest vertical displacement for the increase in the rigidity of the footing system. The sand surface forms a heap spreading up wider and shallower in stiff system than semi-flexible. It seems likely that the reason behind decreases the ultimate load with increased relative stiffness, which the soil fails quickly due to load concentration around the footing corner and cannot sustain the applied load and therefore moving sideward and upward. However, it seems likely that the apparent increase in the settlement of the footing as the stiffness decreased may be attributed to the differences in interfacial contact stresses resulting in the development of progress failure (Fig. 5 a and b). This is consistent with Leshchinsky and Marcozzi [5] and the pictorial profile of the shape of the zone of failure (Fig. 5c) compared well with Jahanger et al. 2018a for the case of rigid foundation system. However, the flexible foundation system shows a deeper failure zone which can be accept as the footing’s settlement is more along the line of symmetry of the flexible footing [26].
FIGURE 5. (a-b) Resultant displacement vectors under ultimate load (c) sketch of average slip surface underneath footing of different packing densities
CONCLUSIONS
The effects of relative stiffness of the foundation system on the ultimate baring capacity and corresponding settlement are not yet studied well. Here, small-scale footing test were conducted to investigate the bearing capacity and related settlement under plane-strain condition. The results indicate that the ultimate bearing capacity increases as the relative stiffness of foundation system decreases. This increase, however, is also associated with a larger failure settlement of the footing. Substantial and consistent differences in the slip surface envelopes were shown. No more improving in the load-settlement, once relative stiffness (ks) of foundation system is more than
1.0. The relative stiffness (ks) can be applied to measure the strength characteristics of more realistic footing
structures-sand interactions in future. The soils in the region under the footing have the highest vertical displacement for the increase in the rigidity of the footing system. However, the rigidity of the foundation, system affects its load-settlement response. Therefore, this should help to design structures on complex media such as landfill sites with granular media. A new ultimate bearing capacity equation have to be established accounting for the relative stiffness of the foundation system. Therefore, using Terzaghi equation (2) is underestimated the predicted ultimate bearing capacity for relative stiffness of the foundation system that less than rigid using equation (1). Bearing capacity of shallow flexible foundations is higher because the soil strength changes and could be because the failure mechanism changes. Further investigation must be carried out to generalize and validate the relative stiffness factor to the conventional bearing capacity equation.
(a)
K
s=0.002 (Semi-flexible)
(b) K
s=8.708 (Stiff)
(c)
Semi-flexible foundation,
k
s<1.0
[image:8.595.113.476.211.448.2]8
REFERENCES
1. J. E. Bowles, Foundation Analysis and Design (McGraw-Hill, Singapore, 1997). 2. C. Liu and J. B. Evett, Soils and Foundations (Pearson Prentice Hall, New Jersey, 2004).
3. K. Terzaghi, R. B. Peck and G. Mesri, Soil Mechanics in Engineering Practice (John Wiley and Sons, New York, 1996).
4. H. Lemmen, S. Jacobsz and E. P. Kearsley, The Influence of Foundation Stiffness on the Behaviour of Surface Strip Foundations on Sand. Journal of the South African Institution of Civil Engineering. 59, 19-27 (2017).
5. D. Leshchinsky and G. F. Marcozzi, Bearing Capacity of Shallow Foundations: Rigid Versus Flexible Models. Journal of Geotechnical Engineering. 11, 1750-1756 (1990).
6. H. M. Jaeger, S. R. Nagel and R. P. Behringer, Granular Solids, Liquids, and Gases. Reviews of Modern Physics. 68(4), 1259 (1996).
7. Z. K. Jahanger, S. J. Antony and L. Richter, “Displacement patterns beneath a rigid beam indenting on layered soil,” in 8th Americas Regional Conference of International Society for Terrain-Vehicle Systems, Michigan, USA. (ISTVS, 2016) paper no. 67.
8. Z. K. Jahanger and S. J. Antony, “Application of digital particle image velocimetry in the analysis of scale effects in granular soil,” in Proceedings of 19th International Conference on Soil Mechanics and Dynamics, 19 (Rome, 2017a), pp. 1134-1139.
9. Z. K. Jahanger and S. J. Antony, Application of Particle Image Velocimetry in the Analysis of Scale Effects in Granular Soil. International Journal of Civil, Environmental, Structural, Construction and Architectural Engineering,11, 832-837 (2017b).
10. Z. K. Jahanger, J. Sujatha and S. J. Antony, Local and Global Granular Mechanical Characteristics of Grain–Structure Interactions. Indian Geotechnical Journal 48, 753-767 (2018a).
11. Z. K. Jahanger, S. J. Antony, Martin E and L. Richter, Interaction of a Rigid Beam Resting on a Strong Granular Layer Overlying Weak Granular Soil: Multi-Methodological Investigations. Journal of Terramechanics 79, 23-32 (2018b).
12. Z. K. Jahanger, “Micromechanical investigations of foundation structures-granular soil interactions,” Ph.D. thesis, University of Leeds, 2018.
13. S. J. Antony and Z. K. Jahanger, Displacement Fields in Footing-Sand Interactions
under Cyclic Loading. International Journal of Geotechnical and Geological Engineering 12, 692-696 (2018).
14.
H. Westergaard, What is Known of Stresses. Engineering News Record 118, 26-29 (1937). 15. A. Arnold, J. Laue, T. Espinosa and S. M. Springman, “Centrifuge modelling of the behaviour offlexible raft foundations on clay and sand,” In International Conference on Physical Modelling in Geotechnics (2010), pp. 679-684.
16. K. Head, Manual of Soil Laboratory Test. Volume 1: soil Classification and CompactionTests (CRC Press, Florida, 2006).
17. ASTM Standard, Soil and Rock, Building, Stores, Geotextiles 04.08 (USA, Pennsylvania, 1989). 18. C. O’Loughlin and B. Lehane, Nonlinear Cone Penetration Test-Based Method for Predicting Footing
Settlements on Sand. Journal of Geotechnical and Geoenvironmental Engineering 136, 409-416 (2010). 19. G. P. Raymond and F. E. Komos, Repeated Load Testing of a Model Plane Strain Footing. Canadian
Geotechnical Journal 15, 190-201(1978).
20. R. A. Adrian, Particle-Imaging Techniques for Experimental Fluid Mechanics. Annual review of fluid mechanics 23, 261-304 (1991).
21. T. G. Murthy, E. Gnanamanickam and S. Chandrasekar, Deformation Field in Indentation of a Granular Ensemble. Physical Review E 85, 061306 (2012).
22. Dynamic Studio, Dynamic Studio User’s Guide (Dantec Dynamics, Skovlunde, 2013). 23. S. Albaraki and S. J. Antony, How Does Internal Angle of Hoppers Affect Granular Flow?
Experimental Studies using Digital Particle Image Velocimetry. Powder Technology 268, 253-260 (2014).
24. A. S. Vesic, Analysis of Ultimate Loads of Shallow Foundations. Soil Mechanics and Foundation Division 99(SM1), 45-73 (1973).
25. K. Terzaghi, Theoretical Soil Mechanics (John Wiley and Sons, New York, 1943).