This is a repository copy of
Development and validation of the Child Three-Factor Eating
Questionnaire (CTFEQr17)
.
White Rose Research Online URL for this paper:
http://eprints.whiterose.ac.uk/134299/
Version: Accepted Version
Article:
Bryant, EJ, Thivel, D, Chaput, J-P et al. (3 more authors) (2018) Development and
validation of the Child Three-Factor Eating Questionnaire (CTFEQr17). Public Health
Nutrition, 21 (14). pp. 2558-2567. ISSN 1368-9800
https://doi.org/10.1017/S1368980018001210
© The Authors 2018. This article has been published in a revised form in Public Health
Nutrition novation, https://doi.org/10.1017/S1368980018001210. This version is free to
view and download for private research and study only. Not for re-distribution, re-sale or
use in derivative works.
[email protected] https://eprints.whiterose.ac.uk/ Reuse
Items deposited in White Rose Research Online are protected by copyright, with all rights reserved unless indicated otherwise. They may be downloaded and/or printed for private study, or other acts as permitted by national copyright laws. The publisher or other rights holders may allow further reproduction and re-use of the full text version. This is indicated by the licence information on the White Rose Research Online record for the item.
Takedown
If you consider content in White Rose Research Online to be in breach of UK law, please notify us by
1
Development and Validation of the Child Three Factor Eating Questionnaire
1
(CTFEQr17)
2
3
ABSTRACT
4
OBJECTIVE: Develop and validate a child and adolescent version of the Three Factor Eating
5
Questionnaire (CTFEQr17), and to assess its psychometric properties and factor structure. We
6
also examined associations between the CTFEQr17 and body mass index (BMI) and food
7
preferences.
8
DESIGN: A two-phase approach was utilised, employing both qualitative and quantitative
9
methodologies.
10
SETTING: Primary and secondary schools, UK.
11
SUBJECTS: In phase 1, 76 children (39 boys; mean age: 12.3±1.4 years) were interviewed to
12
ascertain their understanding of the original TFEQr21 and to develop accessible and
13
understandable items to create the CTFEQr17. In phase 2, 433 children (230 boys; mean age:
14
12.0±1.7 years) completed the CTFEQr17 and a food preference questionnaire, a subsample (n
15
= 253; 131 boys) had their height and weight measured and 45 children (23 boys) were
16
interviewed to determine their understanding of the CTFEQr17.
17
RESULTS: The CTFEQr17 showed good interna
l consistency (Cronbach’s =0.85
) and the
18
three factor structure was retained: cognitive restraint (CR), uncontrolled eating (UE) and
19
emotional eating (EE). Qualitative data demonstrated a high level of understanding of the
20
questionnaire (95%). A high CR was found to be significantly associated with a higher body
21
weight, BMI and BMI percentile. High UE and EE scores were related to a preference for high
22
fat savoury and high fat sweet foods. The relationships between CTFEQr17, anthropometry
23
and food preference were stronger in girls compared to boys.
24
CONCLUSIONS: The CTFEQr17 is a psychometrically sound questionnaire for use in
25
children and adolescents, and is associated with anthropometric and food preference measures.
26
27
2
INTRODUCTION
29
The prevalence of obesity in children and adolescents has reached epidemic proportions
30
worldwide and is associated with many comorbidities
(1-3). Pediatric obesity is closely linked
31
to the so-
called “obesogenic” environment where a myriad of factors are conducive to eating
32
too much and not moving enough, thereby promoting weight gain and ultimately overweight
33
and obesity
(4, 5). Among the many factors that explain the susceptibility to gain weight, a better
34
understanding of the link between eating behaviours and weight gain is of crucial importance
35
to overcome the rising rates of obesity.
36
37
Obesity interventions have to consider individuals’ eati
ng behaviours, especially those that
38
have been associated with obesity and weight gain
(6, 7). For example, dietary restriction can
39
promote overeating in dietary restrained adolescents having disinhibited eating behaviour
(8).
40
Additionally, adolescents with high restrained eating behaviour scores are more likely to gain
41
weight over time
(9). Properly assessing eating behaviours of children and adolescents remains,
42
however, challenging.
43
44
In 1985, Stunkard & Messick developed the Three-Factor Eating Questionnaire (TFEQ) as a
45
self-reported scale based on the Restraint
(10)and the Latent Obesity
(11)theories, in order to
46
assess Dietary Restraint (restriction of food intake to control weight), Disinhibition (tendency
47
to overeat opportunistically), and Hunger (responsiveness to internal hunger sensations). While
48
this initial version of the TFEQ developed in adults has been shown to clearly link eating
49
behaviours with weight gain and weight loss success
(12-15), it has been recently revised into a
50
shorter 21-item version (TFEQr21) focusing on Restraint, Uncontrolled Eating, and Emotional
51
Eating
(13). In this last version, although the restraint dimension remains unchanged,
52
uncontrolled eating refers to eating in response to food palatability and the likelihood to
over-53
consume, and emotional eating represents the process to eat in response to negative moods
(13).
54
55
Despite a significant body of literature regarding the utility of the TFEQ in adults
(13 -18), the
56
validity of this TFEQr21 remains to be tested among children and adolescents. Although,
57
Martin-Garcia et al.
(19)recently reported a strong association between body composition and
58
Cognitive Restraint in 7-17-year-old Spanish youth using a modified version of the Spanish
59
adult TFEQ. These results highlight the usefulness of the TFEQr21 in children, but only in a
60
limited population. It thus remains important to develop and validate a specific version of the
3
English TFEQr21 for children and adolescents in order to better characterize their eating
62
behaviour traits and evaluate the impact of obesity interventions in this population.
63
64
The objective of this study was to develop an adapted-version of the adult TFEQr21 to be used
65
among children and adolescents (CTFEQr17), and to assess its psychometric properties and
66
factor structure. We also examined the associations between the CTFEQr17 and body mass
67
index (BMI) and food preferences as a secondary objective.
68
69
70
METHODS
71
The process of developing and validating the CTFEQr17 was a two-phase process: the
72
CTFEQr17 was developed in phase 1 and validated in phase 2. Each phase and subsequent
73
results are detailed below.
74
75
Phase 1: Development of the CTFEQr17
76
Participants
77
A sample of 76 children (39 boys and 37 girls) recruited between 2013
–
2014, from primary
78
and secondary schools in North and West Yorkshire, UK were interviewed to determine their
79
understanding of the original TFEQr21
(13)items and to develop the wording of the CTFEQr17
80
(mean age: 12.3±1.4 years; mean BMI: 19.1±2.5 kg/m
2; mean BMI percentile: 59.4±25.8). All
81
children, their guardians and the school gave informed consent for participation. Children who
82
had any known eating disorders or eating issues, or who had difficulties with reading were
83
excluded from participation (n=5 excluded). These children were identified by parents and/or
84
teachers. The project gained full ethical approval from the University of Bradford Ethics
85
Committee.
86
87
Qualitative Design
88
The children took part in one-to-one structured interviews with the researchers. The child was
89
presented with the adult version of the TFEQr21
(13)and was asked whether they understood
90
each item, if they understood how to respond to each question, and asked to put each item into
91
their own words. The interviews allowed the researchers to determine the children
’s
4
understanding of each item. Sample percentages were calculated for correct understanding of
93
each item. In addition, the wording the children used to describe each item was then used to
94
develop the CTFEQr17. This was achieved by recording the most frequently used words and
95
phrases for each item and adopting these words, and phrases, in the new items. The interviews
96
were tape-recorded and transcribed for analysis. Two researchers independently analysed the
97
children’s responses to try to reach a
subjective
consensus on the child’s responses.
98
99
Anthropometric Measurements
100
Body weight was assessed using a Seca 877 weighing scale and was measured to the nearest
101
0.1 kg. Children wore loose and lightweight shorts and a T-shirt to be weighed. Height was
102
measured while the child was barefoot, using a Leicester stadiometer and was measured to the
103
nearest 0.1 cm. BMI was calculated as weight (kg) / height (m)
2. BMI percentiles were
104
calculated using the WHO
(20)criteria based on age and sex.
105
106
Phase 2: Validation of the CTFEQr17
107
A sample of 433 children (230 boys; mean age: 12.0±1.7 years; mean BMI: 19.7±4.5 kg/m
2;
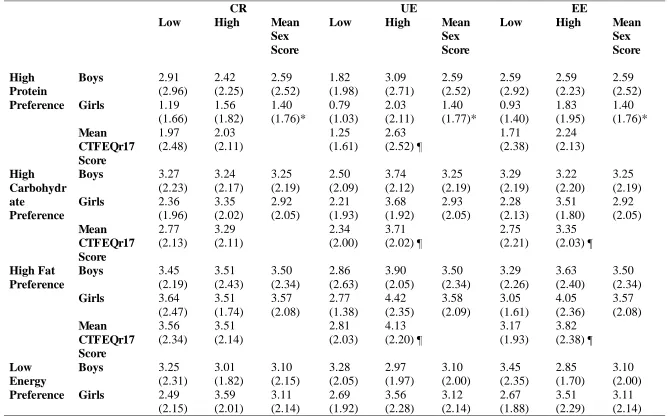
108
mean BMI percentile: 57.6±30.9) from primary and secondary schools in West Yorkshire and
109
Lancashire, UK were recruited between 2016-2017. A subsample of 45 children (23 boys and
110
22 girls) took part in interviews to confirm their understanding of the CTFEQr17. All children,
111
their guardians and the school gave informed consent for participation. Children who had any
112
known eating disorders or eating issues, or who had difficulties with reading were excluded
113
from participation (n = 23). The project gained full ethical approval from the University of
114
Bradford Ethics Committee.
115
116
Validation Design
117
Children were asked to self-complete the CTFEQr17 and an adapted paper-based Leeds Food
118
Preference Questionnaire (LFPQ), suitable for use with children
(21). The LFPQ consists of a
119
list of common UK foods (e.g., crisps, strawberries, yoghurt, biscuits) and the child was asked
120
to indicate if they would like to consume these foods. Responses were then coded and summed
121
into preference for high protein (8 items), high fat (8 items), high carbohydrate (8 items), and
122
low energy foods (8 items). Mean taste preference scores were also calculated for low fat
123
savoury foods (LFSA: 12 items), low fat sweet foods (LFSW: 5 items), high fat savoury foods
124
(HFSA: 8 items), and high fat sweet foods (HFSW: 7 items).
125
5
Anthropometric Measurements
127
A subsample of children had their height and weight measured (131 boys and 122 girls).
128
Anthropometric measures were taken using the same procedure used in phase 1.
129
130
Qualitative Design
131
The children took part in structured one-to-one interviews with a researcher. They were
132
presented with the CTFEQr17 and asked if they understood each item, understood how to
133
respond to each question and asked to elaborate on what they thought each item meant, to
134
confirm their understanding. Each interview lasted approximately 20 minutes. Interviews were
135
recorded and transcribed for analysis.
136
137
138
139
Statistical Analysis
140
We calculated that a total sample of 338 would be sufficient (1-â = ~0.90, effect size = 0.25, á
141
= 0.05) to run the planned analysis.
An exploratory, varimax rotation, principal components
142
factor analysis (PCA) was carried out to determine the factor structure of the CTFEQr17. An
143
item analysis was also conducted to confirm the internal consistency, item-convergent and
144
item-divergent validity of the CTFEQr17 items. Bivariate correlations explored relationships
145
between age and CTFEQr17 factors by sex, and an ANOVA was used to determine differences
146
between sex and age groups (7-10 years and 11-15 years) on each CTFEQr17 factor. Partial
147
correlations, controlling for age, were used to examine relationships between CTFEQr17
148
factors and anthropometric measurements. Partial correlations, controlling for age and BMI,
149
were also used to explore relationships between CTFEQr17 factors and food and taste
150
preference. Only correlations above 0.20 are reported. Groups were formed using a median
151
split on cognitive restraint (CR), uncontrolled eating (UE) and emotional eating (EE) scale
152
scores to create a low and high CR groups (LCR & HCR), low and high UE groups (LUE &
153
HUE) and low and high EE groups (LEE & HEE). ANCOVAs were used to analyse differences
154
in anthropometric measures (controlling for age) and in food and taste preference (controlling
155
for age and BMI) by sex and eating behaviour groupings. Effect size was measured through
156
Eta
2(
2).
For the qualitative data, the children’s comments were used to determine their level
157
of understanding of each item of the CTFEQr17, and percentages of the correctly understood
158
items were calculated. Understanding of items between phase 1 and 2 was examined using
6
tests. SPSS version 22 was used to conduct the analysis, and the level of statistical significance
160
was set at p<0.05 for all analyses.
161
162
RESULTS
163
Phase 1: Development of the CTFEQr17
164
The qualitative data from the interviews with children revealed that there were a number of
165
items in the TFEQr21
(13)that the children had difficulty in understanding, particularly items
166
9, 17 and 21. To develop a more understandable questionnaire, these items were reworded,
167
using the children’s own language,
and ascertained from the interviews (see Appendix for the
168
CTFEQr17). In addition, the children also deemed the response format of the TFEQr21 unclear
169
and too complex; thus, the response format of the CTFEQr17
was altered to read ‘totally true’,
170
‘mostly true’ ‘mostly false’
,
and ‘totally false’, again utilising the phraseology of the children
171
from the interviews.
172
173
Phase 2: Validation of the CTFEQr17
174
Structure and Internal Consistency of the CTFEQr17
175
The data met the assumptions for factor analysis with the Kaiser-Meyer-Olkin measure of
176
sampling adequacy index KMO = 0.87, and
Bartlett’s test of sphericity (
2= 2706.45, p<0.001),
177
indicating that the correlations between items were sufficiently large for a PCA. A varimax
178
rotation PCA initially revealed four factors with Eigenvalues >1, which in combination
179
explained 51.6% of the variance. The factors of UE (items 3, 6, 8, 9, 12, 13, 15, 19 and 20) and
180
EE (items 2, 4, 7, 10, 14 and 16) were retained as in the original TFEQr21. However, CR loaded
181
into two factors: CR1 items 1, 5 and 11 and CR2 items 17, 18 and 21. The items in CR1 are
182
related to current food restriction behaviour, whereas CR2 is related to more prospective food
183
restriction behaviours. However, following the removal of weak items due to low inter-item
184
and item-
total correlations and Cronbach’s increasing after item removal
(17, 18, 19 & 21),
185
a three factor structure was revealed, which explained 53.5% variance. The factors of UE (items
186
3, 6, 8, 9, 12, 13, 15 and 20), EE (items 2, 4, 7, 10, 14 and 16) and CR (items 1, 5 and 11) were
187
retained to create a CTFEQr17.
188
189
Following an analysis of internal consistency, the CTFEQr17
had a Cronbach’s
of 0.85, with
190
the factors of UE ( = 0.85) and
EE ( = 0.83) showing similarly high scores. The factor
of CR
191
was
( = 0.67)
which although lower than UE and EE, was deemed adequate. The item analysis
192
also revealed that the factors had adequate to good inter-item correlations for CR (r = 0.38
–
7
0.47), UE (r = 0.32
–
0.58) and EE (r = 0.36
–
0.59), showing that the items within each scale
194
correlated with one another. The corrected item-total correlations were good; CR (r = 0.46
–
195
0.52), UE (0.53
–
0.63) and EE (r = 0.55
–
0.70), with the items correlating most strongly with
196
their respective factors, supporting item-discriminant and convergent validity. The factor of
197
UE correlated significantly with EE (r = 0.47, p<0.001) only.
198
199
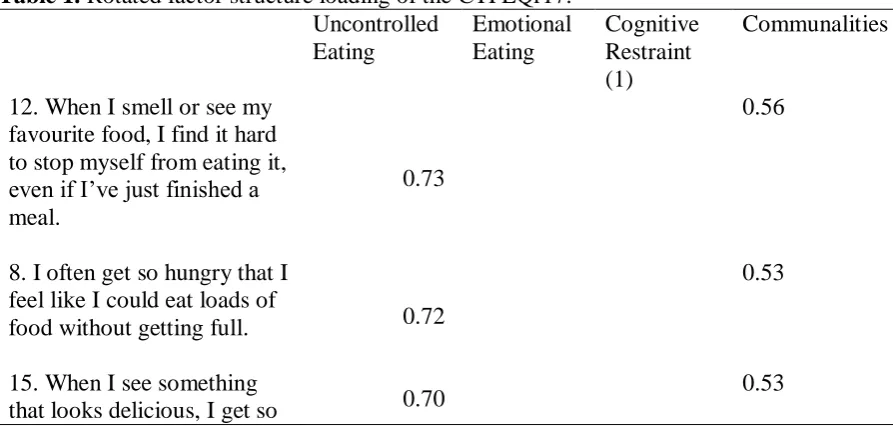
Insert Table 1 here
200
201
Child
ren’s
Understanding of the Items
202
The qualitative aspect of the analysis,
concerning the children’s understanding of th
e
203
questionnaire items, revealed a very good level of understanding of the CTFEQr17. More
204
specifically, in comparison to the original TFEQr21, all items of the CTFEQr17 were more
205
understandable (mean understanding of 95% compared with 81% for the original TFEQr21;
206
see Figure 1), where items 2, 9, 10, 11 and 12 were significantly more understood (p<0.05)
207
compared to the original TFEQr21.
208
209
Insert Figure 1 here
210
Insert Table 2 here
211
212
Participant Characteristics and CTFEQr17
213
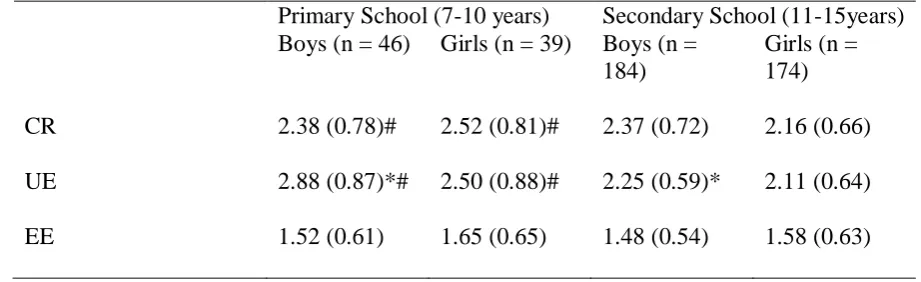
For both boys and girls, UE correlated negatively with age (r = -0.32, p<0.001 and r = -0.25, p
214
= 0.001, respectively). CR correlated negatively with age for girls only (r = -0.21, p<0.01). No
215
significant correlations for EE were found. Younger children scored higher on CR and UE
216
respectively (F(1, 439) = 4.56, p<0.05,
2= 0.01; F(1, 437) = 34.61, p<0.001,
2= 0.07). While
217
boys reported higher UE scores (F(1, 437) = 7.07, p<0.01,
2= 0.02). No differences for age
218
and sex were found for EE (see Table 2).
219
220
Insert Table 3 here
221
222
CTFEQr17, Body Weight, and BMI
223
After controlling for age, CR was found to correlate positively with weight (r = 0.21, p<0.05),
224
BMI (r = 0.25, p<0.01) and BMI percentile (r = 0.21, p<0.05) for girls only. No other
225
associations were found.
8 227
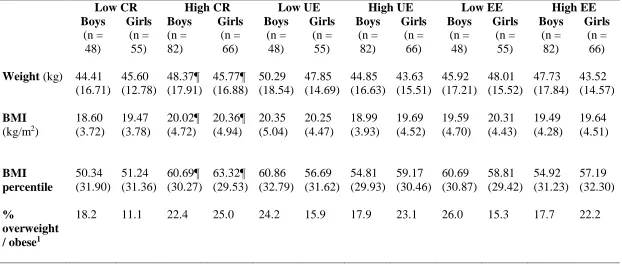
Table 3 presents the participant characteristics by CTFEQr17 group. The ANCOVA revealed
228
that those who have a HCR had a significantly higher weight (F(1, 247) = 8.29, p<0.01,
2=
229
0.04), higher BMI (F(1, 247) = 12.35, p=0.001,
2= 0.05), and higher BMI percentile (F(1,
230
246) = 8.41, p<0.01,
2= 0.04), regardless of sex. No significant differences between UE and
231
EE groups and anthropometric measures were evident. Age was a significant covariate
232
throughout these analyses (p<0.01).
233
234
Insert Table 4 here
235
236
CTFEQr17, Food and Taste Preference
237
Younger children were found to have a higher food preference for all categories; high
238
carbohydrate (r = -0.33, p<0.001), high fat (r = -0.24, p<0.001), and low energy (r = -0.23,
239
p<0.001). This was particularly so for younger girls compared to boys. BMI correlated
240
negatively with high carbohydrate (r = -0.24, p<0.001). This association was found to be
241
stronger in boys. No association between BMI percentile and food preference was found.
242
243
Partial correlations showed that UE was positively related to preferences for high fat foods (r
244
= 0.26, p<0.001), high protein foods (r = 0.27, p<0.001) and high carbohydrate foods (r = 0.23,
245
p<0.001). The relationships between UE and food preferences were found to be stronger in
246
girls. Also, for EE significant relationships existed only for girls, for high carbohydrate foods
247
(r = 0.25, p<0.01), high protein foods (r = 0.22, p<0.05) and high fat foods (r = 0.21, p<0.05).
248
No significant correlations between CR and food preference were found.
249
250
Food preferences were found to differ significantly between the CTFEQr17 groups (see Table
251
4). ANCOVA revealed that for high protein preference, the HUE group had a higher preference
252
compared to the LUE (F(1, 241) = 17.74, p<0.001,
2= 0.07). Boys consistently showed a
253
higher protein preference, regardless of CR, UE and EE groups (F(1, 242) = 20.09, p<0.001,
254
2
= 0.08; F(1, 241) = 14.98, p<0.001,
2= 0.06; F(1, 242) = 18.28, p<0.001,
2= 0.07,
9
respectively). Both the HUE and HEE groups reported a greater preference for high fat (F(1,
256
241) = 16.79, p<0.001,
2= 0.07 and F(1, 242) = 5.45, p<0.05,
2= 0.02 respectively) and high
257
carbohydrate foods (F(1, 241) = 16.85, p<0.001,
2= 0.07 and F(1, 242) = 4.63, p<0.05,
2=
258
0.02, respectively). No differences were found for preference for low energy foods. Age was a
259
significant covariate throughout the analyses (p<0.001).
260
261
In terms of taste preference, younger children had a higher preference across most categories;
262
LFSA (r = -0.25, p<0.001), LFSW (r = -0.23, p<0.001) and HFSW (r = -0.26, p<0.001). Taste
263
preference was found to correlate more strongly for girls compared to boys for age. However,
264
BMI was only found to correlate with taste preference in boys for HFSW foods (r = -0.24,
265
p<0.01).
266
267
Partial correlations revealed that UE was positively correlated with preference for HFSA (r =
268
0.31, p<0.001) and HFSW foods (r = 0.27, p<0.001). When examined by sex, taste preference
269
associations were stronger in girls: UE and EE with HFSW (r = 0.38, p<0.001; r = 0.25, p<0.01,
270
respectively), and HFSA foods (r = 0.34, p<0.001; r = 0.20, p<0.05, respectively) and UE with
271
LFSA foods (r = 0.25, p<0.01). No taste preference associations were found with CR.
272
273
The CTFEQr17 groups also discriminated between taste preferences (see Table 4). The
274
ANCOVA revealed that irrespective of CR, UE or EE group, boys consistently had higher
275
preferences for LFSA foods (F(1, 241) = 6.50, p<0.05,
2= 0.03; F(1, 240) = 4.23, p<0.05,
2276
= 0.02; F(1, 241) = 6.02, p<0.05,
2= 0.02) and HFSA foods (F(1, 242) = 9.44, p<0.01,
2=
277
0.04; F(1, 241) = 6.70, p = 0.01,
2= 0.02; F(1, 242) = 8.71, p<0.01,
2= 0.04, respectively).
278
The HUE group had a higher preference for LFSA foods (F(1, 240) = 9.24, p<0.01,
2= 0.04).
279
In addition, those with a HUE and HEE had a higher preference for HFSA foods (F(1, 240) =
280
18.66, p<0.001,
2= 0.09; F(1, 242) = 3.62, p = 0.058,
2= 0.02) and HFSW foods (F(1, 241)
281
= 18.60, p<0.001,
2= 0.07; F(1, 242) = 8.45, p<0.01,
2= 0.03). Age was a significant
282
covariate throughout the analyses (p<0.001).
283
284
10
DISCUSSION
286
The main aim of the present work was to propose a validated adaptation of the TFEQr21 among
287
children and adolescents. According to our results, the proposed CTFEQr17 successfully
288
assesses psychological eating behaviour traits in children and adolescents, and also shows
289
associations with body weight, BMI and food preference. These findings are supported by
290
qualitative data showing that the children had a good understanding of the CTFEQr17 items,
291
confirming the strength and usefulness of this tool.
292
293
CTFEQr17 and Anthropometric Measures
294
A high CR score was shown to be associated with a higher body weight, BMI and BMI
295
percentile, in girls. This finding supports previous work with adolescents by van Strein et al
(8),
296
Snoek et al
(9)and Martin-Garcia et al
(19). Evidence also supports a stronger association
297
between adverse weight regulation and dietary restraint in girls compared to boys
(22). These
298
seemingly counterintuitive findings are explained well with the goal conflict theory
(23). This
299
theory posits that weight regulation issues are a result of the conflict between the goal of weight
300
control and the goal of eating enjoyment; the hedonic expectation of food often undermines the
301
goal of weight control
(24). In the current obesogenic environment, replete with palatable foods,
302
the goal of eating enjoyment is more often primed, requiring a higher cognitive effort to
303
maintain the goal of weight control
(23). Such cognitive effort can easily become more difficult
304
to maintain when other issues (e.g. emotions, work) reduce cognitive capacity available,
305
resulting in the goal of eating enjoyment becoming much easier to access
(23). As a
306
consequence, a less healthy eating pattern can occur, leading to a susceptibility to weight gain
307
(25)
.
308
309
Although the goal conflict theory supports our results, conflicting evidence exists, as restrained
310
eating has also been associated with lower food intake and better weight regulation
(e.g. 26-28).
311
This suggests that some individuals are better able to maintain their weight control goal in
312
comparison to their eating enjoyment goal. Thus, the relationship between CR and weight is
313
complex, and CR likely interacts with other eating behaviour traits (e.g. Disinhibition) to
314
produce differing influences upon body weight
(6;29). That CR was associated with a higher
11
weight and BMI in this child and adolescent sample supports a large body of adolescent and
316
adult data, suggesting the CTFEQr17 has successfully measured this psychological construct.
317
318
Both UE and EE were found not to be related to anthropometric measures. This lack of
319
association has also been found in adults
(13). However, there is evidence that suggests EE
(30),
320
UE
(19;31)or both UE and EE
(32;33)are associated with higher weight and BMI in adolescents
321
and adults. Where relationships have been found in adolescents
(19), the study sample consisted
322
of overweight/obese and lean groups of children/adolescents. In the current study, children and
323
adolescents were sampled from schools and not selected based on their weight status, thus
324
having a lower proportion of overweight and obese participants. This could explain why
325
associations with UE and EE were not found. In addition, where relationships have been found
326
in adult samples, this has, at least partially, been attributed to food choice, whereby those with
327
a higher UE and EE have a less healthful diet, higher energy intake and higher snack intake
(31;328
33)
and partake in less physical activity
(33). This suggests that the food preferences of UE and
329
EE can impact adversely upon weight status.
330
331
CTFEQr17, Food and Taste Preference
332
Higher preferences for HFSA, HFSW, high carbohydrate and high fat foods were evident in
333
those children who were characterised with higher UE and EE scores; this relationship was
334
particularly strong in girls. This taste preference pattern reflects evidence from adult
335
populations, which have shown a higher preference for high fat foods in UE and EE adults
(34).
336
A preference for HFSW foods in individuals with a high EE has also been found to be
337
particularly strong in women compared to men
(34). This indicates that the taste preferences,
338
and associated sex differences, found in adults are also found in children and adolescents,
339
suggesting these preferences begin in childhood and persist into adulthood. Furthermore, UE
340
and EE are characterised by eating in response to the palatability of food, eating
341
opportunistically and eating in response to negative affect. Individuals with a HUE and HEE
342
report a higher preference for high fat (savoury and sweet) and high carbohydrate foods
(34;35).
343
These foods typically reflect highly palatable, energy dense foods (e.g. crisps, sausage roll,
344
biscuits, cakes). Due to their macronutrient content, these foods have a relatively low satiating
345
ability
(36), and eating them can result in passive overconsumption
(37), increasing vulnerability
12
to future weight gain
(38). Indeed, this is reflected in adult data where UE and EE are related to
347
higher body weight
(32;33).
348
349
Independently of CTFEQr17 scores, males were found to have a higher preference for high
350
protein food, HFSA and LFSA foods. This pattern has previously been reported in children and
351
adolescents
(39), and in adults
(40). In addition, younger children also reported higher food
352
preferences than older children, regardless of gender; this has also been previously reported
353
(39)
. Interestingly, food and taste preference were more strongly related to psychological factors
354
of the CTFEQr17 in girls than boys, whereas food preference was more strongly associated
355
with anthropometric measures in boys. This is despite no difference in sex being reported for
356
CR and EE, and boys scoring higher on the UE scale. Existing evidence purports that females
357
tend to score more highly on CR, UE and EE in adolescents
(41), on EE in adults
(14;42)and CR
358
in adults
(43;44). Thus, females are reporting a higher influence of psychological eating
359
behaviour traits over their eating behaviour. The reason for this sex difference is unclear and
360
needs to be further elucidated.
361
362
Strengths and Limitations
363
A strength of this study is that the CTFEQr17 was both statistically and qualitatively verified
364
as valid. The development of the CTFEQr17 involved creating accessible items by using the
365
children/adolescent’s own phraseology ascertained from interviews.
This produced a
366
questionnaire that was highly understandable for children and adolescents. However, although
367
associations between the CTFEQr17 and food and taste preference were found, measurement
368
of actual food intake was not carried out. Food preferences and the relationship between
369
‘liking’ and ‘wanting’ of foods have been found to be related to food intake
(45)and also
370
associated with TFEQ factors in adults
(e.g. 46), thus an examination of this relationship in
371
children and adolescents would be beneficial. A further limitation of the study is that body
372
composition was not assessed; with research suggesting measurement of actual body
373
composition is more accurate in determining relevant relationships than BMI
(47, 48). Research
374
by Martin-Garcia et al.,
(19)also found an association between fat mass and CR in children and
375
adolescents, therefore further exploration of this is of interest. Furthermore, although our
376
sample size was adequate for the intended analysis, there were a larger proportion of secondary
13
school children; further consideration of the CTFEQr17 in primary school children would be
378
interesting. However, our sample did reflect that which was used to validate the Spanish
379
TFEQr21C
(19).
380
381
382
CONCLUSION
383
The CTFEQr17 shows good internal consistency and is suitable for use in children and
384
adolescents. The factor of CR was found to be associated with higher body weight, BMI and
385
BMI percentile, thus those children who were larger showed more restrictive eating behaviours.
386
Both UE and EE were associated with a higher preference for HFSA and HFSW foods, which
387
is consistent with adult data and demonstrates that children with these eating behaviour traits
388
have less healthy food preferences. Furthermore, a sex difference in the relationships between
389
CTFEQr17 factors, anthropometric measurements and food preferences was apparent, whereby
390
a stronger relationship was observed in girls. Collectively, the CTFEQr17 appears to be a valid
391
and suitable tool to measure eating behaviour traits in children and adolescents.
392
393
394
APPENDIX 1
395
The items have been coded as in the original TFEQr21
(13).
396
1.
I eat small portions of food to help control my weight: Totally true (4); Mostly true
397
(3); Mostly false (2); Totally false (1).
398
2.
I start to eat when I feel worried: Totally true (4); Mostly true (3); Mostly false (2);
399
Totally false (1).
400
3.
Sometimes when I start eating, it seems I can’t stop: Totally true (4); Mostly true (3);
401
Mostly false (2); Totally false (1).
402
4.
When I am sad, I usually eat too much: Totally true (4); Mostly true (3); Mostly false
403
(2); Totally false (1).
404
5.
I don’t eat some kinds of food because they can make me fat: Totally true (4); Mostly
405
true (3); Mostly false (2); Totally false (1).
14
6.
When I am next to someone who is eating, I also feel like eating: Totally true (4);
407
Mostly true (3); Mostly false (2); Totally false (1).
408
7.
When I feel angry, I need to eat: Totally true (4); Mostly true (3); Mostly false (2);
409
Totally false (1).
410
8.
I often get so hungry that I feel like I could eat loads of food without getting full:
411
Totally true (4); Mostly true (3); Mostly false (2); Totally false (1).
412
9.
When I am hungry, I feel like to have to eat all of the food on my plate in one go,
413
without stopping: Totally true (4); Mostly true (3); Mostly false (2); Totally false (1).
414
10.
When I feel lonely, I make myself feel better by eating: Totally true (4); Mostly true
415
(3); Mostly false (2); Totally false (1).
416
11.
I eat less than I want at meal times to stop myself putting on weight: Totally true (4);
417
Mostly true (3); Mostly false (2); Totally false (1).
418
12.
When I smell or see my favourite food, I find it hard to stop myself from eating it,
419
even if I’ve just finished a meal: Totally true (4); Mostly true (3); Mostly false (2); Totally
420
false (1).
421
13.
I’m always hungry enou
gh to eat at any time: Totally true (4); Mostly true (3); Mostly
422
false (2); Totally false (1).
423
14.
If I feel nervous, I try to calm myself down by eating: Totally true (4); Mostly true
424
(3); Mostly false (2); Totally false (1).
425
15.
When I see something that looks delicious, I get so hungry that I have to eat it right
426
away: Totally true (4); Mostly true (3); Mostly false (2); Totally false (1).
427
16.
When I feel really upset, I want to eat: Totally true (4); Mostly true (3); Mostly false
428
(2); Totally false (1).
429
17.
How often do you feel hungry? Only at mealtimes (1); Sometimes between meals (2);
430
Often between meals (3); Almost always (4).
431
432
REFERENCES
15 434
1.
The GBD 2015 Obesity Collaborators (2017) Health Effects of Overweight and Obesity
435
in 195 Countries over 25 Years. The New Eng. J. Med. Published online 12
thJune 2017:
436
DOI: 10.1056/NEJMoa1614362 437
2.
Ogden CL, Lamb MM, Carroll MD et al. (2010) Obesity and socioeconomic status in
438
children and adolescents: United States, 2005-2008. NCHS Data Brief. 51, 1-8.
439
3.
Cattaneo A, Monasta L, Stamatakis E et al. (2010) Overweight and obesity in infants
440
and pre-school children in the European Union: a review of existing data. Obes Rev.
441
11, 389-98.
442
4.
Swinburn, B., Egger, G., & Raza, F. (1999) Dissecting obesogenic environments: the
443
development and application of a framework for identifying and prioritizing
444
environmental interventions for obesity. Prev. Med. 29, 563
–
570.
445
5.
Swinburn BA, Sacks G, Hall KD et al. (2011) The global obesity pandemic: shaped by
446
global drivers and local environments. Lancet. 378, 804-14.
447
6.
Gallant AR, Tremblay A, Perusse et al. (2010) The Three-Factor Eating Questionnaire
448
and BMI in adolescents: results from the Que´bec Family Study. Brit. J. Nutr. 104,
449
1074-9.
450
7.
Chaput JP, Leblanc C, Pérusse L et al. (2009) Risk factors for adult overweight and
451
obesity in the Quebec Family Study: have we been barking up the wrong tree? Obesity.
452
17, 1964-70.
453
8.
van Strien T, Herman CP, Verheijden MW (2012) Eating style, overeating and weight
454
gain. A prospective 2-year follow-up study in a representative Dutch sample. Appetite.
455
59, 782-9.
456
9.
Snoek HM, Engels RC, van Strien T et al (2013) Emotional, external and restrained
457
eating behaviour and BMI trajectories in adolescence. Appetite. 67, 81-7.
458
10. Polivy J, & Herman, CP (1976) Effects of alcohol on eating behavior: influence of
459
mood and perceived intoxication. J. Abnorm. Psych. 85, 601.
460
11. Meyer JE, & Pudel VE (1977). Experimental feeding in man: a behavioral approach to
461
obesity. Psych. Med. 39, 153-157.
462
12. Bryant EJ, King NA & Blundell JE (2008) Disinhibition: its effect on appetite and
463
weight regulation. Ob. Rev. 9, 409-419.
464
13. Cappelleri JC, Bushmakin AG, Gerber RA et al. (2009) Psychometric analysis of the
465
Three-Factor Eating Questionnaire-R21: results from a large diverse sample of obese
466
and non-obese participants. Int. J. Obes. 33, 611
–
620.
16
14. Karlsson J, Persson LO, Sjostrom L et al. (2000) Psychometric properties and factor
468
structure of the Three-Factor Eating Questionnaire (TFEQ) in obese men and women.
469
Results from the Swedish Obese Subjects (SOS) study. Int. J. Obes. 24, 1715
–
1725.
470
15. Stunkard AJ, & Messick S (1985). The three-factor eating questionnaire to measure
471
dietary restraint, disinhibition and hunger. J. Psychosom. Res. 29, 71-83.
472
16.
Karakuş SŞ, Yıldırım, H, & Büyüköztürk
Ş (2016)
Adaptation of three factor eating
473
questionnaire (TFEQ-R21) into Turkish culture: A validity and reliability study. TAF
474
Prevent. Med. Bull. 15, 229-237.
475
17. Drapeau V, Depres JP, Bouchard C et al (2004) Modifications in food-group
476
consumption are related to long-term body-weight changes. Am. J. Clin. Nutr. 80,
29-477
37.
478
18. de Medeiros ACQ, Yamamoto ME, Pedrosa LFC et al. (2016). The Brazilian version
479
of the three-factor eating questionnaire-R21: psychometric evaluation and scoring
480
pattern. Eat. Weight Dis. 22, 169-175.
481
19. Martín-García M, Vila-Maldonado S, Rodríguez-Gómez I, et al. (2016) The Spanish
482
version of the Three Factor Eating Questionnaire-R21 for children and adolescents
483
(TFEQ-R21C): Psychometric analysis and relationships with body composition and
484
fitness variables. Physiol Behav. 165, 350-7.
485
20. de Onis M, Onyango AW, Borghi E et al. (2007) Development of a WHO growth
486
reference for school-aged children and adolescents. Bull. WHO. 85, 660-67.
487
21. Halford JCG, Boyland E J, Cooper GD et al. (2008) Children's food preferences:
488
Effects of weight status, food type, branding and television food advertisements
489
(commercials). Int. J.Ped. Obes. 3, 31-38.
490
22. Halberstadt J, van Strien T, de Vet E et al. (2016) The association of eating styles
491
with weight change after an intensive combination lifestyle intervention for children
492
and adolescents with severe obesity. Appetite. 99, 82-90.
493
23. Stroebe W, van Koningsbruggen GM, Papies EK et al. (2013) Why most dieters fail
494
but some succees: A goal conflict model of eating behavior. Psych. Rev. 120,
110-495
138.
496
24.
Veling H, Aarts H, & Papies EK (2011) Using stop signals to inhibit chronic dieters’
497
responses toward palatable foods. Beh. Res. & Therapy. 49, 771-780.
498
25. van Strien T, Herman CP, Verheijden MW (2014) Dietary restraint and body mass
499
change. A 3-year follow-up study in a representative Dutch sample. Appetite. 76,
44-500
49.
17
26. Kemps E, Herman CP, Hollitt S et al. (2016) The role of expectations in the effect of
502
food exposure on food intake. Appetite. 103, 259-264.
503
27. Graham A, Gluck ME, Votruba SB et al (2014) Perseveration augments the effect of
504
cognitive restraint on ad libitum food intake in adults seeking weight loss. Appetite.
505
82, 78-84.
506
28. Roberts CJ, Campbell IC & Troop N (2013) Increases in weight during chronic stress
507
are partially associated with a switch in food choice towards increased carbohydrate
508
and saturated fat intake. Euro. Eating Dis. Rev. 22, 77-82.
509
29. Bryant EJ, Kiezebrink K, King NA et al (2010) Interaction between disinhibition and
510
restraint: implications for body weight and eating disturbance. Eat. Weight Disord.
511
15, e43
–
e51.
512
30. Angle S, Engblom J, Eriksson T et al (2009) Three Factor Eating Questionnaire R18
513
as a measure of cognitive restraint, uncontrolled eating and emotional eating in a
514
sample of young Finnish females. Int. J. Beh. Nutr & Phys. Activity. 6, 41-48.
515
31. de Lauzon B, Roman M, Deschamps V et al (2004) The Three Factor Eating
516
Questionnaire R18 is able to distinguish among different eating patterns in the general
517
population. Am. Soc. Nutr. Sci. 134, 2372-2380.
518
32. Konttinen H, Haukala A, Sarlio-Lahteenkarva S et al (2009) Eating styles,
self-519
control and obesity indicators. The moderating role of obesity status and dieting
520
history on restrained eating. Appetite. 53, 131-134.
521
33. Green GW, Schembre SM, White AA et al. (2011) Identifying clusters of college
522
students at elevated health risk based on eating and exercise behaviors and
523
psychosocial determinants of body weight. J. Am. Dietetic Assoc. 111, 394-400.
524
34. Keskitalo K, Tuorila H, Spector TD et al (2008) The Three Factor Eating
525
Questionnaire, body mass index, and responses to sweet and salty fatty foods: a twin
526
study of genetic and environmental associations. Am. J. Clin. Nutr. 88, 263-71.
527
35. Camilleri GM, Mejean C, Kesse-Guyot E et al. (2014) The associations between
528
emotional eating and consumption of energy-dense snack foods are modified by sex
529
and depressive symptomology. J. Nutr. doi: 10.3945/jn.114.193177.
530
36. Gerstein DE, Woodward-Lopez G, Evans AE et al. (2004) Clarifying concepts about
531
macronutrients’ effects on satiation and satiety.
J. Am. Diet. Assoc. 104, 1151-1153.
532
37. Westerterp KR (2006) Perception, passive overfeeding and energy metabolism. Phys.
533
Behav. 89, 62-65.
18
38. Blundell JE & MacDiarmid JI (1997) Fat as a risk factor for overconsumption:
535
satiation, satiety and patterns of eating. J. Am. Diet. Assoc. 97, S63-S69.
536
39. Caine-Bish NL & Scheule B (2009) Gender differences in food preferences of
school-537
aged children and adolescents. J. Sch. Health. 79, 532-540.
538
40. Arganini C, Saba A, Comitato F, Turrini A (2012) Gender differences in food choice
539
and dietary intake in modern western societies. Public Health
–
Social and Behavioral
540
Health. Chapter 4. Intech: open science.
541
41. Vagstrand K, Linne Y, Karlsson J et al (2009) Correlates of soft drink and fruit juice
542
consumption among Swedish adolescents. Brit. J. Nutr. 101, 1541-1548.
543
42. Peneau S, Menard E, Mejean C et al. (2013) Sex and dieting modify the association
544
between emotional eating and weight status. Am. Soc. Nutr. 97, 1307-1313.
545
43. Hainer V, Kanesova M, Bellisle F et al. (2006) The Eating Inventory, body adiposity
546
and prevention of diseases in a quota of Czech adults. Int. J. Obes. 30, 830-36.
547
44. Provencher V, Drapeau V, Tremblay A et al (2003) Eating behaviors and indices of
548
body composition in men and women from the Quebec family study. Obes. Res. 11,
549
783-792.
550
45. Finlayson G, Dalton M (2012) Current progress in the assessment of 'liking' vs.
551
'wanting' food in human appetite. Comment on '"You say it's liking, i say it's
552
wanting...". On the difficulty of disentangling food reward in man'. Appetite. 58,
373-553
378.
554
46. Finlayson G, Bordes I, Griffioen-Roose S et al. (2012) Susceptibility to Overeating
555
Affects the Impact of Savory or Sweet Drinks on Satiation, Reward, and Food Intake
556
in Nonobese Women. Am. Soc. Nutr. 142, 125-130.
557
47.
Prentice AM, and Jebb SA (2001) Beyond body mass index.
Ob. Rev
.
2
,
141-558
147.
559
48.
Wells JCK, Coward WA, Cole TJ
et al
. (2002) The contribution of fat and
fat-560
free tissue to body mass index in contemporary children and the reference
561
child.
Int. J. Obes. Rel. Metab. Dis.
26
, 1323-1329.
562
563
564
565
19 567
568
569
570
571
572
573
574
575
576
577
578
579
580
[image:20.595.73.520.542.755.2]581
Table 1. Rotated factor structure loading of the CTFEQr17.
582
Uncontrolled
Eating
Emotional
Eating
Cognitive
Restraint
(1)
Communalities
12. When I smell or see my
favourite food, I find it hard
to stop myself from eating it,
even if I’ve just finished a
meal.
0.73
0.56
8. I often get so hungry that I
feel like I could eat loads of
food without getting full.
0.72
0.53
15. When I see something
that looks delicious, I get so
0.70
20
hungry that I have to eat it
right away.
3. Sometimes when I start
eating, it seems I can’t stop.
0.69
0.52
6. When I am next to
someone who is eating, I
also feel like eating.
0.67
0.51
13. I’m always hungry
enough to eat at any time.
0.66
0.49
20. How often do you feel
hungry?
0.63
0.47
9. When I am hungry, I feel
like to have to eat all of the
food on my plate in one go,
without stopping.
0.61
0.45
16. When I feel really upset,
I want to eat.
0.81
0.67
14. If I feel nervous, I try to
calm myself down by eating.
0.73
0.60
2. I start to eat when I feel
worried.
0.72
0.55
7. When I feel angry, I need
to eat.
0.68
0.49
4. When I am sad, I usually
eat too much.
0.66
0.49
10. When I feel lonely, I
make myself feel better by
eating.
0.65
0.51
1. I eat small portions of
food to help control my
weight.
0.80
0.64
11. I eat less than I want at
meal times to stop myself
putting on weight.
0.78
21
5. I don’t eat some kinds of
food because they can make
me fat.
0.72
0.55
Explained variance
31.20 12.75 9.54
Cumulative variance
31.20 43.95 53.45
583
584
585
586
587
588
589
590
591
592
593
594
595
596
597
598
[image:22.595.65.526.614.755.2]599
Table 2. CTFEQr17 factor scores between age groups and sex.
600
Primary School (7-10 years)
Secondary School (11-15years)
Boys (n = 46)
Girls (n = 39)
Boys (n =
184)
Girls (n =
174)
CR
2.38 (0.78)#
2.52 (0.81)#
2.37 (0.72)
2.16 (0.66)
UE
2.88 (0.87)*#
2.50 (0.88)#
2.25 (0.59)*
2.11 (0.64)
EE
1.52 (0.61)
1.65 (0.65)
1.48 (0.54)
1.58 (0.63)
Data are presented as mean (SD).
22
CR, cognitive restraint; UE, uncontrolled eating; EE, emotional eating.
602
*Boys have a significantly higher UE score compared to girls (p<0.001).
603
#Younger children have a significantly higher CR and UE compared to older children
604
(p<0.01).
605
23
Table 3. Body measurements and food preference by CTFEQr17 groups.
607
Low CR
High CR
Low UE
High UE
Low EE
High EE
Boys
(n =
48)
Girls
(n =
55)
Boys
(n =
82)
Girls
(n =
66)
Boys
(n =
48)
Girls
(n =
55)
Boys
(n =
82)
Girls
(n =
66)
Boys
(n =
48)
Girls
(n =
55)
Boys
(n =
82)
Girls
(n =
66)
Weight (kg)
44.41
(16.71)
45.60
(12.78)
48.37
(17.91)
45.77
(16.88)
50.29
(18.54)
47.85
(14.69)
44.85
(16.63)
43.63
(15.51)
45.92
(17.21)
48.01
(15.52)
47.73
(17.84)
43.52
(14.57)
BMI
(kg/m
2)
18.60
(3.72)
19.47
(3.78)
20.02
(4.72)
20.36
(4.94)
20.35
(5.04)
20.25
(4.47)
18.99
(3.93)
19.69
(4.52)
19.59
(4.70)
20.31
(4.43)
19.49
(4.28)
19.64
(4.51)
BMI
percentile
50.34
(31.90)
51.24
(31.36)
60.69
(30.27)
63.32
(29.53)
60.86
(32.79)
56.69
(31.62)
54.81
(29.93)
59.17
(30.46)
60.69
(30.87)
58.81
(29.42)
54.92
(31.23)
57.19
(32.30)
%
overweight
/ obese
118.2
11.1
22.4
25.0
24.2
15.9
17.9
23.1
26.0
15.3
17.7
22.2
Data are shown as mean (SD).
608
CR, cognitive restraint; UE, uncontrolled eating; EE, emotional eating; BMI, body mass index.
609
1
Based on the World Health Organization criteria.
610
¶ = high CR, UE or EE group was significantly different to low CR, UE or EE group
611
612
613
614
24 616
Table 4
–
Food preference by sex and CTFEQr17 groups
617
CR
UE
EE
Low
High
Mean
Sex
Score
Low
High
Mean
Sex
Score
Low
High
Mean
Sex
Score
High
Protein
Preference
Boys
2.91
(2.96)
2.42
(2.25)
2.59
(2.52)
1.82
(1.98)
3.09
(2.71)
2.59
(2.52)
2.59
(2.92)
2.59
(2.23)
2.59
(2.52)
Girls
1.19
(1.66)
1.56
(1.82)
1.40
(1.76)*
0.79
(1.03)
2.03
(2.11)
1.40
(1.77)*
0.93
(1.40)
1.83
(1.95)
1.40
(1.76)*
Mean
CTFEQr17
Score
1.97
(2.48)
2.03
(2.11)
1.25
(1.61)
2.63
(2.52)
¶1.71
(2.38)
2.24
(2.13)
High
Carbohydr
ate
Preference
Boys
3.27
(2.23)
3.24
(2.17)
3.25
(2.19)
2.50
(2.09)
3.74
(2.12)
3.25
(2.19)
3.29
(2.19)
3.22
(2.20)
3.25
(2.19)
Girls
2.36
(1.96)
3.35
(2.02)
2.92
(2.05)
2.21
(1.93)
3.68
(1.92)
2.93
(2.05)
2.28
(2.13)
3.51
(1.80)
2.92
(2.05)
Mean
CTFEQr17
Score
2.77
(2.13)
3.29
(2.11)
2.34
(2.00)
3.71
(2.02)
¶2.75
(2.21)
3.35
(2.03)
¶High Fat
Preference
Boys
3.45
(2.19)
3.51
(2.43)
3.50
(2.34)
2.86
(2.63)
3.90
(2.05)
3.50
(2.34)
3.29
(2.26)
3.63
(2.40)
3.50
(2.34)
Girls
3.64
(2.47)
3.51
(1.74)
3.57
(2.08)
2.77
(1.38)
4.42
(2.35)
3.58
(2.09)
3.05
(1.61)
4.05
(2.36)
3.57
(2.08)
Mean
CTFEQr17
Score
3.56
(2.34)
3.51
(2.14)
2.81
(2.03)
4.13
(2.20)
¶3.17
(1.93)
3.82
(2.38)
¶Low
Energy
Preference
Boys
3.25
(2.31)
3.01
(1.82)
3.10
(2.15)
3.28
(2.05)
2.97
(1.97)
3.10
(2.00)
3.45
(2.35)
2.85
(1.70)
3.10
(2.00)
Girls
2.49
25