• No results found

Statistical shape methodology for the analysis of helices

N/A
N/A
Protected

Academic year: 2019

Share "Statistical shape methodology for the analysis of helices"

Copied!
25
0
0

Loading.... (view fulltext now)

Full text

Loading

Figure

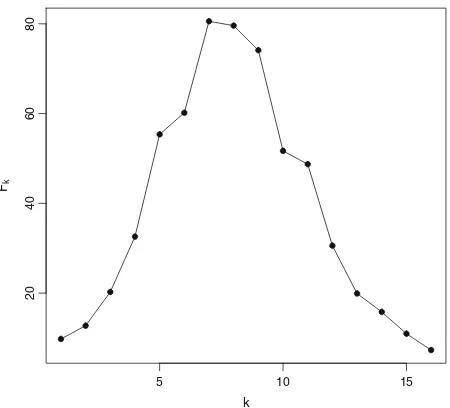
Figure 5(d) in the web supplement to Mardia et al. (2018), where
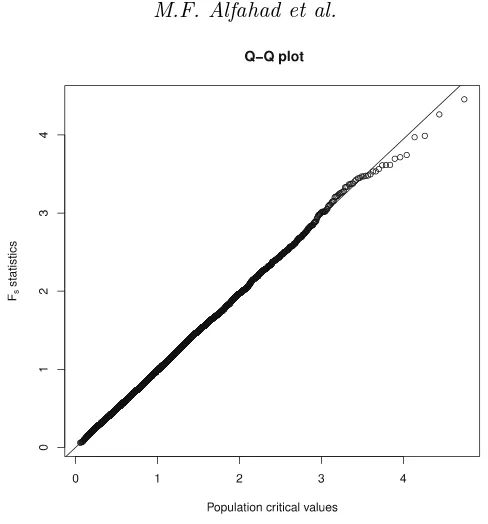
Figure 1: The Q-Q plot of 10,000 simulated Fkquantiles from the F-distribution for the example in Section-statistics from Eq
Table 1: Threshold Ffor ∗(0.05)maxwith nboot = 1000 simulations for various choices n, the number of landmarks, and σ2, the error variance
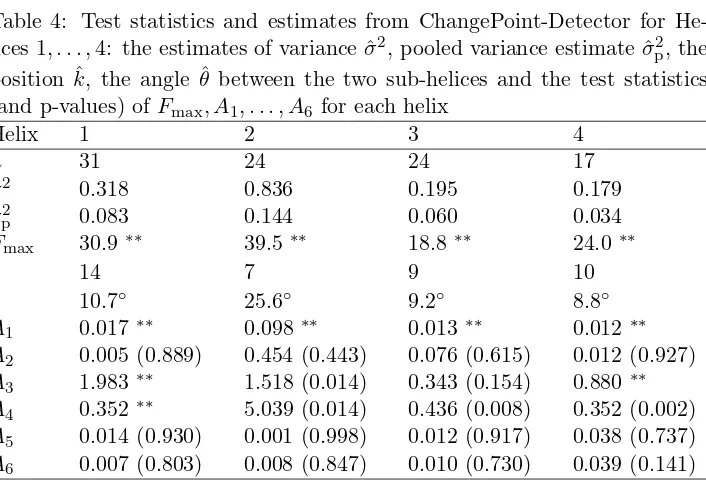
Table 2: The ChangePoint-Detector estimates of ˆσtics2, ˆσ2p, ˆk, ˆθ, the statis- Fmax, A1,
+7

References

Related documents