Agriculture in the European Union: Statistical and economic information 1999
284
0
0
Full text
(2)
(3) Our mission is to provide the European Union with a highquality statistical information service E u r O S t a t ' S C o l l e c t i o n s are adapted to the needs of all users. You will find them in each of the nine themes proposed by Eurostat.. Eurostat's collections. d. 1 General statistics. ¿¡ÎjÊïk:\ β External trade. 2 Economy and finance. ^ΐΓ~. 7 Transport. 3 Population and social conditions. g. 8 Environment and energy 9 Research and development. 4 Industry, trade and services. m. 5 Agriculture and fisheries. ΠΤΠ Graphs. Comments. Press releases: key figures o n the EU, the Member States and their partners. They are provided free of charge. They are also available o n t h e Internet as soon as they are published (http://europa.eu.int/eurostat.html). Statistics in focus: up-to-date summaries o f the main results of statistical surveys, studies and analyses. Key indicators: the main indicators o n a theme or subtheme in an easy-to-carry Panorama o f t h e European U n i o n : highlights t h e features and trends of a multisectoral t h e m e or a sectoral sub-theme.. CONTENT. m \n\m. mφ. lllie Illie. FORMAT Paper HTML PDF. Paper PDF. Booklet Paper HTML Paper CD-ROM. Paper CD-ROM. M e t h o d s a n d nomenclatures: intended f o r specialists w h o w a n t t o con-suit the methodologies and nomencla tures used for a theme, a sub-theme or a sector. Detailed tables: statistical data f o r specialists compiled on a theme, sub-theme or sector, (mettre les icones). HH. Paper CD-ROM. Research in official statistics: summarise the results of European statistical studies and research and are intended for specialists.. Paper CD-ROM. Catalogues: free-of-charge rapid access t o concise infor mation' on Eurostat's products and services.. Paper.
(4) In the collection GraphAgri • La forêt et les industries du bois 2000 • L'agriculture, • L'agriculture. la forêt et les industries agroalimentaires et I''agroalimentaire. dans les régions. 1999. 1997. The « GraphAgri » collection endeavours to describe the various aspects of the world of the food processing industry and forestry in the form of pocket encyclopaedias. The different volumes are periodically revised and updated..
(5) Agriculture ¡n the European Union. 1999 Data available as of 1 November 1998. È M I N I S T È R E DE L'AGRICULTURE ET DE LA PÈCII E. Service Central des Enquêtes et Études Statistiques.
(6) Contents List of contents Key to abbreviations and symbols States and regions. 4 8 10. TOPICS GENERAL FACTS A N D FIGURES The European Union Overall budget Agricultural budget Agriculture in the economy. 16 18 20 22. LAND USE Land distribution Farmland Arable land Forest and w o o d l a n d. 26 28 30 32. POPULATION A N D EMPLOYMENT Employment in agriculture, forestry, hunting and fishing Types of labour in agriculture Employment and age in agriculture Work time and multiple activities in agriculture Employment in the farming and food industries. 34 36 38 40 42. ENTERPRISES Farms Average size of farms Distribution of farms by size Economic scale of farms Farming tenure Type of farming Forest ownership Fishing fleet. 44 46 48 50 52 54 56 58. ECONOMY Final agricultural output by country Development of final agricultural output Final agricultural output by sector Intermediate agricultural consumption Development of intermediate agricultural consumption Incomes in agriculture. 60 62 64 66 68 70. GraphAgri Europe 1999.
(7) Contents. Incomes per family work unit Investment in agriculture Debts in agricultureFarming and food industriesFarming and food industries. Final foresty output PRODUCTS Cereal production Cereal balance sheets Wheat production Wheat balance sheets Wheat flour and biscuits. Barley production Barley balance sheets Beer Maize production Maize balance sheets Potato production Potato balance Sugar beet p r o d u c t i o n . Sugar balance sheets. Oleaginous seed and fruit production Oleaginous seed and fruit balance sheets Rape production Rape balance sheets Sunflower production Sunflower balance sheets Balance sheets for vegetable fats and oils Oilcake and cattle-cake balance sheets. Olive oil balance sheets. Fresh vegetable production Tomato balance sheets Table fruit production Apple balance sheets Citrus balance sheets W i n e balance sheets_ Cattle rearing Beef balance sheets. Pig farming.. Pork balance sheets Sheep and goat farming Sheep and goat meat balance sheets Poultry farming Poultry meat balance sheets.. 72 74 76 78 -80 82 _84 _86 _88 _90 _92 _94 96 _98 100 102 104 J 06 108 110 112 J 14 116 118 .120 122 124 126 .128 130 132 134 136 138 140 142 144 146 148 150 152 154 156. GraphAgri Europe 1999.
(8) Contents. M i l k production M i l k and dairy products M i l k and dairy product balance sheets Egg balance sheets C o m p o u n d animal feed production Chocolate and confectionery Logging Timber harvest Timber balance sheets Fish and fish-farming Fishing : the European U n i o n in the w o r l d. 1 58 160 162 164 166 1 68 1 70 172 1 74 1 76 1 78. CONSUMPTION Household consumption Food consumption. 180 182. F O O D TRADE The European U n i o n and the w o r l d Trade w i t h non-member countries Trade between Member States. 186 188 190. COUNTRIES Belgium Denmark Germany Greece Spain France Ireland Italy Luxembourg Netherlands. 194 198 202 206 21 0 214 21 8 222 226 230. Portugal Finland Sweden United Kingdom. 238 242 246 250. Austria. GraphAgri Europe 1999. 234.
(9) Contents. APPENDICES The major stages of the European Union The major stages of Green Europe The principal features of the Common Agricultural Policy The world's major economic zones The agricultural policy of the United States Methodology For further information Index of acronyms Subject index. 256 257 258 260 261 263 264 268 269. GraphAgri Europe 1999.
(10) Key to abbreviations and symbols. UNITS ecu. European Currency Unit. ha hi kg kW 1. hectare (2.47 acres). M. symbol for one m i l l i o n (mega). m2. square metre. m3 q. cubic metre quintal = 100 kg. t eet. tonne equivalent carcass tonne. hectolitre (100 litres) kilogram (2.2 lb) kilowatt litre. A W U annual work unit ESU. economic size unit. COUNTRY ABBREVIATIONS (alphabetical order of countries by their native language) Β DK. Belgium Denmark. D GR. Germany Greece. E. Spain. F. France. IRL. Ireland. I L. Italy Luxembourg. NL. Netherlands. A. Austria. Ρ. Portugal. SF. Finland. S. Sweden. SIGNES CONVENTIONNELS. UK. United Kingdom. —. BLEU Belgium-Luxembourg. N o result. Economic Union. Information unavailable /// e. ε. Not applicable. EU. European U n i o n. Estimate. IS. Iceland. Figure lower than half of the unit. Ν. Norway. GraphAgri Europe 1999.
(11) Key to abbreviations and symbols. FRENCH OVERSEAS D EPARTEMENTS ( D O M ) Apart from exceptions noted at the bottom of the tables, the «FRANCE» totals refer to metropolitan France and do not include data relating to the overseas départements ( D O M ) . EFFECTS OF GEOGRAPHICAL CHANGES ■ European Union This work includes old statistics, prior to the EU enlargement to 1 5 (with the admission of Denmark, Ireland and the United Kingdom on 1 January 1973, Greece on 1 January 1 9 8 1 , Spain and Portugal on 1 January 1986, and Austria, Finland and Sweden on 1 January 1995). Unless otherwise stated, the data for Europe (EU in general) are based on EU and new Member State statistics. ■. Germany Germany was legally unified on 3 October 1990. Statistically speaking, this does not always apply. Please refer to footnotes on a casebycase basis. By convention : • Germany = unified Germany (or the former FRG and GDR combined) • exFRG = former FRG (or the western part of presentday Germany). ■ CIS, USSR The dissolution of the Union of Soviet Socialist Republics was declared at the end of 1 9 9 1 . Not counting the Baltic states, the States resulting from this dis solution have formed the CIS, or Commonwealth of Independent States. In this book, you w i l l find series relating to this unit (data prior to 1991 being those of the USSR) or, at times, series relating to the most important State, the Russian Federation usually called Russia). FOREIGN TRAD E W i t h the removal of fiscal and customs borders between the countries of the European U n i o n on 1 January 1993, the method of intracommunity trade col lection was altered. The record of these trade transactions is n o w made based on the Community Intrastat Regulation, w h i c h defines the conditions for recording trade in merchandise between European partners. Caution is advised when making comparisons w i t h the results of previous years. As from 1 January 1997, furthermore, the French overseas.départements are no longer regarded as foreign countries where foreign trade is concerned, but are now incorporated w i t h i n the national territory. In some instances, this may dis tort comparisons w i t h previous years. The tables concerned have been accom panied by a footnote.. GraphAgri Europe 1 999.
(12) States and regions. T. welve of the fifteen countries of the European U n i o n provide Eurostat w i t h regional data. O n l y D e n m a r k , Ireland and L u x e m b o u r g p r o vide just national data, on account either of their size or their p o p u l a t i o n . The number of regions varies markedly from one country to the next. In this p u b l i c a t i o n , w e have used five regions in. Portugal and Finland, eight in Sweden, but twenty in Italy and twentytwo in France. In some maps, w e have used a 96zone division for France and a 38zone one for Germany. These different divi sions are based o n the n o m e n c l a t u r e of the Eurostat statistical territorial units (Nuts).. European Union. *?£»". Source : Eurostat 10. ■. GraphAgri Europe 1999.
(13) States and regions. SchleswigHolstein. n. Pomerania. Berlin. North Rhine Westphalia. Belgium. Germany. Eastern Macedonia Thrace _ ^. Central Macedonia Western Macedonia C Epi rus £\. , S. Cantabria Asturias. '. ,. C ^Q~~~~^. s.. jL (. Basque Country Rioja Navarre. C. it_. iThessaly. r. Nortn. Aegean. Ionian ' ' ^ « ¡ ¿ τ Γ ^ ^ — Islands £ftT * i ** =SSk_, ^ Central Greece Western—/v«S s (~ Greece V1. 5¿TS). Péloponnèse. '. .. Crete ,. Greece. ^. & Balearic Isla Community of Valencia. \. }. υ. 1—*———^Soutn Aegean. Spain. GraphAgri Europe 1999 ■. 11.
(14) States and regions. Nord - Pas-de-Calais Upper Normandy^ 'vVi ChampagneArdenne Lower Lorraine Normandy. Trentino-Alto Adige Lombardy Friuli-Venezia-Giulia Val d'Aosta Piedmont. Veneto Emilia-Romagna The Marches. Alsace Burgundy Pays de la Loire. Franche-Comté Rhône-Alps Apulia. Provence-AI pes cóte d'Azur. Aquitaine Midi-Pyrénées—·. Basilicata. LanguedocRoussi||on Corse Île-de-France. France. Italy. Friesland... Croniní,en. NoordHolland. ί° ' S Lower ¿Vienna y^ Upper ~^J Austriar^fT' γfAustriaN, r^i. Vorarlberg. Flevoland Zuid-Holland. ^aLzbuj|r\. Tyrol \ i >. Zeeland. G^? Netherlands. 12. ■ GraphAgri Europe 1999. Limburg. Austria. s. «y ¡a. \ f. Carinthia J_^_^fBurgenland.
(15) States and regions. Portugal. I. North. L. Centre. I. Alentejo. /. Ç. /. Finland. Lisbon I A and the *~y<> Tagus valley I '. '. V?. AlgarveJ* Uusimaa. Northern Ireland / J. ^ ■Yorkshire and Humherside. Centraleastern Sweden. East Midlands. Southern Sweden. Sweden. United Kingdom Sydsverige. SouthWest. GraphAgri Europe 1 999. ι ;.
(16)
(17) Topics. GraphAgri Europe 1999 ■. 15.
(18) General facts and figures THE EUROPEAN U N I O N. W. ith 3 7 3 m i l l i o n i n h a b i t a n t s in 1 9 9 6 , the European U n i o n has a larger p o p u l a t i o n than the U n i t e d States, w i t h 266 m i l l i o n inha bitants a n d Japan w i t h 1 2 0 m i l l i o n . O f the Fifteen, G e r m a n y has the largest p o p u l a t i o n , w i t h 81.9 m i l l i o n inhabitants. France has 60.2 m i l l i o n , the United Kingdom 58.8 m i l l i o n and Italy 57.4 m i l l i o n . Germany also has the largest GDP, representing 2 7 % of the EU's combined GDP, ahead of France w i t h 1 8 % , Italy w i t h 1 4 % , and the U n i t e d Kingdom w i t h 1 3 % . Expressed as a purchasing power standard (PPS), the GDP per capita ranges f r o m 1 to 2.5, d e p e n d i n g o n the country. The highest are Luxembourg, with 25,500 ecus (PPS) per c a p i t a , D e n m a r k , B e l g i u m , Austria and Germany, where the figure is about 1 7 0 0 0 ecus. The lowest, w i t h about 1 0 0 0 0 ecus per capita, are Greece and Portugal. The average G D P per capita of EU-15 is 15 200 ecus. It is 44 % l o w e r than that of the U n i t e d States and 2 0 % lower than that of Japan. The percentage of the w o r k i n g population in the total population varies considerably from c o u n . try to country. The highest levels occur in the nor thern states: D e n m a r k ( 5 3 % ) , Sweden ( 4 9 % ) and the U n i t e d K i n g d o m ( 4 8 % ) . The lowest levels, from 39 to 4 0 % , occur in Italy, Greece, Ireland and Spain. Definitions Gross domestic product (GDP) : ¡his measures the productive activity achieved in the national economy. The CDP corresponds to the sum of the value of goods and services available for end use in the economic territory and of the balance of total foreign trade, it is also equal to the sum of the added values of the different sectors, plus the VAT levied on products and taxes, net of subsidies, on imports. Purchasing power standard (PPS) : because monetary parities do not reflect domestic purchasing powers of currencies, comparisons in ecus do not measure the real differences between countries. The purchasing power standard makes it possible to eliminate the effects of price level differences and make real value comparisons. Active population : all those persons either exercising or seeking a professional activity at a given date in the various sectors of economic activity.. Principal economic indicators in 1996 Population Number. Share per country. Belgium Denmark Germany Greece Spain France Ireland Italy Luxembourg Netherlands Austria Portugal Finland Sweden United Kingdom EU-15. Share per country. billion ecus. %. 157 262 896 476 270 375 626 397 416 531 059 927 125 841 802. 2.7 1.4 22.0 2.8 10.5 15.6 1.0 15.4 0.1 4.2 2.2 2.7 1.4 2.4 15.8. 211 138 1 854 96 461 1 210 56 956 13 312 180 82 99 198 908. 3.1 2.0 27.4 1.4 6.8 17.9 0.8 14.1 0.2 4.6 2.7 1.2 1.5 2.9 13.4. 373158. 100.0. 6 774. 100.0. 10 5 81 10 39 58 3 57 15 8 9 5 8 58. Source : Eurostat - Newcronos. 16. Nominal. %. thousand. GraphAgri Europe 1999. A c t i v e population. Gross domestic product GDP per capita. Number. ecu (PPS). thousand. 17 17 16 10 11 16 15 15 25 16 16 10 14 15 14. 200 700 700 000 800 200 000 700 500 500 900 300 900 200 700. 15 200. 4 2 38 4 15 25 1 22. Share per country. Share in total population. %. 164 791 736 145 754 211 448 479 170 349 779 540 426 346 081. 2.5 1.7 23.4 2.5 9.5 15.2 0.9 13.6 0.1 4.4 2.3 2.7 1.5 2.6 17.0. 41.0 53.0 47.3 39.6 40.1 43.2 39.9 39.2 40.9 47.3 46.9 45.7 47.3 49.2 47.8. 165 4 2 0. 100.0. 44.3. 7 3 4 2 4 28.
(19) General facts and figures THE EUROPEAN U N I O N. Luxembourg, the highest GDP per capita Gross domestic product per capita in 1996 ecu (SPA) Luxembourg. 25 500. Denmark. ■. Belgium. 17 700. | 1 7 200. Austria. 16 900. ( iermany. | 1 6 700. Netherlands. I 16 500. France. 16 200. Italy Sweden. ■ i 15 700 I. 1 5 200. Ireland. | 15 000. Finland. | 14 900. United Kingdom. 14 700. Spain. | 11 800. Portugal. 10 300. Greece. 10 000. Germany, the highest contribution to the European GDP Contributions to european GDP in 1996 Germany. ",.. J. France. lii. Italy United Kingdom. I I 1i. Spain Netherlands Belgium Austria Sweden I >i t i l l 1.11 k. ( Irei'« e Ireland Portugal Finland Luxembourg. .Source ; Eurostat Newcronos. GraphAgri Europe 1999. 17.
(20) General facts and figures OVERALL BUDGET. I. n 1 9 9 7 , the c o m m u n i t y budget resources exceeded 82 b i l l i o n ecus. Fourfifths derive equally from VAT and G N P resources, these later having risen by a factor of eight between 1990 and 1997. Customs dues contribute a little more than oneseventh. In 1997, Germany provided slightly more than o n e q u a r t e r of these resources If w e add the contributions from France, Italy and the United Kingdom, w e have 7 0 % of community resources. The EAGGF Guarantee Fund represented one half of c o m m u n i t y expenditures in 1996. It has nevertheless increased less markedly in the last few years than almost every other item. In 1997, the Regional and Transport Fund was the n u m ber t w o expenditure item, ahead of the Social Fund. The Regional and Transport Fund expen ditures have risen more than any other since 1985, by a factor of 7.9.. Definitions Ecu : an abbreviation of European currency unit, the ecu is the linchpin of the European monetary system and is defined by a basket of Member state curren cies. The ecu will be replaced on 7 January 2002 by the euro. Gross National Product (GNP) : the gross national product of a country is equal to its gross domestic product, i.e the sum of gross added values, plus the external balance of the payment of employees and revenues from property and business. European Agricultural Guidance and Guarantee Fund (EAGGF) : funding agency for the common agricultural policy, which implements the CAP's essential principles: community preference and financial cooperation. It is made up of a «guarantee » section funding various operations concerning the agricultural market, and a «guidance» section funding agricultural structural improvement. DC : Developing country.. Community resources and expenditures 1 1985. 1990. 1995. 1996. 1997. million ecus Own resources Agricultural levies Sugar contributions Customs dues VAT resources G N P resources Other resources. 1 122 1 057 8310 15 592. Total resources. 28 4 0 6. 2 3252. 1 056 820 10285 27 4 4 0 95 6 773. 1 12 39 21. 46 469. 76 5 2 7. 852 112 942 423 681 517. 1 11 35 19. 729 092 762 677 251 961. 6 9 4723. 1 12 34 31 1. 786 229 203 588 789 770. 82 366. Annual payments by ector Total farm fund inch EAGGF guarantee inch EAGGF guidance Social Fund Regional f u n d and transport Research, energy and industry D C and nonmember country coop. Reimbursement to M e m b e r States Other expenditures. 20 546 19 744 721 1 491 1 677 756 1 085 1 248 1 296. 28 26 1 3 4 1 1 1 2. Total expenditures. 28 0 9 9. 43 3 2 5. 595 475 825 546 902 739 225 020 298. 37 34 3 5 11 3 3 1 3. 813 511 102 918 028 089 374 619 916. 66 757. 43 39 3 7 13 3 3. 385 0424 9114 357 784 527 805 936 4 007. 45 578. 76 8003. 82 366. 1. Ten member states in 1985, 12 in Í9Í >0, and 15 with the extension of Germany in 1995. 2. Including advances of Member States 3. Expenditures are greater than resourc ?s; the difference has been met by surpluses in previous years. 4. Apart from payments made directly b v the C ommission.. Source : Commission européenne 18. ■ GraphAgri Europe 1999. 7 14 3 4. 850 976 907 827 945 4 284.
(21) General facts and figures OVERALL BUDGET Distribution of the five main resources by Member State in 1997 Agricultural levies. Sugar contribution. Customs dues. VAT resources. GNP resources. million ecus Belgium Denmark Germany Greece Spain France Ireland Italy Luxembourg Netherlands Austria Portugal Finland Sweden United Kingdom. 54 7 116 7 122 52 2 72 0 69 15 45 20 34 171. 75 42 339 19 50 337 13 131 0 82 33 1 9 24 75. 930 217 2 982 125 474 1 289 228 1 132 17 1 499 257 110 194 329 2 421. 1 050 670 10 982 574 2 653 6913 274 4 246 91 1 759 1 050 514 518 938 2 355. 1 037 663 9 066 485 2 333 5 933 224 4 589 71 1 540 874 420 481 901 4 331. EU15. 786. 1 229. 12 203. 34 588. 32 947. Development of budget expenditures and resources, 19901996 Expenditures. Resources GNP Resources. 379. Total resources. ■. Sugar contributions. ■ 33. VAT resources. I. Customs dues Agricultural levies. 50. 30 U. ■31 I. Other resources 86. CDC and nonmember. country cooperation. 21 1. Regional fund and transport. 181. EAGGF guidance. 114. Social fund. I 107. Research, energy and industry. 103. Total expenditures. I 77. Other expenditures. 174. EAGGF guarantee. 147. Member State reimbursements 81 Í. Average for 1989, 1990, 1991 for the year 1990. Source : European C ommission GraphAgri Europe 1 9 9 9 ■. 19.
(22) General facts and figures AGRICULTURAL BUDGET. T. dit b r e a k d o w n of the credits d i s t r i b u t e d by EAGGF Guarantee. It reduced guaranteed prices, for arable crops and beef, in favour of direct aid to producers. It introduced accompanying mea sures f r o m 1993 o n w a r d . Between 1 9 9 0 and 1996, the share of compensatory aid packages rose f r o m 45 % to 78 % , whereas the share of refunds dropped by onehalf, sliding from 3 0 % to 15 %. Over the same period, the share of cre dits earmarked for storage went from 2.0 to 3 . 5 %. he four main agricultural producers in the European Union France, Germany, Italy and S p a i n a r e also the major recipients of EAGGF G u a r a n t e e and G u i d a n c e e x p e n d i t u r e s . This situation has r e m a i n e d m o r e or less the same over the past few years. W i t h the e x c e p t i o n of Italy, the Netherlands and Ireland, all the coun tries in the Union have benefited from an increase in the sums allocated by EAGGF Guarantee bet w e e n 1990 and 1996. In 1997, the European Union disbursed 41.8 bil lion ecus to support agriculture, w i t h 43 % ear marked for arable crops, 1 4 % for beef and 9 % for dairy products. Assistance for arable land has more than d o u b l e d since 1990. Assistance for beef rose between 1996 and 1997 as a result of credits in the wake of the BSE crisis. Support for dairy products has been d r o p p i n g since 1993. In 1996, these three items represented twothirds of expenditures, as opposed to onehalf at the beginning of the 1980s. The 1992 Reform of the C o m m o n Agricultural Policy brought farreaching changes to the cre. Definitions European Agricultural Guidance and Guarantee Fund (EAGGF) : funding agency for the C ommon Agricultural Policy [C AP], which implements the CAP's main principles: community preference and financial cooperation. It is made up of a «guarantee» section funding various operations to do with the agricultural market, and a «guidance» section fun ding agricultural structural improvement. Ecu : an abbreviation of European currency unit, the ecu is the linchpin of the European monetary system and is defined by a basket of Member state currencies.. Development of EAGGF Guarantee and Guidance expenditures EAGGF expenditures, guarantee section 1985. 1 995. 1990. 1996. EAGGF expenditures, guidance section 1 985. 1990. 1995. 23 17 204 270 302 384 125 283 5 11. 1996. million ecus Belgium Denmark Germany Greece Spain France Ireland Italy Luxembourg Netherlands Austria Portugal Finland Sweden United Kingdom Community' EU2. 917 829 626 193 /// 638 169 413 5 048. 874 114 355 950 121 142 668 150 5 2 869. ///. ///. ///. 214. /// ///. /// ///. 1 901 6. 1 976 16. 622 389 380 439 562 377 418 364 14 1 930 86 706 62 75 2 954 125. 19 707. 26 528. 34 5 0 3. 3 1 4 1 3 2. 1 4 1 2 5 1 4. 1 1 5 2 4 8 1 3. 1 1 6 2 4 9 1 4. 146 356 048 817 047 558 700 220 20 1 535 1 212 645 648 622 3 468. 161 82 236 1 20. . . . 40 17 808 464 710 348 157 454 6 13 98 283 110 25 74 4. 898. 1 968. 3 609. 39 0423. 20 26 91 138. ///. /// /// /// /// 124. III 242. III III 103. 43 29 804 328 692 521 260 419 4 27 123 378 102 65 116. 3 9113. 1. Direct payments to operators, made by the Commission for the EAGGF, «guarantee» sectionand «multiStatet expendi tures for the EAGGF, guidance section. 2. Ten member states in 1985, 12 in 1990 and 15 with the extension of Germany in 1995. 3. Apart from payments made directly by the C ommission. Source : European C ommission. 20. ■ GraphAgri Europe 1 999.
(23) General facts and figures AGRICULTURAL BUDGET. 42 % of EAGGF guarantee credits for arable crops Distribution of EAGGF Guarantee credits by sector in 1 9 9 7 ' Textile plants 863. |—. Other products 1 698 Total 41 805. Others 152. Wine 928 Tobacco 1 051. million ecus. Fruit and vegetables Sugar Accompanying measuresc 2 Mutton and goat's meat Olive oil Dairy products. /. Forecast. 2. Measurements intended for producers making efforts to protect the environment, maintain natural areas, enhance forest resources and handing over their farms to take early retirement. Source : Commission européenne - Direction générale de l'Agriculture. Development of breakdown of EAGGF guarantee credits by sector and type 19961. 1990. 1985. PriceTotal Refunds sup port. including. including. including Stocks. Total Refundsj. Pricesup Stocks port. Price Total Refunds sup port. Stocks. million ecus Arable crops Beef Dairy prod. Olive oil Sugar Fruit and veg. Mutton and goat meat Tobacco Textile plants Wine Other prod. Accompan. measures Others Total /.. 3 676 2 746 5 933 692 1 805 1 231 502 863 241 921 907. 1 080 1 339 2 028 19 1 353 75. 1 845 197 1 891 668 12 943. 19 643. 502 819 241 214 185. 190. 128. 61. 19 707. 6716. 7 577. 32. 751 1 094 1 973 5 440. -. 7 2 4 1 1 1. 869 833 972 170 391 253. 90 63. 1 452 1 232 580 745 1 438. -. 1 592. 12. 4 428 26 528. 2 501 1 110 1 947 136 929 81. 4 1 1 5 1 253 16 998 368 16 570 694 998 6 744 1 794 4 264 1 209 1 082 3 718 1 703 1 501 1 059 - 2 6 2 113 44 2 059 79 383 1 843 1 344 106 831 2 1 575 97 1 067. 55 902. 1 452 1 081 580 123 418. 207 109. -. 231. 1 361. 62. 89. _. 1 447 1 043 850 805 2 298. 4. _. 50 895. 1 443 1 026 850 160 1 037. 60 686 153 -8 377 1 4 -23. _. 164 16. 1 866 1 866 - 4 7 2 6 299 30 083 1 430. 7 722 11 873 5 458 40 828 6 299 31 949. 1 430. Provisional.. Source : European Commission GraphAgri Europe 1 9 9 9. 21.
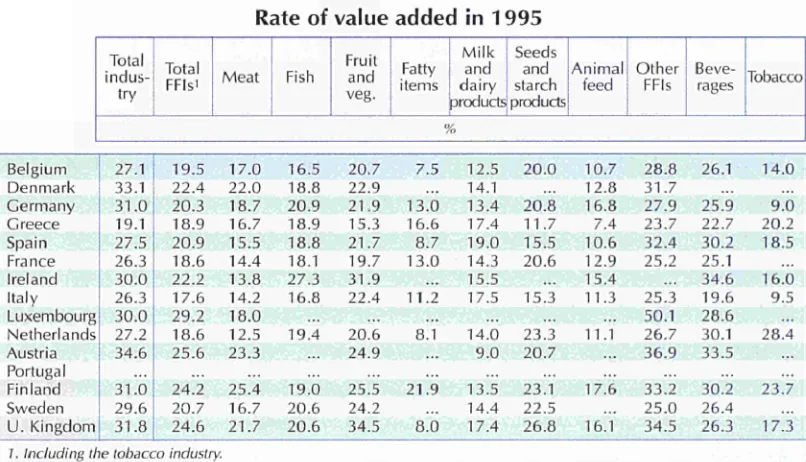
(24) General facts and figures AGRICULTURE IN THE ECONOMY. I. K i n g d o m a c c o u n t for 5 8 % of this trade. Denmark, Greece and the Netherlands carry out much of their trade w i t h nonmember countries.. n 1 996, the share of agriculture, forestry and fisheries represented 1 . 6 % in EU15 a n d 1 . 7 % in the U n i t e d States. W i t h i n the U n i o n , there are marked disparities between countries. These sectors contribute 6 % of the Greek G D P and only 0.5 % of the Swedish GDP. In EU1 5, in 1996, 5 % of the w o r k i n g p o p u l a tion w o r k e d in agriculture, forestry and fisheries as opposed to just 2 . 8 % in the U n i t e d States. This rate is higher than 2 0 % in Greece and only 2 % in the United Kingdom. In the bulk of EU Member States, agricultural pro duction is much greater than forestry production. But the new members are an e x c e p t i o n to this rule. In Finland, forestry is every bit as important as agriculture. It represents more than onethird in Sweden and a quarter in Austria. Imports of foodstuffs, live animals, beverages and tobacco in the European U n i o n represent almost 8 % of total imports, but much more in Portugal, the United Kingdom and Germany. These agri p r o d u c t s represented 7 % of total e x p o r t s of Eu1 5 but m u c h more in D e n m a r k and the Netherlands.. Definitions Gross domestic product (GDP) : in terms of national accounting, this measures the productive activity achieved in the national economy. The GDP corres ponds to the sum of the value of goods and services available for end use in the economic territory and of the balance of total foreign trade. It is also equal to the sum of the added values of the different sectors, plus the VAT levied on products and taxes, free of subsidies, on imports. Agricultural end production : this concept of econo mic accounts for agriculture corresponds to the value of farm goods produced for marketing or self consumption. It represents the sum of deliveries of farm products, variations in farm product stocks at the farm and the gross formation of personal fixed capital in farm products (herds and flocks, planta tions). Value added: in national accounting, the value added denotes the value created by each production unit. The gross value added to the price of goods is measured by the difference between the value of the production of goods and services and the value of intermediate consumption, prior to deduction of amortiza fions.. Since 1990, EU foreign trade in farm and fores try products, and fish and IAA (imports + exports, in value) rose by an average of 4 . 4 % per annum. Germany, France, the Netherlands and the United. Share of value added in agriculture, silviculture and fishing in the GDP in 1996. "A 12 10. 1980 6. 6. CR. IRL. . ft. 1111111 ■ ι.. 11. Ε. Ρ. Source : Eurostat Newcronos. 22. 1996. ■ GraphAgri Europe 1999. 1. NL. DK. F. EU 15. Β. Α. UK. D. L. SF. S.
(25) General facts and figures AGRICULTURE IN THE ECONOMY Main indicators of the farming, forestry and fishing sector in 1996 Gross value added. Share in employment. Final agricultural production. % of G D P '. %'. Belgium Denmark Germany Greece Spain France Ireland Italy Luxembourg Netherlands Austria Portugal Finland Sweden United Kingdom. 1.1 2.5 0.8 6 3.5 2 4.1 2.7 0.8 2.7 1 3.3 0.8 0.5 0.9. 2.7 3.9 2.9 20.3 8.6 4.8 11.2 6.7 2.4 3.8 7.4 12.2 7.9 3.3 2. 6 817 6915 33 3 4 8 8 889 27 523 46 8 9 7 4 404 35 6 9 4 185 17 156 3 637 4 937 2 274 3 484 18 185. EU-15. 1.7. 5.1. 220 346. Share o f f o o d products and live animals, beverages and tobacco in. Final forestry production. Imports. million ecu. Exports %2. 200 180 1 686 106 842 2 751. 9.73 11.8 9. 9.63 22.9 4.8. 11 9.8 7.9. 14.2 13.6 15.3. 430. Tlß. 954 2 292 2 396 420. 18 4.4 6.3 2.8 2.4 6.8. 7.9. 6.6. /. The whole agricultural, forestry and fishing sector 2. Farming and fisheries sector and farming and food industry 3. Belgian-Luxembourg Economic Union. S h a r e o f f o o d p r o d u c t s , live a n i m a l s , b e v e r a g e s a n d t o b a c c o in f o r e i g n t r a d e in 1 9 9 6 Denmark. 12. Netherlands Ireland. 8. Spain France Belgium "7. United Kingdom —. EU-15. 7^. IH KB. a. Portugal Germany Austria Luxemhourg Finland Sweden. Exports Imports. 12 ^ ^ ^ ^ — — |. 5. 9 6. ^. ^. 1. _^^_. llß. 10.7 5.8 11.7 6.3 6.9 9.6. 3 2. Source : Eurostat - Newcronos G r a p h A g r i Europe 1999.
(26) General facts and figures AGRICULTURE IN THE ECONOMY. Greece and the south of the Iberian peninsula. share of agriculture, forestry and fisheries in the gross domestic product at factor cost in 1995 ' (%). 7. 1990 for Austria, 1993 for I reland, 1994 for Germany, Denmark, Greece, France and Luxembourg. Values added at market prices for Denmark, France, Luxembourg, Austria and Portugal.. Source : Eurostat - Newcronos. 24. ■ GraphAgri Europe 1999.
(27) General facts and figures AGRICULTURE I N THE E C O N O M Y. .are still the most agricultural regions. share of agriculture, forestry and fisheries in jobs held by the working population in 1995 (%). Source : Eurostat - Newcronos. GraphAgri Europe 1999 ■. 25.
(28) Land use L A N D DISTRIBUTION. T. he territory of the European Union, covering 3.2 m i l l i o n k m 2 , includes 43 % f a r m l a n d , 3 8 % forest and w o o d l a n d , 1 6 % other forms of land, and 4 % inland waters. The shares of these four main categories vary from one c o u n t r y to the next. The United Kingdom, Denmark, Ireland, Spain, Italy and France have more than half their land area d e d i c a t e d to f a r m i n g . Forest covers. almost two-thirds of Finland and Sweden, and half of Greece and Austria. Inland waters cover a significant area in F i n l a n d , Sweden and the Netherlands. The next five countries to join the EU have b e t w e e n 3 2 % (Estonia) and 6 6 % (Hungary) of their land area given over to farm land. O f these five nations, Slovenia is the most forested.. Land distribution in 1995 Total area km2 Belgium Denmark Germany Greece Spain2 France Irland Italy Luxembourg Netherlands Austria Portugal Finland Sweden U. Kingdom. 30518 43 0 9 4 356 970 131 9 5 7 504 877 549 0 8 7 7 0 285 301 3 2 3 2 568 41 5 2 6 83 8 5 8 91 9 0 5 338 150 449 964 2 4 4 101 3 2 4 0 183. EU-15 Rep. Czech Estonia Hungary Poland Slovenia. 78 45 93 312 20. 866 227 030 685 251. Forest and w o o d l a n d km-i 6 4 107 65 163 168 6 98 3 38 32 230 280 24. 200 171 4101 130' 913 740 061 5701 890 840 770 380 0301 070 7001. 1 230 875 26 20 17 88 10. 300 162 629 218 980. % 20 10 30 49 33 31 9 33 35 9 46 35 68 62 10 38 33 45 19 28 54. Farmland km2 13 27 173 51 301 300 44 167 1 19 34 39 21 30 158. Inland water. %. 661 209 443 629 264 599 071 432 270 808 489 729 606 640 524. 45 63 49 39 60 55 63 56 49 48 41 43 6 7 65. 1 385 375. 43. 42 14 61 186 7. 800 495 793 222 870. 54 32 66 60 39. Other land. %. km-'. %. 269 700 798 119 805 676 391 200 11 420 110 441 550 035 277. 1 2 2 2 1 1 2 2 0 8 1 1 10 9 1. 10 11 68 12 33 73 18 28. 387 015 320 079 895 072 762 121 398 458 489 355 964 219 600. 34 26 19 9 7 13 27 9 16 35 11 21 16 22 24. 113 802. 4. 5 1 0 133. 16. 2 833. 6. 7 737. 17. km-'. 7 3 5 6 1 7 3 1 33 39 3. 14 9 19 52 100 57. 1. Data estima ted for the country concerned. 2. Spanish nat 'onal data explaining certain double counts between used agricultural area (UAA) and woodland. Sources : Eurostat - Working document on forestry statistics (July 1997) for EU - Cestai data base for Central Europe 2b. GraphAgri Europe 1 999.
(29) Land use L A N D DISTRIBUTION. Farmland in the West, forest and woodland in the North. land distribution in 1995 ~| more than 66 % farmland ]] 50 à 66 % farmland less than 50 % farmland and less than 50 % woodland more than 50 % forest and woodland. Source : Euroslat. GraphAgri Europe 1999 ■. 27.
(30) Land use FARMLAND. I. n 1995 farmland occupied 4 3 % of European U n i o n territory , thus c o n t i n u i n g the long term decline. Farmland areas vary from country to country. It covers almost 6 0 % of the territory of the U n i t e d K i n g d o m , Denmark, Ireland and Spain, 5 5 % in France, but only 3 9 % in Greece which boasts extensive forest and woodland, and mountains. In Sweden and Finland, where forests are predominant, farmland represents just 7 % of the territory. In some regions as different as Apulia and Northern Ireland, farmland occupies up to 8 0 % of the territory. This percentage drops to less than 5 % in the northernmost parts of Sweden and Finland. The country hierarchy, based on the share of farmland, does not affect the importance. of different forms of European agriculture, for it takes into account neither the size of the coun try nor the intensity of farming. The make-up of farmland is very varied. These areas are not really anything other than arable land in Finland and Denmark, but are, conver sely, m a i n l y grasslands in I r e l a n d , the U n i t e d Kingdom and Austria. Permanent crops have an i m p o r t a n t position o n l y in the southern states - G r e e c e , Italy, Portugal and S p a i n - w h e r e they represent 1 5 - 2 0 % of farmland. Vines neverthe less occupy major areas in Languedoc-Roussillon, Rhineland-Palatinate, and Provence-Alpes-Côte. d'Azur.. Distribution of farmland area in use in 1995 including Total area. Area of farmland in use. Arable land. Areas always put to grass. Permanent crops. Family gardens. kilometre square Belgium Denmark Germany Greece Spain France Ireland Italy Luxembourg Netherlands Austria Portugal Finland Sweden United Kingdom EU-15. 30 43 356 131 504 549 70 301 2 41 83 91 338 449 244. 518 094 970 957 877 087 285 323 568 526 858 905 150 964 101. 3 2 4 0 183. Republic Czech Estonia Hungary Poland Slovenia. 78 45 93 312 20. 866 227 030 685 251. 13 27 1 73 51 301 300 44 167 1 19 34 39 21 30 158. 661 209 443 629 264 599 071 432 270 808 489 729 606 640 524. 1 3 8 5 375 42 14 61 186 7. 800 495 793 222 870. 8 473 25016 11 8 345 22 8 3 3 144 5 2 5 180 9 3 5 10538 9 0 3001 580 9 146 14 0 2 6 22 8 2 7 21 413 26 4 6 6 59 7 0 0. 4 949 2 120 52 8 2 0 17 8001 109 6 6 2 105 658 33 5131 43 0001 675 10 107 19513 9 035 151 4 130 98 2 5 4. 755 1 2 2. 511 387. 31 11 47 142 2. 430 278 159 856 340. 9 3 11 40 4. 010 069 480 467 950. 2 10 47 11 33. 7. 146 73 088 829 077 830 20 230 14 385 757 588 42 44 410. 94 189 1671. -. 2 176. -. 9021 1 170 193 279. -. 160. 114 5 3 4. 4 331. .... .... 2 252 2 899. 902. .... .... 1. Data estimated. Sources : Eurostat - Working document on forestry statistics (July 1997) for Greece, Ireland and Italy. National data for Spain (INE) clarifying certain double counting between UAA and woodland. Eurostat - Newcronos for the other countries of the Union. Eurostat (Cestai database) and national data for Central Europe.. 28. GraphAgri Europe 1 999.
(31) Land use FARMLAND Two-thirds farmland in the United Kingdom. Sources : Eurostat - Newcronos and Spanish data national G r a p h A g r i Europe 1999 ■. 29.
(32) Land use ARABLE L A N D. A. rable land represented 3 8 % of the utilised agricultural area [UAA] in the Union in 1995. It occupies an important percentage in most of the northern European countries. It represents 9 9 % of the U A A in Finland, 92 % in D e n m a r k and 8 6 % in Sweden. In Germany, Belgium and France, it still represents nearly twothirds of the U A A . Its share is no more than 4 4 % in Greece, 3 8 % in the United Kingdom and 2 4 % in Ireland. The extent of arable land embraces very different situations. Arable land is rare in Finland, being limited to that for w h i c h there is no other use. In Denmark as in Brittany, crops are planted above all to complement intensive livestock farming. In the Paris b a s i n , w h e r e arable land represents almost 8 0 % of the U A A , farming activities are limited almost exclusively to major crops. M a n y countries have considerable regional diversity in the way their land is used. In Germany, arable land represents 93 % of the U A A in Saxony. Anhalt and 3 8 % in RhinelandPalatinate. In Ile deFrance, 9 6 % of farmland is arable, but o n l y 2 5 % in ProvenceAlpesCôte d ' A z u r . In the U n i t e d K i n g d o m , 8 6 % of East A n g l i a n land is arable as opposed to just 1 6 % in Scotland. A m o n g future EU members, Poland is the c o u n try witb the most extensive arable regions, by sur face area. Definitions Utilised agricultural area (UAA) : the total area of arable land, permanent grassland and pasture and land given over to permanent crops and family gar dens. Arable land : this includes areas planted to cereals, oleaginous crops, industrial beet, textile, medicinal and perfumery plants, potatoes, fresh and fielddried and marketgarden vegetables, cultivated flowers, fodder crops, as well as family gardens and fallow.. Distribution of arable land in 1995 Arable land. dont Cereals with rice. Arable land Gr. fertilizers, Industrial fodder fallow plants. Hoed crops. Fresh and dried veg.. thousand of hectare. Belgium Denmark Germany Greece Spain France Ireland Italy Luxembourg Netherlands Austria Portugal Finland Sweden United Kingdom. 847 2 502 11 835 2 283 14 453 18 093 1 054 58 915 1 403 2 283 2 141 2 647 5 970. EU15. 309 454 527 235 693 292 274 4 225 29 198 809 689 978 1 104 3 180 1 6 1 6 8. 290 2 120. . 817 4 442. 22 190 1 282 446 4 373 1 716. 1 268. 164 163 857 396 720. 34 215 141 770 843 10. 529 24. . 430 776 24 1 494. 2 24 124 925 223 337 40. 149 96 86 107. 1 297 80 97 71 93 436. 325. 172 469 188 1 907 30. 97 8 182 330 35. ε. 74 38 97 24. 35 996. Republic Czech Estonia Hungary Poland Slovenia. 3 1 4 14. 143 128 716 286 234. 1 581 308 2 749 8 704 115. 872 494 622 91. Sources : Eurostat Newcronos for EU15, ZMP and national data for C entral Europe.. 30. 26. GraphAgri Europe 1 999. 337 5 560 634 5.
(33) Land use ARABLE LAND Farmland areas are limited to arable land in the Nordic countries. share of arable land in utilised agricultural areal for 1995 (%) ]. less than 40. ]. 40-60. |. 60-80. I. 80 or more. EU-15 : 2 3 %. <?£* 1. Estimate for Italy.. Sources : Eurostat - Newcronos and Spanish national data GraphAgri Europe 1999 ■. 31.
(34) Land use FOREST A N D W O O D L A N D. I. n 1 9 9 5 , the e x p a n s i o n of the U n i o n f r o m twelve to fifteen member countries bolstered the importance of forest and w o o d l a n d . The rate of afforestation in Europe thus rose from 3 3 % to 41 % . But there are sharp variations from zone to zone. The rate rarely reaches 1 5 % in the nor thwest arc e x t e n d i n g f r o m the Loire V a l l e y to D e n m a r k , nor does it in certain southernmost regions of Europe, such as the Algarve, Sicily and A p u l i a . The rate of afforestation, on the other hand, is in excess of 6 0 % in Sweden and Finland, in certain A l p i n e regions and in eastern Greece. Forests account on average for 80 % of w o o d e d land, as opposed to 1 5 % for the Mediterranean maquis and 5 % for the Arctic tundra and ocea nic heath and moorland areas. However, maquis is predominant in nonPyrenean Spain and a part of Greece. Standing timber occupies an average v o l u m e of 1 00 m 3 per hectare in the U n i o n , w i t h a m i n i m u m of 25 m 3 per hectare in Spain and Greece,. and more than 160 m 3 in temperate Europe, well away from the sea. M o r e than 7 0 % of Greek forests are p u b l i c , as they are in Ireland. They are m a i n l y private in the other states. The transition to 15 member states of the U n i o n has further r e i n f o r c e d the i m p o r t a n c e of soft w o o d . Softwood species now represent the main forest stands in nine Union countries. But broad leaf forests are predominant in the regions of sou thern Europe, including in France. Definitions Afforestation rate : share of the total forested/woo ded area in the territory as a whole, in %. Forests : land with a forest cover or an equivalent tree population of more than 10% and an area grea ter than 0.5 hectares. Trees must be able to attain a minimum loggable height of 5 metres.. Forested and wooded areas in 1995 Areas. All w o o d l a n d. Forests. Forest species Other wooded land. EU15 J. 2. 3. 4.. 10 6 16 16 9. 3 3 23 28 2. 620 417 7411 5131 391 874 606 8571 89 384 877 238 0031 007 4701. 123 0 8 7. 620 417 10 7411 3 3591 7 216 15 0 3 4 570 6 8211 89 334 3 877 2 875 2 0 0321 2 4 425 2 4701. %. 98 880. _1 31541 9 175 1 840 36 3036 50 363 2 9711 3 582 24 207. 50 66 68 47 48 36 88 20 34 67 69 40 92 84 70. of wooded Iand4. .... 50 34 32 53 52 64 12 80 61 33 21 60 8 16 29. ■ GraphAgri Europe 1999. Standing timber. %. %. m3/ha. 20 10 30 49 35 31 9 33 35 9 46 35 68 62 10. 57 68 46 15 70 76 27 66 53 52 82 86 68 70 62. 155 146 271 23 31 116 74 109 225 133 266 62 85 105 97. 41. .... 100. Data estimated by the countries in question. Spanish national data explain certain double counts between utilised agricultural area and wooc land, The sum of softwoods and hardwoods is lower than 100 when countries do not includi • mixed fc rests. Inventories carried out in different years, between 1982 and 1995.. Sources : Eurostat Working document on forestry statistics duly 1997). 32. Private share. of S o f t w o o d 3 Hardwood 3 affores tation. thousand hectares Belgium Denmark Germany Greece Spain 2 France Irland Italy Luxembourg Netherland Austria Portugal Finland Sweden United Kingdom. Rate.
(35) Land use FOREST AND WOODLAND. New U n i o n members have more trees. rate of afforestation in 1995 (%) U. less than 17. D. 17-32. I. 32-50. I. 50-82. EU-15 : 4 1 %. *&> Sources': Eurostat - Working document on forestry statistics (July 1997), atid Boletín Mensual de Estadística (junio 97) for the Spanish wooded areas GraphAgri Europe 1999. ■. 33.
(36) Population and employment EMPLOYMENT IN AGRICULTURE, FORESTRY, H U N T I N G A N D FISHING. I. n Europe, as in all industrialised countries, the p r o p o r t i o n of total e m p l o y m e n t w i t h i n the agricultural, forestry, hunting and fishing sec tor continues to d e c l i n e , f r o m 6 % in 1991 for the EU-15 to 5 % in 1996. W i t h i n this EU ave rage, however, the i m p o r t a n c e of agricultural employment in the overall economy at a Member State level remains highly contrasting. In Greece, this sector still accounts for about 20 % of total e m p l o y m e n t in the e c o n o m y as a w h o l e , w i t h the p r o p o r t i o n s in Ireland and Portugal being about 11 % each. In contrast, the figure in France is 5 % , w i t h the lowest proportion of employment within the agricultural sector found in the United Kingdom ( 2 % ) . In most M e m b e r States, employment in forestry, fishing and h u n t i n g is relatively small, agricul ture accounting for 9 0 % of the sector as a whole at the EU-1 5 level. A m o n g the exceptions are forestry e m p l o y m e n t in Sweden and Finland (23 % and 12 % of the total for the sector res pectively) and fishing in Denmark ( 7 % ) . In the majority of M e m b e r States, Austria and Portugal being exceptions, e m p l o y m e n t in this sector is. male d o m i n a t e d particularly in Ireland ( 8 8 % ) , the Netherlands, Sweden, Luxembourg and Spain (all a b o u t 7 4 % respectively). Most w o r k e r s declare themselves to be engaged f u l l - t i m e in their w o r k a n d , more often than not, they are non-salaried workers. They are often non-wageearning workers, particularly in Greece ( 9 6 % of total e m p l o y m e n t ) . But wage-earners are in a majority in Germany and Denmark, where they account for 51 % of jobs. Definitions Field of inquiry : all persons aged 15 and over, living in private households, who have worked for at least one hour in the reference week. Numbers of employees in the fishing and forestry sectors are very low, so the reliability of the figures is uncertain, and they offer no more than a rough idea. Full time: the reply given by working people themselves, except in Austria and the Netherlands, where reference is made to the number of hours ordinarily worked. The full-time parameter varies considerably from one Member State to the next.. Civil jobs in agriculture, forestry, hunting and fishing in 1996 Total numbers. including Men. Salaried employees. Family helpers. Full-time. thousands Belgium Denmark Germany Greece Spain France Ireland Italy Luxembourg Netherlands Austria Portugal Finland Sweden United Kingdom Europe of the 15. 104 102 046 784 065 072 146 332 4 247 269 541 161 130 511. 71 77 650 450 787 722 128 873 3 188 134 274 105 97 375. 14 51 546 35 332 297 28 497 1 95 36 89 31 40 231. 23 9 172 293 165 190 10 164 1 20 78 35 22 13 28. 97 82 896 697 971 894 138 1 179 4 177 218 399 133 96 416. 7 514. 4 934. 2 324. 1 222. 6 397. 1 1 1 1. Source : Eurostat - Labour Force Survey 1996. 54. GraphAgri Europe 1999.
(37) Population and employment EMPLOYMENT IN AGRICULTURE, FORESTRY, HUNTING AND FISHING Scale of forestry and fishing 1 Fishing. Forestry WÊÊÊÊÊÊÊÊÊmÊÊÊ^^mnmm 22,6 12,1. DK. 16,9. IRL. I 6,1 15,6. E 14,4. S F. ■ I 3,1. Ρ. ■ 2,9 ■ 2,8 12,7. I UK CR FIN NI Β D A I /. Share in civil jobs of agriculture, forestry, hunting and fishing in 1996.. Civil jobs in agriculture, forestry, hunting and fishing 1983. 1987. 1991. 1996. 101 149 1 554 807 1 376 1 333 158 1 825 6 279. 143 593. 104 102 1 046 784 1 065 1 072 146 1 332 4 247 269 541 161 130 511. 9 967. 9 021. 6 543. III. III. 7514. thousands. Belgium Denmark Germany' Greece Spain France Ireland Italy Luxembourg Netherlands Austria Portugal Finland Sweden United Kingdom. 115. 177 1 490 1 060. III. 1 790 196 2 466 7 273. III III III III. 587. III III. EU12 EU15 /. ExFKC .in 1 «til.,ml 2. 1986 data.. 109 150 1 242 971 1 723 1 591 170 2 160 5 297. III. 967. III. 1792 583. III. 842. III. 1987.. Source .· Eurostat Labour Force Survey 1996 GraphAgri Europe 1999. 35.
(38) Population and employment TYPES OF LABOUR IN AGRICULTURE. T. he d r o p in the number of farms w e n t hand in glove, between 1990 and 1995, w i t h an especially noticeable reduction in the numbers of regular a g r i c u l t u r a l w o r k e r s in G e r m a n y , Portugal, France and Luxembourg. These n u m bers are h o l d i n g u p m u c h better in the Netherlands and Greece, and are even on the rise in Denmark. In the U n i o n , farmers p r o v i d e almost half the labour, measured in A W U s (annual w o r k units) and f a m i l y help accounts for a further 3 0 % . Wageearners are always in the minority, but they represent more than onethird of the total w o r k force in Denmark and the United Kingdom. They are nevertheless marginal in Finland, accounting for just 3 % of the total w o r k done. M o r e than half the w o r k done by wageearners is provided by permanent labour. But seasonal work predominates in Spain, Italy and, above all, in Greece, where it accounts for 9 0 % of wage earning A W U s .. Definitions Regular agricultural worker : someone who has wor ked every week over the past twelve months prior to the survey. He either belongs to the family labour category (farmer, family help), or does not (perma nent wageearner). The seasonal wageearner works on an irregular basis. Farmer: a person, physically or legally defined, on whose account the farm is worked. In most cases, the farmer is the same as the farm owner, who sees to the daytoday running of the farm. Family help : spouse or other member of the farmer's family, working on the farm. Annual work unit ¡AWUI: amount of agricultural work done by a person employed fulltime over the year. Full-time: the time defined in national work contracts, but at least 1800 hours per annum. This amount varies from country to country. For example, 1800 hours in Ireland, 2200 in France and Greece.. Agricultural workers in 1995 Farmers Persons. AWU. Family helpers Persons. AWU. P. salaried employees Persons. AWU. Seasonal salaried workers. Total AWU. thousands 69.5 Belgium Denmark 68.4 Germany 561.4 773.7 Greece Spain 1 241.4 718.4 France Ireland 152.9 2 470.6 Italy 3.1 Luxembourg 109.8 Netherlands 217.1 Austria Portugal 445.2 100.8 Finland Sweden 83.4 United Kingdom 226.0. 50.8 47.5 312.0 316.1 499.4 485.8 128.5 893.0 2.4 88.3 118.9 238.0 70.0 46.7 143.5. 43.2 34.9 585.7 730.1 1 143.4 618.9 124.9 2 225.0 3.5 103.0 308.6 665.8 192.7 51.6 197.4. 19.4 19.1 222.5 220.9 301.3 314.7 73.1 666.7 2.2 63.8 52.1 250.8 111.6 18.4 105.4. 9.4 37.8 178.1 8.9 158.3 170.1 15.5 77.6 0.6 63.4 21.6 61.8 2.7 29.3 149.4. 7.2 33.9 162.2 7.5 124.2 137.2 10.4 54.4 0.6 49.9 14.1 47.9 1.8 18.4 111.8. 1.3 4.5 14.3 71.6 163.3 77.7 9.9 203.9 0.1 8.0 2.3 46.9 3.2 4.2 19.9. 78.7 105.0 711.0 616.1 1 088.2 1 015.4 221.9 1 818.0 5.3 210.0 187.4 583.6 186.6 87.7 380.6. 7 241.7. 3 441.0. 7 028.6. 2 441.7. 984.4. 784.0. 628.6. 7 295.3. EU15. Source : Eurostat Survey on the structure of agricultural Holdings 1995 36. ■ GraphAgri Europe 1999.
(39) Population and employment TYPES OF LABOUR I N AGRICULTURE Salaried employees provide more than 35 % of farm labour in Denmark Share of salaried AWUs in 1995 1 .¡7. DK 35. UK 28. NL E. ■ 26. S. 26. D. 25. i. 21. Γ. 16. I. 14. I. ■ 13 13. GR li IKI A I IN. 1. AWU of permanent and seasonal salaried employees in all the AWUs. Source : Eurostat Survey on the structure of agricultural Holdings 1995. Regular farm workers 1983. 19891990. 1995. Average annual rate of change l'UUl'WO. Belgium Denmark Germany Greece Spain France Ireland Italy Luxembourg Netherlands Austria Portugal Finland Sweden United Kingdom EU12 EU15. 163.9 185.7 1 783.6 2 079.3 3 179.8 2 405.7 418.9 5 300.8 10.7 304.6. 141.0 139.1 775.9 543.5 838.7 859.0 312.7 287.4 9.3 289.2. 712.9. 659.1. 122.0 141.1 1 325.2 1 512.7 2 540.2 1 507.4 299.3 4 773.2 7.3 276.2 547.3 1 172.8 296.2 164.2 572.9. III III. 16 415.9. 14 250.1. III III III III. 1 1 2 1 5. III. 1 561.0. III III. III. 19901995. %. thousands. 15 257.7. 2.1 4.7 0.1 4.8 1.9 3.6 3.6 ε 2.3 0.7. 1.1. 2.8. III III. 2.3. III III III III. 2.9 0.2 4.8 0.3 1.8 4.1 1.1 2.0 4.0 0.9. III 4.7. III III. III. Source : Eurostal Surveys on the structure of agricultural Holdings G r a p h A g r i Europe 1999. 37.
(40) Population and employment EMPLOYMENT AND AGE IN AGRICULTURE. O. nly 8 % of European farmers, are under 35 years o l d , and 2 8 % are over 65. This elderly structure is particularly marked in the South. One third of farmers in Italy, Portugal, Greece and Spain are over 65 years o l d . Almost onequarter are that same age group in the United Kingdom. Younger farmers tend to be found in the North : less than 1 0 % of farmers are over 65 in Finland, G e r m a n y and Austria. Farmers in B e l g i u m , L u x e m b o u r g and France are also l i k e l y to be younger : m o r e than 1 0 % of their farmers are under 35 years old and less than 2 0 % are over 65. In every c o u n t r y there are sharp regional variations: only 6 % of Spanish farmers are under 35, but more than 9 % in Aragon. Similarly, 1 8 % of G e r m a n farmers are under 3 5 , but this p r o . p o r t i o n is o n l y 7 % in the three cityStates, as opposed to 2 0 % in the new Länder. In all countries the average age of farmers has continued to increase over the past decade or so, to d o both w i t h the d r o p in the p r o p o r t i o n of younger ones and the rise in the number of older ones. Despite relatively younger farmers in the three newest member states, the general EU trend towards older farmers continues. Definition Farmer: a person, physically or legally defined, on whose account the farm is worked. In most cases, the farmer is the same as the farm owner, who sees to the daytoday running of the farm.. Farmers' ages in 1995 Under 35. 3544. 4554. 5564. 65 and over. Overall. thousands. Belgium Denmark Germany Greece Spain France Ireland Italy Luxembourg Netherlands Austria Portugal Finland Sweden United Kingdom. 10.9 6.6 98.2 47.5 76.6 92.3 20.9 110.2 0.4 10.3 39.7 18.5 16.1 7.5 13.7. 14.2 13.6 142.4 111.4 159.1 163.9 30.0 256.4 0.8 21.6 56.6 51.9 27.0 17.1 37.4. 14.8 16.3 126.2 156.6 266.9 177.6 34.5 490.7 0.7 28.6 53.0 88.3 32.6 22.9 59.6. 17.8 16.2 152.8 219.0 367.5 174.4 35.0 701.0 0.6 30.3 46.9 129.5 18.0 17.9 59.2. 11.8 15.7 41.8 239.2 371.3 110.2 32.5 912.3 0.6 19.0 20.9 157.0 7.1 18.0 56.1. 69.5 68.4 561.4 773.7 1 241.4 718.4 152.9 2 470.6 3.1 109.8 217.1 445.2 100.8 83.4 226.0. EU15. 569.4. 1 103.0. 1 569.5. 1 986.3. 2 013.5. 7 241.7. Source : Eurostat Survey on the structure of agricultural Holdings 1995. 38. ■ GraphAgri Europe 1999.
(41) Population and employment EMPLOYMENT A N D AGE I N AGRICULTURE. Germany, Austria and F inland have the youngest farm owners share of farmers under 35 in 1995 (%) ]. D. less than 5. 5-10 |. 10-15. I. 15-21. <?C3>J. Source : Eurostat - Survey on the structure of agricultural Holdings 1995. The farming population is growing older Age of European farmers. thousands of persons 3 500 3 000. 35-54. __. 2 673. 2 500 2 000. 5 5-64. 2 014. —. 1 986 1 500 ^ 6 5 and ove r 1 000 569. under 35 500. 1983. 1985. 1989-1990. 1993. 1995. Source : Eurostat ■ Surveys on the structure of agricultural Holdings G r a p h A g r i Europe 1999. 39.
(42) Population and employment WORK TIME A N D MULTIPLE ACTIVITIES I N AGRICULTURE. O. ne European farmer out of every four works on a f u l l t i m e basis. Most farmers are f u l l time in Benelux and Ireland. In contrast, fulltime farmers are in a marked minority in Greece, Spain and Italy, where land areas are usually small and farmers relatively elderly. More than half of them devote less than a quarter of their time to their farm. Parttime w o r k is also the rule in Portugal, but carried o u t over longer periods of t i m e , a significant proportion being more than halftime. Parttime work is not always combined with ano ther job. Farmers with another gainful activity are relatively c o m m o n in Sweden (53 % of all far mers), in Finland ( 5 0 % ) and G e r m a n y ( 4 4 % ) . However, this activity is often carried on a secon dary basis. In Italy, Greece and Spain, only one quarter of farmers have an additional activity that has nothing to do w i t h farming, but it is almost always the main activity.. Definitions Farmer: a person, physically or legally defined, on whose account the farm is worked. In most cases, the farmer is the same as the farm owner, who sees to the daytoday running of the farm. Full-time : the time defined in national work contracts, but at least 1800 hours per annum. This amount varies from country to country. For example, 1800 hours in Ireland, 2200 in France and Greece. Other gainful activity: a nonagricultural activity carried on on a remunerative basis, or for a wage, fee or other income, including payment in kind. The farmer himself declares whether he regards this acti vity as principal or secondary, without reference to any concept of time or income. Normally speaking, the other gainful activity carried on as a main job takes up more time than the work involved by farm labour.. Farmers' activities in 1995 Full time. Part time Total. ¡including less including 1/4 Ithan 1/4 time to 1/2 time. with another gainful activity. Overall. thousands. Belgium Denmark Germany Greece Spain France Ireland Italy Luxembourg Netherlands Austria Portugal Finland Sweden United Kingdom EU15. 41.7 33.8 216.7 95.5 259.2 354.2 103.8 345.8 1.7 69.1 60.3 80.0 50.0 26.8 105.9. 27.8 34.6 344.7 678.2 982.2 364.2 49.1 2 124.8 1.4 40.7 156.8 365.2 50.8 56.6 120.1. 14.0 11.3 182.5 345.2 574.4 171.2 10.3 1 444.4 0.2 10.7 67.3 129.0 22.0 27.0 57.9. 7.6 10.5 115.6 167.2 148.4 87.5 14.0 381.2 0.4 10.3 35.1 96.2 11.4 14.3 23.8. 10.4 21.5 247.0 196.0 294.2 176.8 50.0 608.4 0.5 25.1 80.7 143.1 50.4 44.1 56.0. 69.5 68.4 561.4 773.7 1 241.4 718.4 152.9 2 470.6 3.1 109.8 217.1 445.2 100.8 83.4 226.0. 1 844.5. 5 397.2. 3 067.4. 1 123.6. 2 004.2. 7 241.7. Source : Eurostat Survey on the structure of agricultural Holdings 1995. 40. ■ GraphAgri Europe 1999.
(43) Population and employment WORK TIME A N D MULTIPLE ACTIVITIES I N AGRICULTURE Full-time farm work is the rule in Benelux and Ireland. 38 % of German farmers have a main activity outside of farming. Source : Euroslat - Surxey on the structure of agricultural Holdings 1995 GraphAgri Europe 1999 ■. 41.
(44) Population and employment EMPLOYMENT IN THE FARMING AND FOOD INDUSTRIES. I. n the Union, salaried workers in the food pro cessing industry, i n c l u d i n g tobacco, repre sent on average 1 1 . 5 % of manufacturing employ ment. This p r o p o r t i o n varies amongst M e m b e r States f r o m 1 0 % to 2 0 % . A t o n e extreme are Ireland and Greece w h e r e 2 2 % and 21 % res pectively of total employment in manufacturing are in the f a r m i n g and f o o d industries. At the other extreme are Sweden, Germany and Italy, where it only represents 8 - 1 0 % of m a n u f a c t u ring jobs. Taken as a w h o l e , sectors as different as indus trial baking, the sugar industry, chocolate, and c o n f e c t i o n e r y , all grouped together under the. heading « other food processing industries » form the number one food industry employer in most of the EU countries. They are ahead of the meat sector and the beverages sector, made up, among other things, of alcoholic drinks, brewing, w i n e m a k i n g , mineral water and sodas. In Denmark and France, however, the meat industry is the number one food industry employer. Nevertheless, food industry employment has been d r o p p i n g in the Fifteen since 1 9 9 0 , but less r a p i d l y than m a n u f a c t u r i n g e m p l o y m e n t . The FPIs are in fact always in need of plenty of labour, despite the d e v e l o p m e n t of certain p r o d u c t i o n processes.. Distribution of salaried jobs in the food processing industry by sector in 1995 Total indus try. Total FPI2. Meat. Fish. Ma. Fruit Fatty Milk and Sf**!s subs and vegetab tances. Animal Other feed FPIs-. Beve- Tobacco rages. thousands Belgium Denmark Germany Greece Spain France Ireland Italy Luxembourg Netherlands Austria Portugal Finlande Sweden U. Kingdom. 647 354 6 816 219 2 074 3190 220 2 780 34. 91.6 67.0 559.4 48.2 344.6 361.5 46.9 219.4 3.8. 14.9 22.3 103.7 3.9 55.4 110.0 12.7 36.3 0.4. 534. 60.0. 11.8. 386 599 3 571. 45.3 58.3 485.5. 10.9 16.2 109.9. /. Companies with 20 employees or more 2. including t he tobacco industry. Source : Eurostal - Newcronos. 42. GraphAgri Europe 1999. 1.3 6.7 11.9 0.9 17.6 10.9 2.7 4.7. 5.4 1.5 25.3 8.0 30.3 20.6 1.6 20.4. 1.9 10.8 1.6 10.9 4.0 3.5. 2.9 0.5 1.5 19.5. 1.9 3.7 42.6. 0.8 2.8. 7.1 10.2 50.7 6.7 25.8 59.0 10.5 38.8. 10.2 1.8 7.7 10.9. 6.4. 1.3. 6.6 9.4 38.9. 1.0 0.9 12.2. 2.4. 5.9. 4.4 1.4 11.8 1.0 11.6 16.1 1.8 7.5. 1.5 17.7. 40.3 16.1 235.2 13.4 129.4 90.9. 11.2. 2.8 14.7 2.9 9.3. 61.4 1.9. 85.0 7.9 46.6 39.2 4.9 26.2 1.0. 23.1. 10.4. 17.2 17.2 180.3. 4.1 6.6 53.5. 1.0 14.8. 0.9 8.1.
(45) Population and employment EMPLOYMENT IN THE FARMING A N D F O O D INDUSTRIES Food processing jobs are a major item in Greece and Ireland S h a r e o f FPIs in m a n u f a c t u r i n g s a l a r i e d e m p l o y m e n t i n 1 9 9 5. % CR IRL DK E Β UK Ρ FIN L. I l 1,5 Il1,4. EU 15 F. |11,3. A. In,3. S D. ■^^■a.2. I. Í. Including the tobacco industry 2. Companies with 20 employees or more Source : Eurostat Newcronos. Development of employment 1 in the FPIs2 1986. 1990. 1994. 1993. 19953. 19963. thousands Belgium Denmark Germany Greece Spain France Ireland Italy Luxembourg Netherlands Austria Portugal Finland Sweden U n i t e d Kingdom. 65.9 72.3 544.2 48.9 362.7 374.0 49.1 243.2. 67.9 65.7 593.3 49.8 384.4 364.1 45.1 241.0. 109.6 66.2 118.1 57.7. Europe of the 15. 63.1 65.7 574.4 49.3 378.3 362.8 46.7 226.9. 68.2 68.5 561.1 48.7 374.4 359.6 47.9 221.2. 538.2. 122.5 64.4 124.1 53.9 66.2 552.6. 64.5 66.4 588.5 48.9 379.5 360.8 46.2 233.4 2.8 124.2 62.4 111.3 43.9 60.1 521.4. 121.6 61.0 117.7 41.6 58.1 508.0. 116.5 57.9 107.4 40.6 57.9 513.9. 57.4 506.3. 2 722.1. 2 802.6. 2 718.3. 2 678.3. 2 647.4. 2 632.0. 69.9 554.6 388.0 357.3 49.1 215.1 113.2 57.0 102.3. /. Salaried and nonsalar ied employees. For methodological reasons. the figures cannot 6e compared with those on the previous page. 2. Includes tobacco 3. Data estimated. Source : Eurostat Yvarlxiok 1997 GraphAgri Europe 1999. 4 !.
(46) Enterprises FARMS. I. n 1995, the European Union had 7.3 million farms. O f these, 8 0 % w e r e located in just five countries : 3 4 % in Italy, 1 7 % in Spain, 1 0 % in G r e e c e and France, and 8 % in G e r m a n y . A l t h o u g h the other ten M e m b e r States a c c o u n ted for a relatively low number of farms, this does not affect the importance of what they produce. The drop in the number of farms has been wides pread in all EU countries. But it is less rapid in some countries than in others, and changed in pace over time. For most of the Member States, this pace gathered speed in the 1980s. Between 1 980 and 1 995, the number of farms decreased p a r t i c u l a r l y fast in D e n m a r k , France, and Portugal, w i t h a loss of m o r e than 4 0 % . Conversely, the d e c l i n e was relatively slight in. the U n i t e d K i n g d o m , and in Italy, even though their agricultural structures are very different : for the former, large farms, for the latter, lots of very small units. Definition Farm : a technical and economic unit with single management, producing agricultural products. To be so defined, a farm must have a sufficiently large phy sical and economic dimension: one hectare of far ming land in use, or, failing this, a minimum produc tion for sale. However, discrepancies emerge between Member States, regarding the application of the area threshold and the interpretation of a physi cal and economic minimum. For example, ten ares for Greece, and five hectares for Denmark.. Number of farms 19701971. 1975. |. 19791980. 1985. 19891990. 1995. thousands Belgium Denmark Germany Greece Spain France Ireland Italy Luxembourg Netherlands Austria Portugal Finland Sweden United Kingdom EU12 EU15. 184.0 146.0 1 074.6 1 046.3. 138.1 132.3 907.9. 115.1 122.7 849.9 998.9. 85.0 81.3 653.6 850.1 1 593.6 923.6 170.6 2 664.6 4.0 124.8. 326.7. 280.6. 268.6. 258.5. 243.1. 71.0 68.8 566.9 773.8 1 277.6 734.8 153.4 2 482.1 3.2 113.2 221.8 450.6 101.0 88.8 234.6. ... .... ... .... ... .... ... .... 7 992.9. 6 930.0. .... 7 341.5. .... 1 587.6. ... 2 849.9 7.6 184.6. 1 315.1 228.0 2 664.2 6.2 162.6. .... 1 255.3 223.5 2832.4' 5.2 148.7. Source : Eurostat Surveys on the structure of agricultural Holdings. ■ GraphAgri Europe 1999. 1 056.9 220.2 2 801.1 4.4 135.9. 769.4. 1. 1982 data.. 44. 97.8 92.4 740.5 951.6. 598.7.
(47) Enterprises FARMS. The number of farms is declining throughout the European U n i o n Farms thousands |. 1. ■. E. 1 278. _ _ g _ _ _ _ g g g g | 999 CR. I 774. F™^. F. D. ■ ■ ■ ■I 567■. Ρ. ■ ■ ■ ■ ■ ■ ■ ■ ■ 4SI. UK. ■ ■ ■. 1995. 71,'). 222. ■ H 224 ■ H 153. NL. ■ i 149 ■ 113. H. ,n. '. 89. S Β. 1 255. 19791980. 269. IRL. FIN. |. ■ ■. F235. ■ M. A. 2 832. 1 2 482. ■ ■ 71. DK. ■ 1 123 Γ 69. L |5 3. Source : Eurostat ■ Suneys on the structure of agricultural Holdings. GraphAgri Europe 1999 ■. 45.
(48) Enterprises AVERAGE SIZE OF FARMS. I. n 1995, the average size of farm ranged from 70 hectares in the U n i t e d K i n g d o m to less than five hectares in Greece. Average sizes also tended to be larger (above 40 ha) in D e n m a r k , France and L u x e m b o u r g . The smallest, of less than 10 hectares, are in Portugal, Italy and Greece. In some c o u n t r i e s , regional contrasts are very m a r k e d . For exemples in Portugal the average area varies from 0.4 hectares in Madeira, to 50 hectares in the Alentejo, in southern Portugal. In Germany, the difference ranges from 16 hectares in B a d e n W ü r t e m b e r g to 2 7 0 hectares in Mecklenburg. In all countries, average farm areas have increa sed to differing degrees and at different rates of change. In eight years, the average area of Spanish farms has risen by more than 4 0 % , with the r a p i d disappearance of m a n y small units. G r o w t h has been ¡ust as marked in France and. Portugal, even if threequarters of Portuguese units have less than five hectares. Conversely, the average rate of increase in area is still l o w in Greece, Italy and the United Kingdom, although the small structures in the first t w o c o u n t r i e s contrast with the very large structures of the third. These different rates of development mean that discrepancies exist between Member States, even if they are b e c o m i n g less p r o n o u n c e d . At the extremes the size of farms in Epirus, Liguria and C a m p a n i a is still under 3 hectares, whereas it exceeds 100 hectares in Scotland and in the new German Länder. Definition Utilised agricultural area (UAA) : all the area of arable land, permanent meadow and pasture, and land devo ted to permanent crops and kitchen gardens.. Average farmland area on farms 19701971. 1975. 1979-1980. 1485. 1989-1990. 1995. hectares Belgium Denmark ExFRG Germany Greece Spain France Ireland Italy Luxembourg Netherlands Austria Portugal Finland Sweden U n i t e d Kingdom. 8.4 20.3 11.8. 10.6 22.4 13.7. III. III. 3.4 18.9 6.0 17.8 11.6. 22.4 22.3 6.2 21.9 12.8. 12.3 23.8 14.4. 58.7. .... 23.3 22.6 5.6 25.2 13.7. 63.7. .... Source : Eurostat Surveys on the structure of agricultural Holdings ■ GraphAgri Europe 1999. 15.0. 17.2. III 4.3 13.8' 27.0 22.7 5.6 28.6 14.9. /. I9H7 data.. 46. 67.9. 13.31. III. EU12 EU15. 65.1. 18.8 39.6 21.7 30.3 4.5 19.7 38.5 28.2 5.9 39.7 17.7 15.4 8.7 21.7 34.4 70.1. 3.6. 4.3. 54.2. 14.1 30.7 16.0. 5.21. 15.8 34.2 18.6 26.1 4.3 15.4 30.5 26.0 5.6 32.1 16.1 6.7. 17.5.
(49) Enterprises AVERAGE SIZE OF FARMS. More than 100 hectares on average in Scotland and the new German Länder. Source : Eurostat Sunvy on the structure of agricultural Holdings 1995. GraphAgri Europe 1999. ■. 47.
(50) Enterprises DISTRIBUTION OF FARMS BY SIZE ost farms in the EU are small, less than five hectares, but huge differences exist a m o n g the Member States. In Greece, Italy and Portugal, more than three farms out of every four have less than five hectares. In Ireland and Finland, farms are medium-sized: more than a third have 20-50 hectares. In L u x e m b o u r g and the U n i t e d Kingdom, they are larger and in t w o cases out of three, cover m o r e than 50 hectares. France, Denmark and Sweden tend towards larger sizes, w i t h almost a quarter of their farms larger than 50 hectares. The a g r i c u l t u r a l structures o f Denmark and France are not, however, identi cal. Small farms, often growing specialized crops, are still plentiful in Greece, Portugal, Spain, Italy and France. O n l y 3 % of European farms have at least 100. hectares, but 1 0 % of these are in France and 1 7 % in the United Kingdom. There are also noti ceable regional differences within the same coun try. Thus, in France, 2 % of farms in Brittany have more than 100 hectares, as opposed to 3 8 % in the lle-de-France. In Spain, such farms represent 0 . 2 % in the Canaries and 9 % in Castile-Leon. In G e r m a n y , 1 % of farmers in B a d e n Wurtemberg farm at least 100 hectares, as oppo sed to 3 9 % in Mecklenburg. Definition Utilised agricultural area (UAA) : all the area of arable land, permanent meadow and pasture, and land devoted to permanent crops and kitchen gardens.. Distribution of farms by utilised area in 1995 Utilised agricultural area in hectares Under 5. 5 à 10. 10 à 20 I 20 à 30. 3 0 à 50. 5 0 à 100 100 or more. Total. thousand farms Belgium Denmark Germany Greece Spain France Ireland Italy Luxembourg Netherlands Austria Portugal Sweden United Kingdom. 23.7 2.1 179.2 580.9 706.4 200.9 14.8 1 938.3 0.8 37.4 87.3 345.6 10.6 11.0 32.3. 10.2 11.4 84.0 116.2 211.6 69.6 20.5 258.1 0.3 18.1 41.7 51.9 17.9 15.5 29.5. 12.7 14.9 100.0 52.4 147.2 88.6 40.6 140.2 0.3 20.8 49.0 28.3 30.3 19.0 36.1. 9.0 10.4 64.0 13.1 60.5 68.3 29.1 58.8 0.2 15.0 21.5 8.6 19.1 11.4 23.8. 9.4 12.9 68.3 8.1 54.7 109.0 28.1 46.5 0.5 14.8 14.2 6.5 16.2 13.3 32.7. 5.0 12.1 51.6 2.6 51.7 128.2 16.1 26.9 1.0 6.2 5.2 4.4 6.0 13.0 40.9. 0.8 5.0 19.9 0.7 45.4 70.3 4.1 13.4 0.2 0.9 2.8 5.4 0.8 5.6 39.3. 71.0 68.8 566.9 773.8 1 277.6 734.8 153.4 2 482.1 3.2 113.2 221.8 450.6 101.0 88.8 234.6. EU-15. 4 171.3. 956.5. 780.3. 412.7. 435.1. 370.8. 214.7. 7 341.5. Finland. Source : Eurostat - Survey on the structure of agricultural Holdings 1995. 48. GraphAgri Europe 1999.
(51) Enterprises DISTRIBUTION OF F ARMS BY SIZE. Farms with more than 100 hectares are rare in the south and the far north. percentage of farms with more than 100 ha in 1995. Qo-i. 5 - 10 10 or more. EU-15 : 2 . 9 %. ^ Source : Eurostat - Sur\rey on the structure of agricultural Holdings 1995. GraphAgri Europe 1999 ■. 49.
(52) Enterprises E C O N O M I C SCALE OF FARMS. ore than one third of EU farms are very small, in e c o n o m i c terms, w i t h less than three wheatequivalent hectares. This mean figure com prises very marked differences between Member States. Very small farms tend to be in the South. They account for 5 3 % of all farms in Italy, 4 8 % in Portugal, 41 % in Spain and 3 4 % in Greece. At the other end of the scale, 2 7 % of D u t c h farms, 15 % of Danish farms and 11 % of British farms are on an e c o n o m i c scale that is at least the equivalent of 150 wheatequivalent hectares. French farms occupy an inbetween position with both small and large farms.. Definitions European size unit (ESU) : the economic scale of farms is expressed in european size unit (ESU), and defined on the basis of the farm's total standard gross profit. Standard gross margin (SGM): appreciation and development of the different productions of the farm based on standard coefficients. This may be expres sed in wheatequivalent hectares, i.e. in the number of hectares yielding the same gross margin. One ESU roughly tallies with 1.5 wheatequivalent hectares.. Number of farms in 1995 based on economic size in ESU Less than 2. 2 to 4. 4 to 8. 8 to 16. 1 6 to 40. 4 0 to 100. 100 or more. Total. thousand farms Belgium Denmark Germany Greece Spain France Ireland Italy Luxembourg Netherlands Austria Portugal Finland Sweden United Kingdom. 7.5 0.3 117.6 262.8 520.0 137.1 23.7 1 302.4 0.4 0.2 61.9 215.1 15.1 16.6 44.0. 5.6 4.2 68.2 157.2 234.1 63.6 23.6 398.7 0.3 1.9 31.9 111.1 14.1 14.0 21.9. 7.1 11.0 68.3 171.3 204.7 66.4 30.5 321.5 0.3 11.0 37.1 64.9 16.5 13.9 28.0. 7.8 12.0 74.6 124.2 161.1 89.7 28.4 222.9 0.3 13.7 41.1 32.6 22.1 12.1 28.6. 14.9 14.6 124.8 51.8 114.3 188.1 31.1 153.6 0.7 19.7 41.1 19.0 26.6 15.8 40.9. 21.1 16.6 92.2 5.9 34.0 149.0 14.2 62.3 1.0 36.1 8.3 6.1 5.5 13.4 44.2. 7.0 10.1 21.2 0.6 9.4 40.7 1.9 20.7 0.1 30.6 0.4 1.9 1.0 3.1 26.8. 71.0 68.8 566.9 773.8 1 277.6 734.8 153.4 2 482.1 3.2 113.2 221.8 450.6 101.0 88.8 234.6. EU15. 2 724.6. 1 150.5. 1 052.5. 871.3. 857.1. 510.1. 175.3. 7 341.5. Source : Eurostat Survey on the structure of agricultural Holdings 1995. 50. ■ GraphAgri Europe 1999.
(53) Enterprises E C O N O M I C SCALE OF F ARMS. Farms w i t h more than 40 ESU are most c o m m o n in the Benelux. percentage of farms of more than 40 E5U in 1995 ]. less than 10. ]. 10-20. |. 20-40. I. 40 or more. EU-15 : 9 , 3 %. ^ ^ J Source : Eurostat - Survey on the structure of agricultural Holdings 1995. GraphAgri Europe 1999 ■. 51.
(54) Enterprises FARMING TENURE. T. he farmland used by EU farms exceeded 128 m i l l i o n hectares in 1995. Of this total, 8 0 % lies in just five countries: 2 2 % in France, 2 0 % in Spain, 1 3 % in G e r m a n y and the U n i t e d Kingdom, and 11 % in Italy. The average size of U n i o n farms ranges from less than 5 hectares in Greece to 70 hectares in the United K i n g d o m . The type of farm tenure in the EU also varies but countries where the rent of farmland is the most frequent are not always those w h i c h have large average areas. For example, only 3 5 % of c u l t i vated land in Great Britain is tenantfarmed, as opposed to 6 7 % in Belgium. The average Belgian farm nevertheless has an area about four times smaller than its British counterpart. O n the w h o l e tenant farming is less prevalent in southern Europe, hallmarked by small structures. It is in Austria and I r e l a n d , however, that it is rarest, affecting less than 2 0 % of farms.. Since 1985, the proportion of land used for tenant farming has risen in most countries, in correla t i o n to the g r o w t h of average farm size (ha). It has risen by a factor of three in Ireland and in Germany rose substantially upon reunification. O n the other h a n d , in B e l g i u m , the U n i t e d Kingdom and above all in the Netherlands, the proportion of land being tenant farmed declined between 1985 and 1995. Definitions Utilised agricultural area (UAA) : all the area of arable land, permanent meadow and pasture, land devoted to permanent crops and kitchen gardens. Area used for tenant farming: land rented out by the farmer, for at least twelve months, for a fixed rent agreed in advance by way of a written or verbal contract.. Spread of tenant farming w i t h the enlargement of farms. Farmland used for tenant farming percentage of farmland 67 63. wmmA7 45. |. 1985 1995. Sources : Eurostat Surveys on the structure of agricultural Holdings. 52. ■ GraphAgri Europe 1999. 61 52. 69.
Figure


Related documents
Extractable protein per ha significantly increased in lucerne and grass species with increasing maturity and was by far the highest in red clover (ranging between 514 and 726 kg ha −1
pursuant to an international agreement concluded to conformity with the Treaty between a Member State and one or more third countries and covering supplies, works, services or
MIMO antennas using characteristcs modes,” IEEE Antenna Wireless Propag.. Chapter 2: MIMO
Mr otto SCHLECHT state Secretary, Federal Mrnrstry of Economrc Affarrs.. Greece
MiRNAs are small non-coding RNAs with cell-type specific expression patterns that are released by cells into the circulation as part of membranous particles or protein complexes.1
Figure 3 Mass gain per unit area of scale after 2h immersion in calcium carbonate (CaCO3) scaling brine; error bars represent standard errors. The highest deposition of
- UK: Verkäufe von Firnen nit 25 Beschäftigten oder nehr - E: zun Teil einschließlich Position 4553 und 4561 * - Definition der Oberhenden: siehe Position 4553. - E: in Position
for new SSTT-confined HSC columns so that the technique can be widely used in practice. This paper proposes a design approach for slender HSC circular columns confined using the
