Advance Access publication 2018 February 23
The extremely truncated circumstellar disc of V410 X-ray 1: a precursor
to TRAPPIST-1?
D. M. Boneberg,
1‹S. Facchini,
2C. J. Clarke,
1J. D. Ilee,
1R. A. Booth
1and S. Bruderer
21Institute of Astronomy, University of Cambridge, Madingley Road, Cambridge CB3 0HA, UK
2Max-Planck-Institut f¨ur Extraterrestrische Physik, Giessenbachstrasse 1, D-85748 Garching, Germany
Accepted 2018 February 13. Received 2018 February 6; in original form 2017 December 4
A B S T R A C T
Protoplanetary discs around brown dwarfs and very low mass (VLM) stars offer some of the best prospects for forming Earth-sized planets in their habitable zones. To this end, we study the nature of the disc around the VLM star V410 X-ray 1, whose spectral energy distribution (SED) is indicative of an optically thick and very truncated dust disc, with our modelling suggesting an outer radius of only 0.6 au. We investigate two scenarios that could lead to such a truncation, and find that the observed SED is compatible with both. The first scenario involves the truncation of both the dust and gas in the disc, perhaps due to a previous dynamical interaction or the presence of an undetected companion. The second scenario involves the fact that a radial location of 0.6 au is close to the expected location of the H2O snowline in the disc. As such, a combination of efficient dust growth, radial migration, and subsequent fragmentation within the snowline leads to an optically thick inner dust disc and larger, optically thin outer dust disc. We find that a firm measurement of the CO J=2–1 line flux would enable us to distinguish between these two scenarios, by enabling a measurement of the radial extent of gas in the disc. Many models we consider contain at least several Earth-masses of dust interior to 0.6 au, suggesting that V410 X-ray 1 could be a precursor to a system with tightly packed inner planets, such as TRAPPIST-1.
Key words: techniques: interferometric – protoplanetary discs – brown dwarfs – circumstellar matter – stars: pre-main sequence.
1 I N T R O D U C T I O N
A number of theories have been proposed for the formation chan-nel of brown dwarfs (BDs) and very low mass (VLM) stars (see e.g. Whitworth et al.2007). These objects are distinguished accord-ing to their mass, where a BD falls below the hydrogen-burnaccord-ing mass limit of∼0.08 M(Oppenheimer, Kulkarni & Stauffer2000) and a VLM object would lie above this mass boundary. The for-mation scenarios of these objects can be broadly divided into two categories. Firstly, BD formation may be a scaled-down version of ordinary (solar mass range) star formation, involving the collapse of an essentially isolated low-mass gas core. Secondly, a range of other scenarios exist in which the BD properties are impacted by their formation environment. The latter includes dynamical influ-ences, such as the ejection of stellar embryos from systems with a small number of stars (Reipurth & Clarke2001) and the possibility
E-mail:boneberg@ast.cam.ac.uk
of BD formation and subsequent ejection from the outer regions of massive circumstellar discs (Stamatellos & Whitworth2009).
Perhaps the most important observational discriminant is the radii of discs around BD and VLM stellar objects. Ejections resulting from dynamical encounters are expected to truncate circumstellar discs at a radius of around a third of the distance of closest approach (e.g. Hall, Clarke & Pringle1996; Breslau et al.2014; Winter et al.
2018). Massive objects tend to remain within their natal gas reser-voirs after encounters and can thus re-accrete disc material. Ejected objects (which are preferentially low mass) however bear the imprint of their last dynamical encounter in the form of a truncated disc. Given the stochastic nature of dynamical interactions, the range of closest approaches for BDs in dynamical simulations is very large (around three orders of magnitude); moreover, in the simulations of Bate (2009) around a half of all BDs have suffered encounters on a scale of a few au. It is thus a prediction of dynamical star formation scenarios that BD or VLM stars should have a much larger range of disc radii than higher mass stars, and that some population of extremely compact discs is to be expected. Companions can also leave an imprint on the disc size. It is expected that for a binary
2018 The Author(s)
system the disc radius will be truncated at about 20–50 per cent of the semimajor axis of the binary (Artymowicz & Lubow1994).
There is increasing interest in the planet formation potential of discs in the BD and VLM star regime. This is partly because of the growing realization that lower mass host stars provide the best prospects for the detection of Earth-like planets in the habitable zone. Recent results have borne out this expectation, in particular the discovery of seven terrestrial planets within 0.06 au around the 0.08 Mstar TRAPPIST-1 (Gillon et al.2017). Such systems imply an extraordinary concentration of solid material at small orbital radii and raise a number of unanswered questions about the evolutionary scenario that produced them. In particular, it is of obvious interest to ask what would be the distribution of dust and gas in such a system at an age of a few million years?
To date, a number of studies have identified and characterized the population of young BDs and VLM objects which have large discs (>70 au; Ricci et al.2013,2014). The large discs have been imaged with the Atacama Large Millimeter/submillimeter Array (ALMA) and the Combined Array for Research in Millimeter-wave Astron-omy (CARMA), and have broad-band SEDs which are consistent with extended circumstellar discs (Alves de Oliveira et al.2013). Additionally, their infrared colours in the 2–12 and 12–70µm range lie in the domain of Classical T Tauri stars (Rodgers-Lee et al.2014). van der Plas et al. (2016) surveyed eight BD discs in Upper Scor-pius and Ophiuchus with ALMA, which, being unresolved in these observations, limits the discs to beingR 40 au. Recently, Testi et al. (2016) discovered discs around BDs in theρOph star-forming region with ALMA that have sharp outer edges at radii of 25 au.
However, there seems to be a population of even smaller discs: Bulger et al. (2014) present spectral energy distributions (SEDs) of a large sample of low-mass members of Taurus, and mention the possibility of a ‘truncated disc’ population, based on a steeply declining SED from ∼20µm appearing to follow the Rayleigh– Jeans limit. Hints for small discs around VLM Objects and BDs have also been found by Hendler et al. (2017) using 63µm continuum and [OI] observations from the PACS spectrometer in the Taurus and
Chamaeleon I regions. Assuming disc geometry and dust properties based on T Tauri stars, they obtain from their SED modelling discs with radii between∼1 and 80 au. However, they stress that further (spatially resolved) ALMA observations are needed to confirm this. Recent studies have attempted to determine the amount and prop-erties of dust in discs around BDs or VLM stars. These can give important hints as to the evolution of the disc, but also the propen-sity for the disc to form planets. Ward-Duong et al. (2018) modelled 24 BD/VLM objects in Taurus, finding a range of dust masses in the range 0.3–20 M⊕and an approximately linear relationship between the stellar mass and dust mass in these discs. BD discs are expected to have a smaller population of mm-size grains in comparison to discs around higher mass T Tauri stars because the radial drift veloc-ities of these grains are higher. However, Pinilla et al. (2017) have examined the 3 mm continuum fluxes of three BD discs in the Taurus star-forming region with the IRAM/Plateau de Bure Interferome-ter combined with previous studies of the 0.89 mm fluxes obtained with ALMA. They find that from millimetre spectral indices, large grains actually seem to be present in these discs.
[image:2.595.306.546.81.304.2]Greenwood et al. (2017) have recently performed thermochemi-cal modelling of BD discs including predictions for future ALMA observations of molecular tracers such as CO, HCN, and HCO+. Their models suggest that BD discs are similar to T Tauri discs and that similar (thermochemical) diagnostics can be used. Interestingly, Bayo et al. (2017) find from recent ALMA Band 6 continuum ob-servations of the disc around the even lower mass object OTS44
Table 1. Wavelengths (λ) and associated flux densities (F) used for compi-lation of the SED of V410 X-ray 1.
λ(µm) F(mJy) Band Reference
0.65 1.8 Rc Bulger et al. (2014)
0.79 7.8 Ic Bulger et al. (2014)
1.25 62 2MASS J Cutri et al. (2003)
1.65 131 2MASS H Cutri et al. (2003)
2.17 155 2MASS Ks Cutri et al. (2003)
3.4 133 WISE W1 Wright et al. (2010)
3.6 136 IRAC 3.6 Luhman et al. (2010)
4.5 143 IRAC 4.5 Luhman et al. (2010)
4.6 136 WISE W2 Wright et al. (2010)
5.8 136 IRAC 5.8 Luhman et al. (2010)
8.0 175 IRAC 8.0 Luhman et al. (2010)
12 196 WISE W3 Wright et al. (2010)
22 253 WISE W4 Wright et al. (2010)
24 221 MIPS 24 Rebull et al. (2010)
70 36 PACS 70 Rebull et al. (2010)
70 51 MIPS 70 Rebull et al. (2010)
160 <122 PACS 160 Rebull et al. (2010) 450 <94 SCUBA-2 Mohanty et al. (2013)
850 <9 SCUBA-2 Mohanty et al. (2013)
1300 <0.3 ALMA B6 This work
(M∼6–17Mjup) that it also possesses a disc and even falls on to a
power-law relation between stellar mass and dust disc mass. Two broad explanations for truncated discs exist. Firstly, a dra-matic segregation of dust and gas may occur due to the radial migration of millimetre-sized dust within what could be termed a ‘normal’ sized gas disc. Indeed, simulations of dust particles in BD discs have shown that migration can be more significant than in T Tauri discs (Pinilla et al.2013). Secondly, the small radial extent may be shared by both the dust and the gas in the disc. Such a scenario would imply a dynamical origin for the small radial extent. In order to determine which of these scenarios may be causing the observed population of truncated BD discs, it is crucial to examine both the dust and gas components of the discs.
In this paper, we present observations and detailed modelling of a candidate VLM star possessing a very truncated disc – V410 X-ray 1. We describe the observational data that goes into the mod-elling in Section 2 and present the thermochemical modmod-elling with Dust And LInes (DALI) in Section 3. The results of the modelling
are then given in Section 4, where we also discuss two possible explanations for the truncation of the dust disc of V410 X-ray 1. In Section 5, we summarize the findings and present the main conclu-sions of this work.
2 O B S E RVAT I O N S
V410 X-ray 1 is a VLM star located within the Taurus star-forming region L1495 at a distance of d∼ 140 pc, lying at coordinates RA=04h17m49s.655, Dec.= +28◦2936.27 (J2000). It has a
spec-tral type determined to be M4 (Andrews et al. 2013) or M2.6 (Herczeg & Hillenbrand 2014). In order to compile an SED of V410 X-ray 1, we draw on photometric measurements from the lit-erature from multiple instruments spanning a range of wavelengths from the optical to the sub-millimetre. The wavelengths, fluxes and appropriate references for these data are given in Table1.
In addition to the published fluxes, we also obtained archival ALMA observations of V410 X-ray 1 (Simon et al.2017). The ob-servations were taken on 2015-09-19 in Band 6 (230 GHz, 1.3 mm) and the on-time source was 6 min. We pipeline reduce the data,
Figure 1. SED of V410 X-ray 1. The fluxes and corresponding references are listed in Table1. Upper limits are given by triangles. The limit we derive on the continuum flux from ALMA observations is given by the blue triangle atλ=1.3 mm. The error bars are shown, but are of the order of the size of the data points.
giving a synthesized beam of 0.26×0.21 arcsec (or 36×29 au at a distance of 140 pc). In addition to the continuum, the observations also covered the12CO J=2–1 transition with a velocity
resolu-tion of 0.2 km s−1. Both the continuum and line observations with
ALMA resulted in a non-detection. Based on these non-detections, we calculate a 3σ upper limit for the continuum flux at 1.3 mm to be 0.3 mJy, and a 3σupper limit for the12CO J=2–1 line flux to be
0.4 Jy km s−1. The latter is based on the assumption of a line width
of 10 km s−1, appropriate for the conditions expected in this disc.1
We include the 1.3 mm upper limit in Table1and Fig.1, and use the12CO J=2–1 upper limit in our analysis in Section 4.
3 M E T H O D S
In this paper, we explore various scenarios for the circumstellar environment of V410 X-ray 1 that are consistent with the SED shown in Fig.1and with the upper limits on the12CO J=2–1 flux.
To this end we use the radiation thermo-chemical disc codeDALI
(Bruderer et al.2012; Bruderer2013) with adaptations as detailed below to model the gas and dust emission in V410 X-ray 1.DALI
solves the continuum radiative transfer equations to obtain the dust temperature, and the thermal balance and chemical abundances to compute the gas temperature structure. The ray tracing module is then used to obtain both an SED and CO fluxes that can be compared against the observations.
InDALI, gas and dust distributions that are not necessarily
co-spatial can be taken into account. We use two dust grain populations with small grains being coupled to the gas distribution and large grains that are settled with respect to the gas. For the study described in Section 4.1, we use size ranges for small and large grains of 5 nm– 10µm and 10µm–0.3 mm, respectively. We use a size distribution indexq=3 for the distribution of grain sizes and employ a mass ratio
1This velocity corresponds roughly to few au radius around a 0.1 M
star. The line width is set by the inner radius of the CO emission, which is usually much further out than the inner disc radius (0.04 au in our case). The modelling of the CO emission as presented later in the paper does indeed confirm that the inner radius of the CO emission is further out, such that a line width of 10 km s−1should be wide enough to comprise the entire emission. We note that even if this estimate is slightly wrong, it only enters the calculation of the flux with a square root dependence.
of large to small grains of 30. We discuss our parameter choices for a model with spatially variable maximum grain size in Section 4.2. The large grains are settled with respect to the gas such that their scale height is reduced to 0.2hgas. The dust opacities are taken
from the opacity library used by Facchini et al. (2017a,b). More specifically, opacities are computed from Mie theory using theMIEX
code (Wolf & Voshchinnikov2004). Optical constants are taken from Draine (2003) for graphite and Weingartner & Draine (2001) for silicates.
We have adapted the code such that the gas is in vertical hy-drostatic equilibrium, which in turns therefore also influences the vertical distribution of the dust. In the radial direction, the gas sur-face density profile is set up as follows:
gas=c
r Rc
−γ exp
−
r Rc
2−γ
, (1)
where we useγ =0.8. When we refer to the gas radius of the models we adoptRgas ≈ 3Rc, since this bounds the region from
which typically more than 90 per cent of the emission arises. In order to obtain vertical hydrostatic equilibrium in the gas, we perform the following steps:
(i) For the model in step 1, we guess the scale height as a function ofrand prescribe it with theDALIparameters for the flaring angle
h=hc(R/Rc)ψ, whereψ andhc are chosen such that the model
SED roughly matches the observed SED. We then calculate the corresponding density distributionρ1(r,z) assuming the surface
density distribution given in equation (1) and a Gaussian density dependence on z with the prescribed scale heighth(r).DALIis then
run to obtain the initial thermal equilibrium temperature distribution T1(r,z).
(ii) The density distribution is then recalculated (ρ2(r,z)) as a
local Gaussian with its scale height now given by that predicted in hydrostatic equilibrium if the disc was vertically isothermal with T(r)=T1(r,z=0).DALIis then run to obtain the thermal
equilib-rium temperature distribution,T2(r,z), with the new density profile ρ2(r,z).
(iii) In the final step, the density distribution is recalculated (ρ3(r,z)) as the density profile that is in vertical hydrostatic
equilib-rium givenT2(r,z). Note that this density distribution is no longer
necessarily Gaussian because the disc is no longer vertically isother-mal.DALIis then run a third time to obtain the thermal equilibrium
temperature distributionT3(r,z) corresponding toρ3(r,z).
As a consistency check,ρ3(r,z) is compared withρ4(r,z), which
is the density profile that is in hydrostatic equilibrium givenT3(r,
z). It is found that the differences betweenρ3(r,z) andρ4(r,z) are
negligible (except at extremely low densities), and thus the final density and temperature profiles are in both thermal and hydro-static equilibrium. Observational diagnostics are derived from the models withT3(r,z) andρ3(r,z), which are consistently reddened
for comparison with the real observations assuming Av=3.8 and
Rv=3.1.
The stellar parameters are kept fixed and are given in Table2. We have slightly adapted the stellar parameters given by Bulger et al. (2014) in order to provide a better match to the stellar part of the SED. They are compatible with the values quoted in An-drews et al. (2013). As the inclination of the disc is unknown, we use an inclination ofi=45◦for our fiducial model. However, we note that our choice of inclination does not affect the results ex-cept for highly inclined discs. The accretion luminosity of V410 X-ray 1 is unknown, and as such we are unable to assign a mass
Table 2. Parameters adopted for both the central star and those that are kept constant during the disc mod-elling procedure.
Stellar properties
Mstar(M) 0.1a
Lstar(L) 0.4
Teff(K) 3000
Rstar(R) 2.3
AV(mag) 3.8
Disc parameters
Rdust, 1(au) 0.6
Inclinationi(◦) 45
Inner disc radiusRin(au) 0.04
aBased on D’Antona & Mazzitelli (1997) and
Andrews et al. (2013).
accretion rate in our models. However, we have verified that accre-tion rates as high as ˙M≈10−8Myr−1have no discernible effect on the appearance of the SED,2and values above this would lie
far outside the measured accretion rates for such low-mass objects (see e.g. Herczeg, Cruz & Hillenbrand2009). Manara et al. (2015) even find that typical accretion rates of BDs in young star-forming regions are of the order of<10−9.5Myr−1. We use an X-ray lu-minosity ofLx=1028erg s−1based on Strom & Strom (1994). The
inner radius of the disc (in gas and dust) is set toRin =0.04 au,
based on a calculation of the dust sublimation radius around a star with the parameters given in Table 2and assuming a dust subli-mation temperatureTsubl∼1500 K (Wood et al.2002; Monnier &
Millan-Gabet2002).
4 R E S U LT S A N D D I S C U S S I O N
4.1 Constraining the radial extent of the dust via SED fitting
The dust disc radius is well constrained by the SED morphology in the Herschel bands. The slope of−3 in theλFλ,λplane between 24 and 70µm suggests that the SED is here dominated by the Rayleigh–Jeans tail of the coolest disc material, while the location of the spectral steepening (between 10 and 24µm) implies that this corresponds to dust at around 150 K. This is suggestive of the spectrum expected from a truncated optically thick disc, consistent with the designation of V410 X-ray 1 as a member of the ‘truncated disc’ class identified by Bulger et al. (2014). Further constraints on the properties of the dust and gas require dedicated modelling, which we perform here.
We have explored the range of dust properties that are compatible with Fig.1and find that, in line with the simple argument above, the SED is best reproduced by models that are optically thick out to a radius where the effective temperature is∼140 K (consistent with the onset of the Rayleigh–Jeans tail at 24µm) and devoid of dust at larger radii. Naturally, we cannot rule out small quantities of optically thin dust beyond this truncation radius (and quantify, in Section 4.2 just how much dust can be accommodated at larger radius in the context of a specific physical model). Nevertheless, trace dust at large radius is notrequiredto reproduce the SED.
The stringent requirement is instead that the spectrum follows the Rayleigh–Jeans slope at wavelengths beyond 24µm. In
[image:4.595.78.247.96.215.2]prac-2In this extreme case the CO fluxes can become slightly higher (by a factor of∼2) for large discs. However for more realistic lower accretion rates, the difference will then be much lower.
Figure 2. SED of models with various Rdust, 1. The model with Rdust, 1=0.6 au corresponds to our ‘truncation’ scenario. The observational data are identical to those presented in Fig.1.
tice, given the luminosity of the star, our radiative transfer modelling implies that the outer radius is atRdust, 1∼0.6 au – Fig.2
demon-strates the effect of three different truncation radii for discs that are optically thick everywhere at 70µm. Despite the non-detection of the flux at 1.3 mm the radius determined from the SED is remarkably well constrained due to the relatively high sensitivity of the ALMA observations. The two measurements of the 70µm flux from PACS and MIPS along with the uncertainty on the disc inclination lead to a relatively modest uncertainty in the radius of approximately 10 per cent. Clearly, larger (or smaller) truncation radii cause the 70µm flux to be over (or under-) predicted. We will henceforth describe this model as the ‘truncation’ scenario.
Constraints on the required dustmassare instead weak and imply only a total dust mass ofMdust0.01 M⊕in order for the disc to
be optically thick at 70 microns. However, for models with dust masses significantly below∼0.1 M⊕, the fluxes in the NIR become too low in comparison with the observations. For a disc truncated at 0.6 au the disc is optically thick out to 1.3 mm for disc dust mass in excess of∼1 M⊕and thus models with dust mass higher than this limit will share the SED shown in black in Fig.2(whose flux at 1.3 mm is slightly below the 3σ upper limit provided by ALMA). This implies that dust masses higher than∼1 M⊕ can be present within the innermost 0.6 au.
Such a large budget of raw planet-forming material contained within such a relatively small radius suggests that V410 X-ray 1 may be a precursor of one of the many systems of tightly packed in-ner planets (STIPs) that have recently been discovered (see e.g. Lis-sauer et al.2011; Fabrycky et al.2014). Perhaps the most well known example of a compact system of planets is TRAPPIST-1, which con-tains at least seven Earth-sized planets within 0.06 au of the central star (Gillon et al.2017). The combined mass of the planets discov-ered so far in TRAPPIST-1 (what might be termed a ‘minimum mass TRAPPIST-1 nebula’) is 5.28 M⊕. Our analysis of the SED cannot rule out the presence of a comparable amount of dust within the inner disc of V410 X-ray 1, suggesting that it may in fact be a precursor to a similarly compact system of terrestrial planets.
4.2 The origin of the truncated disc: truncation or dust migration?
Having shown that the observed SED is consistent with an optically thick dust disc with radius 0.6 au, we enquire into possible origins for such a configuration. One possibility is that the disc has been
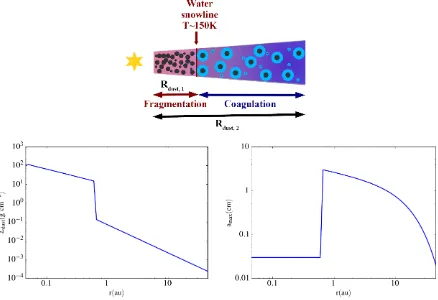
Figure 3. Top:Schematic depiction of the behaviour of dust at the water snowline. Dust grains beyond the water snowline possess large icy mantles which increase the fragmentation velocity, leading to larger grains and inward drift. Dust grains interior to the snowline possess no ice mantles, are prone to fragmentation, and are thus unable to grow as quickly to larger sizes.Left:Surface density of solids as a function of radius assumed in our ‘migration’ scenario, with a steep drop-off due to the H2O snowline at 0.6 au.Right:Maximum grain size as a function of radius assumed in our ‘migration’ scenario, with a steep jump due to the H2O snowline at 0.6 au.
truncated by a dynamical encounter or due to the presence of a companion. A truncation radius of 0.6 au would imply an encounter within a few au which would be extremely unlikely only consid-ering encounters within the star-forming environment, even in the densest star-forming regions, let alone the rather sparse environ-ment in which V410 X-ray 1 is situated. A dynamical origin for this compact disc would instead need to invoke interactions occurring between bound companions in a multiple system. Stamatellos & Whitworth (2009) found that this mechanism could account for a wide range of disc radii: very small discs, as in V410 X-ray 1 would not however have been resolved in their simulations and would have been recorded as disc-less outcomes.
In the following subsection, we explore whether the steep decline in the SED can also be described in terms of dust radial drift. In particular we note that the temperature at the outer edge of the dust disc is suggestively close to that at the water snowline (T∼150 K) and we therefore explore whether the observed spectrum is consis-tent with a discontinuous change in grain properties associated with this snowline.
Outside of the snowline, water is frozen out into ice mantles on the grains. Therefore, grains do not fragment there as easily and can grow to large sizes (Gundlach & Blum 2015). This in turns means that their dynamics progressively decouple from the influence of the gas and the grains thus drift inwards radially. Once they reach the water snowline, the ice mantles are sublimated; this leaves the grains prone to fragmentation, which decreases their sizes. This decrease in grain sizes causes the grains’ dynamics to be more closely coupled to the gas which slows their radial drift.
Consequently the surface density of dust shouldriseinterior to the water snowline. This process is depicted schematically in Fig.3, top (see also Banzatti et al.2015). Ormel, Liu & Schoonenberg (2017) discuss this mechanism as a way of concentrating dust and making the TRAPPIST-1 system. We will henceforth refer to this model as the ‘migration’ scenario.
In Appendix A, we quantify the jump in dust surface density and grain size that is to be expected if the fragmentation velocity changes discontinuously. We also derive expressions for the expected profile of maximum grain size and of dust surface density exterior to the water snowline on the assumption that grain growth in this region is limited by fragmentation and that the dust distribution is in a steady state (i.e. the radial mass flux is independent of radius). We show that while the dust radial surface density distribution scales asr−1.5
(Fig.3, left), the maximum grain size distribution also depends on the radial gas profile. Fig.3(right) depicts the assumed variation of amaxwith radius using equations (A3) and (A7), in which the latter
uses the radial gas profile of the form given in equation (1). The water snowline in this disc coincides well with the location at which we have so far assumed the radial truncation of the dust disc. In order to model whether the observed SED can also be explained with radial drift and fragmentation at the water snowline, we implement the effects on amax and dust intoDALI. In detail,
within 0.6 au we employ a single distribution of grain sizes with size distribution indexq=3 in the range 5 nm to the localamax
value but split the population at 10µm so that small grains follow the gas while larger grains are vertically settled. Outside of 0.6 au we use a grain population (also withq=3, appropriate for an evolved
grain population, see e.g. Birnstiel, Klahr & Ercolano2012) that extends in size from 10µm to the localamaxvalue. We treat this
entire population as being settled (on the grounds that the large amaxvalues and low surface densities in any case imply negligible
emission from small grains in this region).
Although we have argued for the form of theamax and dust
distributions given in equations (A7) and (A10), there are three further parameters that are required to specify the model, i.e. the overall normalizations of the dust surface density distribution and amaxdistributions together with the outermost radius of the dust disc.
Evidently, if we make the outer radius sufficiently small then we can match the SED with a range of parameters since it is relatively easy to hide the spectral signatures of large dust particles if they are only present over a limited radial zone. It is of more interest – in order to contrast with the scenario presented in Section 4.1 where there isnodust beyond 0.6 au – to see if there are any viable models which fit the SED and where the dust is radially extended. Fig.3
exemplifies such a solution.
The values ofamaxand dust surface density just outside the water
snowline (3 cm and 0.1 g cm−2) provide an acceptable fit to the
SED even if the dust extends to 45 au (see Fig.4). Smaller values of amax or larger dust surface density normalization overpredict
the flux at large wavelengths (especially the mm) since both these trends lead to increased optical depth at mm wavelengths. Models in this category would require a lower outer dust radius in order to be compatible with the SED. On the other hand, larger values of amaxand lower values of dust surface density normalization instead
lower the optical depth in the near-infrared to the point that they underpredict the SED in this region and can therefore be ruled out. It is worth emphasizing that the ‘successful’ model with an ex-tended belt of large grains (Fig.4) is not necessarily a self-consistent outcome of dust growth models, since it is not guaranteed that the necessary value ofamaxand dust surface density will be
simultane-ously achieved and that dust growth will be fragmentation limited at this point (as we have assumed in our derivations in Appendix A). Examining the properties of the ‘successful’ model, the dust surface density profile shown in Fig.3(left) corresponds to total dust masses ofMdust(R<0.6 au)∼1 M⊕andMdust(R>0.6 au)∼0.2 M⊕.3It
is only possible to constrain the requiredgasmasses corresponding to theamaxdistribution shown in Fig.3(right) if one specifies the
value ofα(Shakura & Sunyaev1973) that controls the strength of turbulence and the value of the fragmentation velocity,vfrag. From
equations (A1) and (A2), the value ofgascorresponding to a
par-ticular grain size distribution scales asα/v2
frag; forvfrag=5 m s−1
outside 0.6 au (and thereforevfrag =0.5 m s−1inside 0.6 au) and α=10−3the gas mass interior and exterior to 0.6 au is around 40
and 1200 M⊕, respectively. However, given uncertainties in bothα andvfragthe constraints on thegasmass from this modelling are
very weak.
4.3 Gas radius as discriminant between scenarios
So far we have considered two situations for the disc around V410 X-ray 1 which would reproduce the observed SED (see Fig.4).
[image:6.595.314.537.55.216.2]3Whereas the maximum dust mass inside of 0.6 au is unbounded in the truncation scenario, the interior dust mass in the migration scenario needs to be fine-tuned to about 1 M⊕in order for the large grains outside the H2O snowline not to overpredict the mm flux. This dependence arises as the dust mass inside and outside of 0.6 au are linked by the relationships plotted in Fig.3.
Figure 4. SED of the truncated model and the one with dust outside of 0.6 au: the black line is the truncated model withRdust, 1 = 0.6 au and no dust outside of this radius. The blue model hasRdust, 1 =0.6 au, but Rdust, 2 ∼45 au. Both of them comply with the observed upper limit at 1.3 mm.
The first involves a ‘truncation’ scenario in which the dust is en-tirely confined within 0.6 au (for example due to interaction with a companion). The second involves a ‘migration’ scenario in which a combination of radial drift outside (and fragmentation inside) the H2O snowline produces an optically thick inner dust disc and a
low-density region of large dust extending over many tens of au. Whatever the cause, it is clear that SED modelling alone cannot distinguish between scenarios.
A clear discriminating difference between these two scenarios would be the radial extent of thegasin the disc – in the former the gas would have a similarly small radius as the dust, while in the latter the gas disc would share a similarly extended configuration to the large dust grains.4As such, observations of gas tracers towards
V410 X-ray 1 may have the ability to determine which configuration is at work. Fig.5shows the corresponding dust density and temper-ature structure for the two scenarios we consider, the respective gas density and temperature maps are given in Fig.6.
In both scenarios, the dust interior to 0.6 au intercepts the stellar irradiation and causes flared structure to appear in the gas, typical of vertical hydrostatic equilibrium models (see e.g. Woitke, Kamp & Thi2009). The large dust in the ‘migration’ scenario is extremely settled, as such has little effect on the gas temperature in these regions. In these midplane regions, gas and dust temperatures are tightly coupled and in thermal equilibrium due to the high densities (e.g. Facchini et al.2017b), as can be seen by the relatively invariant temperature contours.
The combined thermochemical nature of theDALIcode allows us
to easily examine the line emission from these scenarios. In order to determine the extent of the gas in the disc, we need to consider lines that may be emitted from large radii. Given the faintness of the source and lack of any surrounding cloud material, we have chosen to examine the observability of the12CO isotopologue (hereafter
referred to as CO). Fig.7shows the abundance of CO throughout the disc for the ‘migration’ case, where the gas disc extends to
∼30 au. This model was calculated using a time-dependent chemi-cal solver, but models chemi-calculated with time-independent chemistry yield the same CO J=2–1 line fluxes. The highest abundances are
4Although the gas radius may even exceed the radius of the large grains (see Birnstiel & Andrews2014).
Figure 5. Dust density (left) and dust temperature (right) structure of the truncation (top) and migration (bottom) models. In the dust temperature panels, contours of 150 K are marked.
seen in a warm molecular layer in the inner disc at relative heights ofz/r∼0.2–0.4, and throughout the entirety of the disc exterior to 0.6 au. Disc layers above this are subject to significant amounts of UV irradiation which act to photodissociate the CO molecule. In the inner disc midplane regions with high temperatures, C is pref-erentially in CH4, whereas in the colder midplane regions further
out, CO will be depleted due to freeze-out (where dust grains are present). Despite the relative ubiquity of CO throughout this disc, the majority (75 per cent) of the emission of the J=2–1 transition is confined to radii between 10 and 30 au at a relative height of be-tween 0.15 and 0.7 (yellow hatched region). From inspection of the optical depth surfaces shown in Fig.7, it is clear that the CO emis-sion originates far above theτ =1 surface for the dust at 1.3 mm (dotted line), but is beneath theτ=1 surface for the line (solid line), and is thus optically thick. Therefore, the CO J=2–1 emission is a useful proxy of the outer gas disc radius. Nevertheless, Fig.7only depicts the results of a single model. The presence of large dust grains or the lack thereof outside of 0.6 au has essentially no effect on the CO abundance or temperature in the region where 75 per cent of the emission comes from. The integrated CO J=2–1 line fluxes of both cases are therefore essentially identical. The reason is that the additional dust outside of 0.6 au is very settled and optically thin and therefore has a negligible effect on the temperature structure of the disc.
To investigate a larger parameter space, we have run a suite of 26 models. Each model produces a fit to the observed SED, but the gas radiusRcand the total gas massMgasare varied. All other stellar and
disc parameters are kept fixed to the values listed in Table2. Our chosen ranges of gas mass are set by the requirement that the disc
must obey gravitational stability (and thusMgas < 0.1Mstar), but
must contain sufficient dust mass to reproduce the observed 70µm flux in the SED. Our chosen ranges of gas radius span approximately 3–200 au. Fig.8shows the resulting CO J=2–1 line fluxes obtained from the models within the grid. Again, the presence of the very large grains outside of 0.6 au (or their lack) has no effect on the total CO fluxes in our models.
As can be seen, there is a weak dependence between the resulting J= 2–1 line flux and the value ofMgas assumed for gas masses
greater than≈10−5M, due to the fact that the emission is largely optically thick in this regime. For gas masses lower than≈10−5M
, a somewhat stronger dependence starts to emerge. However, by far the strongest dependence is between the J=2–1 line flux and the value ofRgas. Such a result is not surprising, because due to the
opti-cally thick nature of the line emission, the line flux will simply scale geometrically with the emitting area. Though we do not possess a firm detection of the J=2–1 line flux towards V410 X-ray 1, a combination of our calculated non-detection of<0.4 Jy km s−1and
our model grid already allows us to exclude several configurations. These broadly consist of discs with an outer gas radius greater than 50 au and a gas mass greater than 10−4M
. Other studies of classical T Tauri Stars have used the12CO total flux (or upper
limit) to constrain the radial extent of gaseous discs (e.g. Woitke et al.2011) where spatially resolved observations were not avail-able. Given the weak dependence onMgas, but stronger dependence
onRgas, a firm detection (or more stringent non-detection) would
likely lead the gas radius to be determined rather unambiguously, possibly allowing the ‘truncation’ or ‘migration’ scenarios to be distinguished.
Figure 6. Gas density (left) and gas temperature (right) structure of the truncation (top) and migration (bottom) models. In the gas temperature panels, contours of 150 K are marked. The bump in the gas density plot of the ‘migration’ scenario outside of 0.6 au is an effect of plottingz/rrather thanzon they-axis.
Figure 7. Fractional abundance of CO throughout a disc model in the ‘migration’ case withRgas∼30 au (colour scale), overlaid with the region which is responsible for 75 per cent of the emission for the J=2–1 transition (yellow hatch). The white solid line denotes theτ=1 surface for the J=2–1 transition, while the white dashed line indicates theτ =1 surface for the dust at the wavelengths of this transition (i.e. 1.3 mm).
5 C O N C L U S I O N S
We have modelled the disc around the VLM star V410 X-ray 1. Including an upper limit on the 1.3 mm continuum flux from re-cent ALMA observations gives an additional constraint on the disc structure. We find that its SED can be explained by a very truncated, optically thick dust component withRdust, 1=0.6 au. We have
[image:8.595.311.540.415.560.2]ex-plored two scenarios that can potentially explain this finding. On the one hand, dynamical ‘truncation’ of the disc could have shrunk
Figure 8. Resulting12CO J=2–1 fluxes of our grid of models (points) in which we vary the gas radius and the gas mass. Values between these points are calculated using cubic interpolation on the triangular grid connecting each point. The dashed line indicates a flux of 0.4 Jy km s−1, the upper limit for the12CO J=2–1 derived in Section 2. Black points indicate models which violate this upper limit.
the dust disc to its tiny radius. On the other hand, the SED is also compatible with some amount of large dust outside of 0.6 au. For this scenario, radial ‘migration’ coupled with fragmentation interior to the H2O snowline (located at 0.6 au) result in a cliff industof
two orders of magnitude and in a sudden increase of grain sizes. Our modelling shows that this scenario matches the observed SED for outer dust disc radii ofRdust, 245 au.
[image:8.595.56.277.416.559.2]In both scenarios, a dust mass inside of 0.6 au bigger than∼1 M⊕ is required to match the observed SED, however due to the optically thick nature of the dust, we do not obtain an upper limit on the dust mass. In the ‘migration’ scenario, the dust mass needs to be fine-tuned to∼1 M⊕inside the H2O water snowline in order to match the
SED as the dust masses inside and outside of 0.6 au are dependent on each other.
In order to distinguish further between these scenarios, the gas radius of the disc can offer important information. If it is truncated at very small radii as well, a dynamical truncation of the disc seems likely. If it is more extended, radial drift in combination with dust physics at the water snowline offer a plausible explanation. We present predictions for CO J=2–1 fluxes, invoking variousMgas–
Rgascombinations, that will enable future observations to potentially
distinguish between these two scenarios.
Finally, we note that regardless of the underlying mechanism for the small-scale dust disc, its optically thick nature suggests that several M⊕of dust can be located within a small radial extent from the central star. Such a configuration suggests that V410 X-ray 1 may be a potential precursor to a system of tightly packed terrestrial planets, such as the recently discovered TRAPPIST-1 system.
AC K N OW L E D G E M E N T S
We would like to thank the anonymous reviewer for their thorough report and suggestions that have improved the work. We thank Luca Matr`a, Attila Juh´asz, Mihkel Kama, Leonardo Testi, and Ewine van Dishoeck for helpful discussions. This work has been supported by the DISCSIM project, grant agreement 341137 funded by the European Research Council under ERC-2013-ADG. DMB is funded by this ERC grant and an Science and Technology Facilities Council studentship. This paper makes use of the following ALMA data: ADS/JAO.ALMA#2013.1.00163.S. ALMA is a partnership of ESO (representing its member states), NSF (USA), and NINS (Japan), together with NRC (Canada), NSC and ASIAA (Taiwan), and KASI (Republic of Korea), in cooperation with the Repub-lic of Chile. The Joint ALMA Observatory is operated by ESO, AUI/NRAO, and NAOJ.
R E F E R E N C E S
Alves de Oliveira C. et al., 2013,A&A, 559, A126
Andrews S. M., Rosenfeld K. A., Kraus A. L., Wilner D. J., 2013,ApJ, 771, 129
Artymowicz P., Lubow S. H., 1994,ApJ, 421, 651
Banzatti A., Pinilla P., Ricci L., Pontoppidan K. M., Birnstiel T., Ciesla F., 2015,ApJ, 815, L15
Bate M. R., 2009,MNRAS, 392, 590 Bayo A et al., 2017,ApJ, 841, L11
Birnstiel T., Andrews S. M., 2014,ApJ, 780, 153 Birnstiel T., Klahr H., Ercolano B., 2012,A&A, 539, A148 Blum J., Wurm G., 2000,Icarus, 143, 138
Breslau A., Steinhausen M., Vincke K., Pfalzner S., 2014,A&A, 565, A130 Bruderer S., 2013,A&A, 559, A46
Bruderer S., van Dishoeck E. F., Doty S. D., Herczeg G. J., 2012,A&A, 541, A91
Bulger J., Patience J., Ward-Duong K., Pinte C., Bouy H., M´enard F., Monin J.-L., 2014,A&A, 570, A29
Cutri R. M. et al., 2003, 2MASS All Sky Catalog of Point Sources D’Antona F., Mazzitelli I., 1997, Mem. Soc. Astron. Ital., 68, 807 Draine B. T., 2003,ApJ, 598, 1017
Fabrycky D. C. et al., 2014,ApJ, 790, 146
Facchini S., Pinilla P., van Dishoeck E. F., de Juan Ovelar M., 2017a, preprint (arXiv:1710.04418)
Facchini S., Birnstiel T., Bruderer S., van Dishoeck E. F., 2017b,A&A, 605, A16
Gillon M et al., 2017,Nature, 542, 456
Greenwood A. J., Kamp I., Waters L. B. F. M., Woitke P., Thi W.-F., Rab C., Aresu G., Spaans M., 2017,A&A, 601, A44
Gundlach B., Blum J., 2015,ApJ, 798, 34
Hall S. M., Clarke C. J., Pringle J. E., 1996, MNRAS, 278, 303 Hendler N. P. et al., 2017,ApJ, 841, 116
Herczeg G. J., Hillenbrand L. A., 2014,ApJ, 786, 97
Herczeg G. J., Cruz K. L., Hillenbrand L. A., 2009,ApJ, 696, 1589 Lissauer J. J. et al., 2011,ApJS, 197, 8
Luhman K. L., Allen P. R., Espaillat C., Hartmann L., Calvet N., 2010, ApJS, 186, 111
Manara C. F., Testi L., Natta A., Alcal´a J. M., 2015,A&A, 579, A66 Mohanty S. et al., 2013,ApJ, 773, 168
Monnier J. D., Millan-Gabet R., 2002,ApJ, 579, 694
Oppenheimer B. R., Kulkarni S. R., Stauffer J. R., 2000, in Mannings V., Boss A.P., Russell S. S., eds, Protostars and Planets IV. Univ. Arizona Press, Tucson, AZ, p. 1313
Ormel C. W., Cuzzi J. N., 2007,A&A, 466, 413
Ormel C. W., Liu B., Schoonenberg D., 2017,A&A, 604, A1
Pinilla P., Birnstiel T., Benisty M., Ricci L., Natta A., Dullemond C. P., Dominik C., Testi L., 2013,A&A, 554, A95
Pinilla P et al., 2017,ApJ, 846, 70 Rebull L. M. et al., 2010,ApJS, 186, 259 Reipurth B., Clarke C., 2001,AJ, 122, 432
Ricci L., Isella A., Carpenter J. M., Testi L., 2013,ApJ, 764, L27 Ricci L., Testi L., Natta A., Scholz A., de Gregorio-Monsalvo I., Isella A.,
2014,ApJ, 791, 20
Rodgers-Lee D., Scholz A., Natta A., Ray T., 2014,MNRAS, 443, 1587 Shakura N. I., Sunyaev R. A., 1973, A&A, 24, 337
Simon M et al., 2017,ApJ, 844, 158
Stamatellos D., Whitworth A. P., 2009,MNRAS, 392, 413 Strom K. M., Strom S. E., 1994,ApJ, 424, 237
Takeuchi T., Lin D. N. C., 2002,ApJ, 581, 1344
Testi L., Natta A., Scholz A., Tazzari M., Ricci L., de Gregorio Monsalvo I., 2016,A&A, 593, A111
van der Plas G et al., 2016,ApJ, 819, 102
Voelk H. J., Jones F. C., Morfill G. E., Roeser S., 1980, A&A, 85, 316 Ward-Duong K et al., 2018,AJ, 155, 54
Weingartner J. C., Draine B. T., 2001,ApJ, 548, 296
Whitworth A., Bate M. R., Nordlund Å., Reipurth B., Zinnecker H., 2007, in Reipurth B., Jewitt D., Keil K., eds, Protostars and Planets V. Univ. Arizona Press, Tucson, AZ, p. 459
Winter A. J., Clarke C. J., Rosotti G., Booth R. A., 2018, MNRAS, Woitke P., Kamp I., Thi W.-F., 2009,A&A, 501, 383
Woitke P et al., 2011,A&A, 534, A44
Wolf S., Voshchinnikov N. V., 2004,Comput. Phys. Commun., 162, 113 Wood K., Lada C. J., Bjorkman J. E., Kenyon S. J., Whitney B., Wolff
M. J., 2002,ApJ, 567, 1183 Wright E. L. et al., 2010,AJ, 140, 1868
A P P E N D I X A : D U S T P R O C E S S I N G AT T H E WAT E R S N OW L I N E
In Section 4.2, we study whether the truncated dust disc could be related to physical processes happening at the water snowline. The key property that changes across the snowline isvfrag, the
maxi-mum collision velocity of grains for which coagulation, rather than fragmentation, is to be expected. Following Blum & Wurm (2000) and Gundlach & Blum (2015),vfragis reduced by an order of
magni-tude interior to the snowline. If grain growth is limited by fragmen-tation, the local value ofvfragis linked to the maximum expected
grain size through equating the relative collision velocityv for the largest grains at any location withvfrag.vfor grains that are
coupled to a turbulent flow via drag forces is given by (Voelk et al.
1980; Ormel & Cuzzi2007):
v≈√αStcs, (A1)
whereαis the Shakura–Sunyaev viscosity parameter (Shakura & Sunyaev1973),csthe sound speed, and St is the local Stokes number
(ratio of drag time to dynamical time) for the largest grains. In the Epstein drag regime, the midplane St for grains of sizeamaxis given
by
amax=
2gasSt πρgrain,
(A2)
where we have assumed a Gaussian vertical structure. When growth is limited by fragmentation, the size of the largest grains (radius amax) is set byv≈vfrag. Combining equations (A1) and (A2) then
yields
amax∝v2frag. (A3)
This change in maximum grain size also affects the radial drift of the largest grains (which, for typical expected grain size distributions, dominate the local dust mass budget). Since the rate of radial drift for particles with St<1 scales as St we also expect
vdrift∝v2frag. (A4)
Continuity then implies that the local dust surface densities at an interface wherevfragchanges steeply scales as
∝v−2
frag (A5)
on each side of the interface. In summary, then, such a model predicts (if vfrag varies by a factor 10 at the snowline) that the
maximum grain size should bereducedby two orders of magnitude within the snowline, while the total surface density of solids should increaseby the same factor.
In order to derive the radial dependence ofamaxoutside of the
wa-ter snowline in the fragmentation dominated regime, we rearrange equation (A1) and invoke the thin disc hydrostatic equilibrium rela-tioncs=(H /r)vso as to obtain the Stokes number of the largest
grains:
Stfrag=
0.37 3α
vfrag v
2r
H
2
, (A6)
where v=
GMstar
r , and the numerical factors are determined from fits to simulations (Birnstiel et al.2012). Usingc2
s∝r−0.5and gasfrom equation (1) we then obtain an expression for the radial
dependence of the maximum grain size of the form:
amax(r)∝r−0.3exp
−
r Rc
1.2
. (A7)
In order to calculate the radial profile of the dust surface density we invoke a state of steady flow so that
dustvdriftr=const. (A8)
In the limit St<1 the radial drift velocity is given by
vdrift∼Stfrag
H r
2
v (A9)
(Takeuchi & Lin2002) and substituting for Stfragfrom equation (A6)
then yields the radial dependence ofdustas
dust∝r−1.5, (A10)
where the exponential cut-off of the gas distribution cancels out.
This paper has been typeset from a TEX/LATEX file prepared by the author.