City, University of London Institutional Repository
Citation:
Nguyen, P. ORCID: 0000-0001-5643-0585, Henkin, R. ORCID:
0000-0002-5511-5230, Chen, S., Andrienko, N. ORCID: 0000-0003-3313-1560, Andrienko, G. ORCID:
0000-0002-8574-6295, Thonnard, O. and Turkay, C. ORCID: 0000-0001-6788-251X (2019).
VASABI: Hierarchical User Profiles for Interactive Visual User Behaviour Analytics. IEEE
Transactions on Visualization and Computer Graphics, doi: 10.1109/TVCG.2019.2934609
This is the accepted version of the paper.
This version of the publication may differ from the final published
version.
Permanent repository link:
http://openaccess.city.ac.uk/id/eprint/22591/
Link to published version:
http://dx.doi.org/10.1109/TVCG.2019.2934609
Copyright and reuse: City Research Online aims to make research
outputs of City, University of London available to a wider audience.
Copyright and Moral Rights remain with the author(s) and/or copyright
holders. URLs from City Research Online may be freely distributed and
linked to.
City Research Online:
http://openaccess.city.ac.uk/
[email protected]
VASABI: Hierarchical User Profiles for
Interactive Visual User Behaviour Analytics
[image:2.612.99.524.143.408.2]Phong H. Nguyen, Rafael Henkin, Siming Chen, Natalia Andrienko, Gennady Andrienko, Olivier Thonnard and Cagatay Turkay
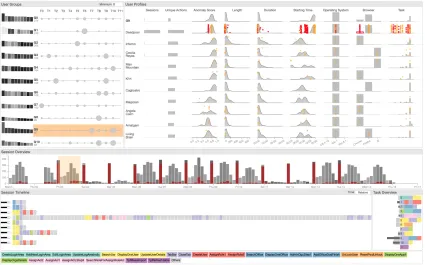
Fig. 1. The VASABI interface realises our multifaceted, visual user behaviour analysis approach through hierarchical profiles. We concurrently visualise and interrelate: clusters of users based on tasks extracted with a topic-modelling based approach (top-left), user profiles with multiple features (top-right) and distribution of sessions over time (middle). Selected sessions (brown brush over temporal histogram) are also highlighted both within the user profiles as orange dots and analysed further in the session timeline (bottom).
Abstract— User behaviour analytics (UBA) systems offer sophisticated models that capture users’ behaviour over time with an aim to identify fraudulent activities that do not match their profiles. Motivated by the challenges in the interpretation of UBA models, this paper presents a visual analytics approach to help analysts gain a comprehensive understanding of user behaviour at multiple levels, namely individual and group level. We take a user-centred approach to design a visual analytics framework supporting the analysis of collections of users and the numerous sessions of activities they conduct within digital applications. The framework is centred around the concept ofhierarchical user profilesthat are built based on features derived from sessions, as well as on user tasks extracted using a topic modelling approach to summarise and stratify user behaviour. We externalise a series of analysis goals and tasks, and evaluate our methods through use cases conducted with experts. We observe that with the aid of interactive visual hierarchical user profiles, analysts are able to conduct exploratory and investigative analysis effectively, and able to understand the characteristics of user behaviour to make informed decisions whilst evaluating suspicious users and activities.
Index Terms—hierarchical user profiles, user behaviour analytics, visual analytics, cybersecurity
1 INTRODUCTION
• P. H. Nguyen, R. Henkin, C. Turkay are with City, University of London, UK. E-mail:{p.nguyen, rafael.henkin, cagatay.turkay}@city.ac.uk.
• S. Chen is with Fraunhofer IAIS. E: [email protected]. • N. Andrienko, G. Andrienko are with Fraunhofer IAIS and City, University
of London. E:{natalia.andrienko,gennady.andrienko}@iais.fraunhofer.de. • O. Thonnard is with Amadeus, France. E: [email protected].
Manuscript received xx xxx. 201x; accepted xx xxx. 201x. Date of Publication xx xxx. 201x; date of current version xx xxx. 201x. For information on obtaining reprints of this article, please send e-mail to: [email protected]. Digital Object Identifier: xx.xxxx/TVCG.201x.xxxxxxx
be-haviour. The current UBA solutions, however, are limited in providing such in-depth views into users’ behaviour, and valuable analyst time is being lost in identifying the causes of the issues and deciding on whether the signals from the UBA system are indeed problematic cases. We propose a visual analytics approach to facilitate effective decision making for cybersecurity analysts through interactive visual analysis of user behaviour with hierarchical user profiles.
We take a user-centred approach and characterise the problem do-main through a study of the goals and the analytical tasks within the context of UBA systems. We then design a visual analytics frame-work that encompasses interactive visual hierarchical and multifaceted user profiles to help investigate the various perspectives of user be-haviour concurrently. Our approach involves the extraction of common user tasks to summarise user behaviour, identification of groups of users with similar behaviour as evidenced through their tasks, and con-struction of interactive visual hierarchical user profiles to support the multifaceted summarisation and comparative analysis of users and their respective groups. In order to provide rich profiles of users’ activities, we discuss how various measures can be put together and introduce a topic modelling based approach to extract user tasks from logs of action sequences. These tasks are then incorporated into a clustering algorithm that enables us to extract groups of users together with their dominant tasks to inform analysts on the potentialrolesthat the groups might have. We then present our visualisation and interaction designs that we devise to facilitate an analysis process where users and their behaviour are central. We demonstrate the efficacy of our approach through a number of use cases conducted as a multidisciplinary team and discuss the limitations observed. To summarise, our contributions in this paper include:
• Domain characterisation for interactive visual UBA solutions • Interactive visual hierarchical user profiles that provide a
multi-faceted overview of users’ behaviour
• Text analysis techniques based clustering and summarisation tech-nique to infer users’ tasks from logs of action sequences • Novel visual representations and interactions to investigate users’
activities at multiple levels
• A visual analytics framework that enables the exploratory and investigative analysis of users’ behaviour and suspicious sessions
2 RELATEDWORK
2.1 Modelling User Profiles
Model building uses data collected from user activities in digital sys-tems such as application logs and clickstream data. There has been much research working on insider threat detection with user pro-files [25, 35]. A common approach is to build a profile based on statistical features of the collected data in relation to the user and per-form statistical tests to detect a threat [42]. More sophisticated methods consider sequences of events rather than single-value statistics such as one-step Markov [14] (one-step transition probability between adjacent events), hybrid multi-step Markov [20] and sequence matching [22] (computing similarity between the sequence and the profile). In this paper, we do not only apply descriptive statistics on simple data char-acteristics for building user profiles, but also use machine learning to extract latent features as user tasks from sequences of actions that users perform.
We can turn to the literature on general-purpose event sequence analysis for extracting tasks, or more general patterns, from actions. Events that co-occur frequently can be extracted [2, 39]. A limitation of these algorithms is the large number of resulting set of similar patterns, making it challenging to interpret. Several techniques can be applied to address this issue: adding constraints such as temporal context and concurrency [32], adding pattern ranking criteria [12], and exclusion criteria [26]. Chen et al. [10] produce patterns that minimise the difference between the patterns and the original data sequence. Our paper uses topic modelling [4] to extract patterns of actions for building hierarchical user profiles.
2.2 Visualising User Profiles
Adar propose DTWExplorer [1] to visualise and compare different searching behaviour of Internet users over time. Gotz and Wen [15] apply rule-based pattern detection methods for user behaviour analysis and provide visualisation recommendation by inferring users’ intention. Wang et al. [40] employ hierarchical clustering to clickstream data to detect the popular behaviours and visualise the results with hierarchi-cal visualisation. Since the user behaviour data is often multivariate, Rzeszotarski propose CrowdScape [34] multivariate visualisation to visualise the crowd-sourcing workers’ behaviour and analyse their be-haviour patterns and performance. Cadez et al. [5] use the first-order Markov Chain clustering algorithm to analyse user behaviour patterns and visualise each clusters with a sequence visualisation method. These techniques, however, are limited in understanding user behaviour at different levels of granularity. To address this, we also apply cluster analysis based on the similarity of the tasks, but as a step to build a hierarchical user profile. We then visualise the resulting clusters along with the task distributions to represent users’ behaviour.
Cybersecurity has become an important application domain in visual analytics research [37]. Colombe and Stephens [11] are among the earliest to visualise the statistical profiling for identifying malicious insider attacks in Intrusion Detection System (IDS). Combining the netflow, IDS logs data, Chen et al. [9] use an entropy-based method to calculate and visualise the dynamic user behaviours. More specific profiling of routing behaviours [17], port usages [36] are proposed to identify special types of anomaly user behaviours. Li et al. [24] visualised the user behaviour categories with a calendar visualisation and investigate the network user behaviour with customised features, such as duration and packet number. Chen et al. [8] construct a user behaviour map to visualise the dynamic user behaviour and profile the users based on their territories and trajectories. The work that is most related to ours is from Legg [23]. Their paper also takes a visual analytics approach in building user profiles for detecting insider threats. However, there are key differences between the two pieces of work. In their data,user roleis given, which plays an important role in their analysis workflow. In our case, we need to extract user tasks from action sequences as a step towards establishing the roles that a user may have. Distinctively, our work builds hierarchical user profiles to support a range of analysis tasks at session, user and user group levels.
3 DOMAINCHARACTERISATION
This project is conducted within the context of a multi-disciplinary EU funded research project and a user-centred approach [30, 31] has been followed in the design and development of the solutions we present in this paper. Here, we first describe the problem context, explain our methodology in characterising the domain and abstract out analytical goals and tasks that inform further development.
3.1 Problem Context
Overview. In the wider context of the aforementioned project, the
interest is on building and deploying UBA solutions that are capable of identifying and investigating fraudsters who are increasingly using complex methods to circumvent rule-based detection methods [6], and disguise themselves as legitimate users and mimic their activities. The overall idea with such UBA solutions is to build a probabilistic, multi-criteria scoring mechanism that evaluates incoming sessions from all the users considering theirpersonalised, local models. However, due to the complexity of human behaviour, making decisions regarding the sessions or the users solely based on the scores from the UBA model is not possible. Analysts often need to perform in-depth investigations of the sessions and of the users that are marked as unusual, consider the various facets of their behaviour and evaluate sessions within the historical context of users. Moreover, acomprehensive understanding of human behaviouris needed to be able to adapt the models to the idiosyncrasies of different users.
Specific Context and Data. In the context of this paper, we work
co-author’s organisation) that operates on the logs that comprise of se-quences of actions carried out by the users of an administrative interface of a login and security server. The log data is split into sessions, each containing an ordered list of timestamped actions performed by the user conducting that session. In each session, particular tasks are conducted and actions are performed by the user. Actions in this context are se-mantically labelled and functionally relevant activities, e.g., managing users and/or organisations with actions such as “CreateLoginArea”, “SearchUsr”, “DisplayOrgaDetails” or performing some intermediate
actions such as “CloseTab” and “Cancel”.
Each session here is then a data record with the attributes: clock timeto indicate the start and end,User IDto indicate the performer, other meta information such asbrowserandoperating system, and the sequence ofactions(labels) and when each action took place within the session. In addition to these, we also get theanomaly scorethat is provided by the underlying UBA with 1 being an unusual and 0 a normal session. The data set that we work with here comprises of
19,351 sessionsperformed by1,670 userswithin a15 daytime window using305 unique action types. Although we use this specific data set in this paper, the form of the data is representative of log based solutions used for behaviour modelling in many other domains [13, 33].
Terminology. We define the following terms in the paper.
• Action: A semantically labelled, functionally relevant activity identified for logging within an application
• Session: Data log record that captures the actions performed within a fixed duration
• User: The user of the application who performs the actions within a session
• Analyst: The experts who analyse the sessions logs and the alerts from the UBA model, i.e., users of the visual analytics solution described here
3.2 Externalising Goals and Tasks
We describe our methodology used in understanding analysts’ goals and their tasks before presenting them in a structured form.
3.2.1 Methodology
To understand the application domain, we conducted a series of work-shops with analysts, who all are familiar with the types of investigation mentioned above. Three of them have more than 10 years of experi-ence, and the other two have around 5 years of experience. The initial sessions are primarily to understand the current working process, make observations and informal interviews where the analysts demoed how they interpret the signals stemming from the UBA model and how they investigate sessions. Observations and findings from these sessions not only informed the designs in this work, but also the recent work produced by the same team [7,30,31]. These papers and our work share the same initial context with an overalluser behaviour understanding
goal but have different foci and approach. In these earlier work, the fo-cus was primarily on understanding the individual sessions and unusual actions, and with our approach in this paper, we direct our interest to users and user groups.
Based on these observations, we identify goals and tasks, design and implement initial versions of the solutions, present them to the analysts in follow-up sessions (in some cases, some designs were discussed in isolation), and gather feedback to iteratively improve the designs. As a multidisciplinary team of visualisation researchers and analysts, we eventually conduct analysis sessions, where we identify potentially interesting cases (presented as part of Section 6) and clarify the use cases further.
3.2.2 Analytical Goals and Tasks
Here, we externalise our observations from the domain characterisation sessions described above. In the context of this problem domain, we observe that the analysts have three overarchinggoalswhere a number ofanalytical tasksneed to be accomplished.
G1 – Identify and characterise groups of users with similar roles.
A critical mechanism for the evaluation of the activities of a user is to
investigate their behaviour in comparison to users with similar roles. To accomplish this, analysts need to identify a group of users that perform similar tasks, understand the characteristics of the kinds of activities performed by the group, and infer the potential roles of the group by investigating the characteristics of their high-level behaviour.
T1 Summarise a user group through the behaviour of its users.In order to understand the high-level characteristics of a group, ana-lysts need to investigate the combined behaviour of its members through an overview of the tasks they perform and the aggre-gate statistics as computed from all the sessions conducted by the group. Examples: investigate whether there are dominant tasks for a group or no clear common tasks; observe the feature aggregates for distinctive activities or working patterns.
T2 Compare multiple user groups.To better understand the groups, analysts need to compare and identify the differentiating charac-teristics within them.Examples:investigate which tasks occur distinctively for a group or shared across several; look for differ-ences in the statistical features, e.g., a group with unusual working hours.
G2 – Identify and explore users of interest. Analysts routinely ex-plore large collections of sessions performed by the users with the aim of building an understanding of the common and unusual characteristics of users and identify unusual users for further investigation.
T3 Summarise a user through its characteristic behaviour. Individ-uals have idiosyncratic ways in which they use a system and analysts need to build a multifaceted understanding of user be-haviour to be able to make decisions when they work on individual cases and when they are developing/improving the UBA mod-els.Examples:observe simple behaviour characteristics such as which times of day the system is used; understand which actions are performed in what frequency to complete different tasks
T4 Compare multiple users.Analysts often investigate several users (which could be from the same group or organisation, or any collection of users) simultaneously and need to compare their characteristics to identify users with distinct behaviour or work-ing patterns overall or for a particular time period. Examples:
compare the working hours of a user to the other members of the same group; compare the activities of several users in a given temporal frame and check for deviation.
T5 Compare a user with a group.The group level aggregates provide the high-level characteristics of a group of users and analysts need to assess how expected the behaviour of a user is given the characteristics of the group.Examples:for any unusual task for a user given their own historical data, check if that activity is common for their respective groups; assess if a user is different to the overall group characteristics.
G3 – Identify and investigate sessions of interest.Analysts need to identify unusual sessions either visually or through the computational models, and they need to perform in-depth investigations of the suspi-cious activities and make decisions on whether these are indeed events that need further action.
T6 Compare a session with a user’s typical behaviour. When a session is flagged as anomalous, a key task is to compare what happens in the session to the overall behaviour of that user and also to the group that the user belongs to.Examples:check if the types of actions conducted in a session fall under the usual tasks of the user; check if the properties of the session, such as duration and action rate, are usual for that user.
4 INTERACTIVEVISUALHIERARCHICALUSERPROFILES
Our approach supports the hierarchical and multifaceted analysis of users and their activities, which are summarised in the three high-level analytic goals and seven tasks identified earlier. The approach involves the design and development of (1) extraction of common user tasks to summarise user behaviour, (2) identification of groups of users with similar behaviour as evidenced through their tasks, and (3) interactive visual hierarchical user profiles to support the multifaceted summarisation and comparative analysis of groups, users and sessions. The core concept of our approach ishierarchical user profilesthat characterise the behaviour of both individual users and groups of similar users in terms of their behaviour (Sect. 4.1) in an integrated manner. In order to profile individual users, we first determine a series of features some of which are explicitly available and others computationally derived. To be able to effectively characterise the behaviour of users and groups, we extractcommon user tasks, activities that are frequently conducted by users in certain roles, through a computational method involving topic modelling (Sect. 4.2) and identifygroups of users with similar behaviourwith the help of these tasks (Sect. 4.3). We then incorporate the results of these computational methods within novel interactive visualisations ofuser clusters(Sect. 4.4),user profiles
(Sect. 4.5), anduser tasks(Sect. 4.6). All of these views are then integrated within a linked, multi-viewvisual analytics frameworkcalled VASABI (Sect. 5) to support the hierarchical and multi-faceted analysis of user groups, users, and their sessions.
4.1 Building Hierarchical User Profiles
Behaviour of users in digital systems is largely determined by different
rolesthat they have in their organisations. Each role could be responsi-ble for severaltasks. As a result, users’ actions in the systems are likely to reflect the tasks they need to regularly perform. In certain cases, these roles and tasks could be part of the data; when this is not the case, more complex methods must be employed to extract such information. In this section, we describehierarchical user profilesas the core con-cept of our visual analytics approach; we describe the features that are used tobuilda user profile, the enrichment of the profiles with latent features and two visualisation designs that address the elicited tasks.
4.1.1 Individual User Profiles
The user profiles combine three levels of features based on the different cases of feature availability: inherent features that are explicitly available,derivedfeatures that can be directly extracted from the data through the use of standard statistical measures andlatent features that are not directly available for extraction, but would require more sophisticated methods to reveal underlying, latent characteristics of user behaviour. Here, we consider the data in our application context and list the various features we put into use:
Inherent features. Features that describe the low-level
character-istics of how users utilise the application. These features are often explicit and provided as meta-data within the session records.
• Browserused in the session
• IP Addressthrough which the session is conducted • Operating Systemrunning on the user’s computer
Derived Features. Features that are derived through
straightfor-ward statistical computations considering the distribution of actions in sessions and the distribution of sessions over users, together with any other explicitly derived metric such as model derived scores.
• Session duration / lengthas a measure of time taken in the session and the count of actions performed
• Total Sessionsas a statistic on how active the user is
• Total Unique Actionsas a measure on how diverse is a user in the actions they perform
Latent Features. Features that provide in-depth understanding
into the behaviour of users through the application of a sophisticated computation, such as modelling and clustering.
• Anomaly Scorefor individual sessions as provided by the UBA system to indicate the normality of a session
• Topic modelling-based user tasksto extract high-level tasks from raw actions (as detailed in Sect. 4.2).
4.1.2 Group Profiles
Group profiles refer to the higher level aggregations of characteristics of users. In order to construct these profiles, users of similar traits are identified through a clustering method explained in Sect. 4.3, and the features of individual users (those described above) are aggregated for each group. Overall, a group profile comprises three key elements:
aggregated feature statisticsdepicting the joint characteristics of the group in terms of the inherent and derived features of individuals,task profilesdepicting the most frequent tasks conducted by the group, and
representative userschosen as members that are of particular interest for further analysis (using criteria as discussed in Sect. 4.4). Combined together, group and user profiles help address the analysis goalsG1and
G2. Moreover, a user profile also characterises how typical sessions look like, allowing comparison at session level (addressingG3).
4.2 Extracting User Tasks with Topic Modelling
In this section, we discuss our approach in mining sequences of user actions to extractuser tasks, one of the aforementioned latent features. One challenge in the mining of such tasks is to handle thenoisein the data. During a task, a user may perform unintended actions due to incompetence or carelessness. There could also be different but similar ways to complete the same task. This challenge makes approaches that model a task as a strictly ordered sequence of actions [31, 39] limited. Therefore in this work, we consider a task as asetof related actions that commonly appear in a session. Tasks then can be extracted by a classic item-sets mining algorithm [2]; however, this approach often leads to a high number of patterns, and is sensitive to a predefined threshold that determines whatfrequentco-occurance means.
We take a text mining approach, considering each session as a docu-mentand each action as aword. We apply topic modelling using Latent Dirichlet Allocation (LDA) technique [4] to extract latenttopicsin the set of session documents. The resulting topics are sensitive to a number of parameters: alpha, beta and the number of topics. To tune the pa-rameters for a high quality set of topics, we use a visualisation assisted LDA ensemble technique [7] that guides the interactive selection of the best topics from multiple runs with different parameters. Each topic is modelled as a probability distribution of all words in the vocabulary; for instance,{(SearchUser, 0.6), (DisplayUser, 0.3), (UpdateUserDetails, 0.1)}, and each document is modelled as a probability distribution of all these extracted topics. In each session, a user normally performs a few tasks and each task typically consists of a few actions. This analogy motivates us to map each topic as a task. For our dataset, 13 topics are extracted, representing 13 common tasks.
4.3 Clustering Users based on their Tasks
To provide a semantic characterisation of users (addressingG1), we classify them based on the tasks they perform. From the output of topic modelling, a session can be modelled as a vector of tasks:si=
(pi1,pi2, ...,pik), wherepi j is the probability of task joccuring in
sessionsi, withkas the total count of tasks. A userucan then be
modelled as a mean of its session vectors:u= m1∑mi si, wheremis the
number of sessions performed byu.
However, there is a logical issue with adding session vectors. pi j
indicates how probable task joccurs in sessionsi, but it could be
misleading to compare the probability of the same task between two sessions. For instance, p11=0.5 means 50% of what happens in session 1 is about task 1, andp21=0.3 means 30% of what happens in session 2 is about task 1. But it cannot be inferred that session 1 has more activities of task 1 than session 2 due to the difference in their number of actions. Therefore, we classify the probability based on a particular thresholdθ to indicate whether a task occurs in a session or not. Formally,si= (bi1,bi2, ...,bik), wherebi j=1 ifpi j≥θand
bi j =0 otherwise. This binary transformation also allows a more
interpretable representation of the user vector:u= (t1,t2, ...,tk), where
tiis the proportion of the user’s sessions where taskioccurs. Choosing
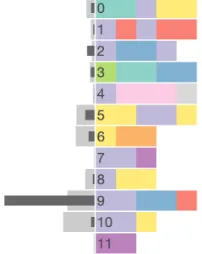
T0 T1 T2 T3 T4 T5 T6 T7 T8 T9 T10 T11 T12 G0 216 G1 85 G2 213 G3 104 G4 200 G5 110 G6 155 G7 73 G8 123 G9 79 G10 64
User Groups Minimum0
ALL G0 G1 G2 G3 G4 G5 G6 G7 G8 G9 G10
0.00.20.4 0.60.81.0 0200400600800 00:0006:0012:0018:0000:00 00:0006:0012:0018:0000:00
Sessions Unique Actions Anomaly Score Length Duration Starting Time Operating System Browser Task User Profiles
Thu 29 October Mon 03 Wed 05 Fri 07 Oct 09 Tue 11 Thu 13 Sat 15 Mon 17 Wed 19 Fri 21 Oct 23 Tue 25 Thu 27 Sat 29 Mon 31 November Thu 0 0 100 200 300 400 Session Overview 0 1 2 3 4 5 6 7 8 9 10 11 12 Task Overview
Session Timeline Time Relative
[image:6.612.317.569.51.159.2]CreateLoginArea AddNewLoginArea EditLoginArea UpdateLogAreaIndic DeleteLoginArea SearchUsr DisplayOneUser UpdateUserDetails DuplicateUser CopyDisplayedUser CreateUser AssignRole1 AssignRole2 AssignRoleAclConfirmation1 SearchOffice DisplayOneOffice UnLockUser WarningDeleteUser DeleteUser DisplayOrgaDetails AssignAcl2 AssignAcl1 AssignACLStep3 TpfRefreshTable DisplayOneAppli FilterHistory Others
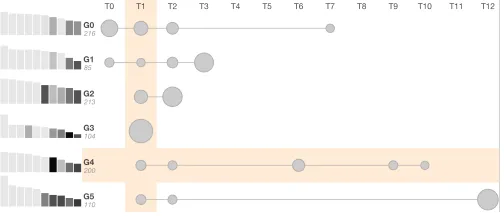
Fig. 2. Visual representation of a user cluster showing the dominant tasks performed by its users (right) and the 10 most relevant users (left).
tasks in one session, whereas largeθleads to too many sessions not associated with any tasks. We chooseθ=0.3 for our dataset for two reasons: (1) a large number of sessions (94%) will have at least one task, and (2) each session will have up to 3 tasks, which is about consistent with reality according to the domain experts.
We then applyk-means clustering [28] to cluster users based on their vector representations. k-means clustering is expected to work well due to the small number of vector dimensions, which is 13 in our case (13 tasks). To decide the optimalknumber of topics, we use the elbow method [21] to visually selectkby assessing the change of a cost function with different values ofk. Our cost function is the sum of squared distances of all data points to their closest cluster centre. As a result, 11 clusters of users are generated.
4.4 Visualising User Clusters
This section discusses the visual design of user clusters to provide a summary of a cluster (addressingT1) and to support comparison of multiple clusters (addressingT2). We represent a cluster through its centroid; i.e., the mean of all user vectors within the cluster:
c= (p1,p2, ...,pk), wherekis the number of all extracted tasks.
Seman-tically,pidescribes how much the users in a cluster works on taskion
average. The vector is represented as a sequence of connected circles, each for a vector component or task. The circle size corresponds to the magnitude of the vector component. Fig. 2 shows that within 13 tasks, users in groupG0focus more on tasks T0, T1 and T2.
To provide a glance into the users in a cluster, we display the number of users as text and the 10 most relevant users as rectangular glyphs. In each user glyph, the height corresponds to the number of sessions performed by the user and the lightness proportional to the median anomaly score of the user’s sessions. The relevance of useruis com-puted as follows:rel(u) =√n×median{ai}, wherenis the number of
sessions performed byuandaiis the anomaly score of sessionsi. The
scaling square root component is to put emphasis on users with higher number of sessions, since users with both many sessions and higher median scores are of utmost interest.
To enable the comparison of multiple clusters, their visual summaries are stacked together (Fig. 3) as in a matrix. This makes it possible to compare the involvement of user groups between different tasks. For instance, as seen in Fig. 3, Task T1 appears in most of user groups; whereas, Task T8 is not common for any groups. The less frequent tasks, small circles, can be filtered out to accelerate the observation of more probable tasks. Highlighted horizontal and vertical background accompany mouse movement to improve the reading of alignments.
After gaining an understanding of user groups, the most natural next step is to drill down to a particular group or user. The visualisation allows triggering this further investigation by clicking on the group representation or the rectangular user glyph. We explain how such selection affects other views in the following sections.
4.5 Visualising User Profiles
This section discusses the visual design of user profiles to support the identification and exploration of both users and sessions of interest (addressingG2,G3).
4.5.1 Visual Summary and Comparison of User Profiles
As discussed earlier, our user profile consists of multiple features that model different characteristics of user behaviour. Thus, it is essential for analysts to observe many features of user profile concurrently (ad-dressingT3). For each feature, we use a small chart to show a summary of the user’s sessions and concatenate the charts vertically to produce a compact representation of a user profile. The visual profiles are then
T0 T1 T2 T3 T4 T5 T6 T7 T8 T9 T10 T11 T12
G0 216 G1 85 G2 213 G3 104 G4 200 G5 110 G6 155 G7 73 G8 123 G9 79 G10 64
User Groups Minimum0.1
ALL G0 G1 G2 G3 G4 G5 G6 G7 G8 G9 G10
0.00.20.4 0.60.81.0 0200400600800 00:0006:0012:0018:0000:00 00:0006:0012:0018:0000:00
Sessions Unique Actions Anomaly Score Length Duration Starting Time Operating System Browser Task User Profiles
Thu 29 October Mon 03 Wed 05 Fri 07 Oct 09 Tue 11 Thu 13 Sat 15 Mon 17 Wed 19 Fri 21 Oct 23 Tue 25 Thu 27 Sat 29 Mon 31 November Thu 0 0 100 200 300 400 Session Overview 0 1 2 3 4 5 6 7 8 9 10 11 12 Task Overview
Session Timeline Time Relative
CreateLoginArea AddNewLoginArea EditLoginArea UpdateLogAreaIndic DeleteLoginArea SearchUsr DisplayOneUser UpdateUserDetails DuplicateUser CopyDisplayedUser CreateUser AssignRole1 AssignRole2 AssignRoleAclConfirmation1 SearchOffice DisplayOneOffice UnLockUser WarningDeleteUser DeleteUser DisplayOrgaDetails AssignAcl2 AssignAcl1 AssignACLStep3 TpfRefreshTable DisplayOneAppli FilterHistory Others
Fig. 3. Visualisation of user clusters. Each row represents a cluster of users with circles mapping to the proportion of tasks performed. Top 10 relevant users in a cluster are shown on the left.
stacked together to enable comparison (Fig. 4) (addressingT4,T5) and are sorted using the samerelevancemetric described in Sect. 4.4.
• Per-profile feature(e.g., the number of sessions). A single hor-izontal bar is used, which is unnecessary for one profile but is useful for comparing multiple ones.
• Per-session quantitative feature(e.g., anomaly score). Initially, we use a histogram to show the distribution of feature values (see supplemental material). However, histograms are sensitive to the choice of the number of bins and are not visually straightforward to compare multiple histograms. Therefore, we use kernel den-sity estimation (KDE) [38] to avoid rough binning and enhance comparison between multiple features.
• Per-session nominal feature(e.g., operating system). A simple barchart is used. The same set of nominal values are shared across all profiles to enable comparison.
Both individual and group profiles have the same visual representa-tion (except for the group name and the user name). As seen in Fig. 4, this allows the comparison of multiple characteristics both between
usersand with their correspondinggroupG0. Many observations can be made through this figure. All of these users have completed many more sessions and performed many more unique actions than the aver-age of their group. The anomaly scores from their sessions are higher than those from their group as well, especially sessions from Blood-shed. The behaviour in terms of session length and duration is similar between users, but very different in terms of starting time.
4.5.2 Analysis of Sessions in the Context
In the investigation of an anomalous session, it is crucial to analyse it within the context of the user performing the session so that any deviation from the user’s typical behaviour will be effectively spotted (addressingT6). We support this by enabling comparison between the sessions of interest and their corresponding user profiles that are built from all sessions performed by the same users. Sessions of interest are superimposed on top of the visual profiles as small orange dots. A random noise is added to the vertical position of the dots to avoid overplotting. Fig. 4 shows that the distribution of the orange dots is roughly the same as the shaded area of the profiles, which indicates that the sessions of interest are similar to what the users typically do. The slightly deviated session is the session with highest score fromBlack Goliath, which is manually annotated with a blue circle in Fig. 4.
Fig. 4. Visualisation of user profiles. Each row is a visual profile for a user, consisting of visual summary of multiple features. These users belong to the same group,G0, whose profile is placed at the top. Sessions of interest (external input) are shown as orange dots and the slightly deviated one is manually highlighted here with a blue circle.
those sessions besides the meta features. To support that, the selected sessions are also displayed in the Timeline view (described in Sect. 5.2) allowing the examination of the performed actions in temporal order.
4.6 Visualising User Tasks
User tasks, extracted from user actions, reveal theoperational char-acteristic of the user. They reflect what happen in the sessions but with a higher abstraction than individual actions, supporting analysts in gaining an overall understanding. The visualisation of user profiles discussed in Sect. 4.5 shows the distribution of tasks across sessions within a profile. With this view here, we provide a detailed view of tasks and facilitate task comparison.
As discussed earlier in Sect. 4.2, each task is modelled as a proba-bility distribution over all actions. The value indicates the probaproba-bility that an action is used in a particular task. According to the domain experts, tasks are typically completed with a few actions. Therefore, to describe how tasks are commonly performed, we use only the five most probable actions of each task. We also limit the minimum probability to exclude ‘weak’ actions (0.1 or 10% in our dataset).
Fig. 5 visualises the extracted tasks. Each task is shown as a set of equal-sized squares, each for an action, coloured based on the action’s group. Sect. 5.4 will discuss how we derive the grouping and colourmap. The number on the left of each task indicates the task ID, which is consistent with the tasks shown in the User Profiles view, allowing an efficient cross lookup. For instance, the first row in Fig. 5 shows Task 0 consisting of 2 actions in the green group, one action in the purple group and two actions in the yellow group.
The left of the view shows two statistics: the distribution of tasks within aspecific setof sessions of interest (darker bars) and the
dis-Fig. 5. Visualisation of user tasks. Each task is shown as a set of coloured squares, each representing a dominant action in the task. On the left, two task distributions are shown using lighter and darker grey, enabling comparison, e.g., single user vs. all other users in a group.
tribution of tasks in a relevantlarger contextfor comparison (lighter bars). The larger context is dynamic based on the specific input. Some examples of useful comparison are: (1) user groups vs. all users in the dataset, (2) users vs. all users in their group, and (3) sessions vs. all sessions from the same user. The comparison between different levels of details is made possible due to our hierarchical user profile concept. For instance, Fig. 5 shows that Task 10 is more popular than Task 9 (lighter bars) in the entire dataset. But, for this specific group, Task 9 is much more dominant.
5 VASABI: VISUALANALYTICS FOR UNDERSTANDING USER
BEHAVIOUR
This section presents an integration of the three profile-oriented vi-sualisations described earlier into a visual analytics environment for facilitating exploration of user behaviour, and identification and expla-nation of unusual activities.
5.1 Session Overview
For a large dataset, an overview revealing the distribution of data with different perspectives is of importance. This is, howevre, not the main focus of our approach but we still provide such an overview along the
[image:7.612.121.222.565.692.2]temporaldimension. Fig. 1 (middle row) shows a distribution of all ses-sions in the entire dataset over time with a histogram. Moreover, each bar is coloured coded by the mediananomaly scoreof all corresponding sessions within the bar. When a group or user is selected in the User Cluster view, their sessions are highlighted in the histogram (brown colour). Several patterns can be observed in the Session Overview of Fig. 1. First is a typical working hour pattern: there is much less data over the weekends and the peaks are around the middle of working days. A more surprising pattern is the large number of sessions oc-curred at midnight in almost every single day. Notably, on average, those sessions have higher scores than others (darker bars). Sessions of interest can be selected for further exploration in other views. Sect. 5.3 details this linking capability.
5.2 Session Timeline
1.
1
2. 3. 4. 5. 6. 7. 8. 9. 10. 2
3
4 5
6
7 8
9
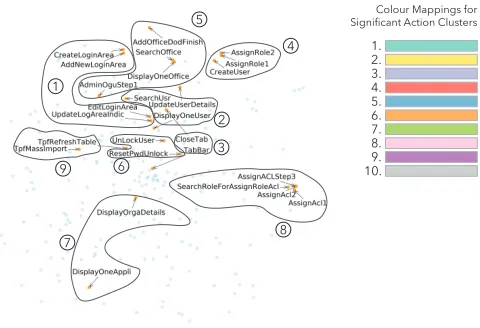
[image:8.612.58.298.51.215.2]Colour Mappings for Significant Action Clusters
Fig. 6. A semi-automated clustering approach is used for the simplifi-cation of the colourmapping. A word2vec representation is fed into the t-SNE algorithm to find a projection of actions where action similarities are preserved (as much as possible) in the resulting 2D space. We then use this embedding and the action labels to manually identify 9 groups and map distinct colours to each. The rest of actions are assign to the same colour (group 10).
5.3 Interaction between Views in VASABI
The five visualisations described earlier (User Groups, User Profiles, User Tasks, Session Overview, and Session Timeline) and an interactive action legend are combined to form a visual analytics system, called VASABI. This section reviews, unifies and highlights the interaction that enables our coordinated views to work together to boost their own capabilities. In short, all views are highly linked together, including the legend. When mouse hovering an action in the Timeline view or a task in the Task view, corresponding actions are highlighted in the legend for efficient lookup.
VASABI supports filtering based on group/user and time. When a group or a user in the User Groups view is selected, correspond-ing sessions are highlighted in the Session Overview. Moreover, the most relevant users (ranked based on the relevance metric described in Sect. 4.4) of the selected group are displayed in the User Profiles view. When a time window is selected from the Session Overview, the filtered sessions are considered of interest and displayed as orange dots on top of the Profile view. These sessions can be selected for further investigation in the Timeline view. Note that, at any time, the tasks from the filtered sessions are shown as dark bars in the Task view for comparison with the task distribution from a larger context (such as users vs. group). In Sect. 6, we demonstrate how these views are used by domain experts to analyse operational datasets.
5.4 Semi-automated Colourmap Generation
This section explains how we group actions and assign a colour to each group. We decide to only colour code the most ‘dominant’ actions in the dataset and assign all other actions to the same colour (grey). Therefore, we select actions that represent user tasks as identified in Sect. 4.2, which lead to a total of 26 unique actions. Taking a text mining approach, we apply the word2vec [29] algorithm to the entire document (i.e., session) collection. As a result, each document is transformed into a high-dimensional vector. These vectors are projected onto a 2D space using the t-SNE algorithm [27] as shown in Fig. 6. Based on this projection and the meaning of action labels, together with a domain expert, we manually cluster these 26 actions into 9 groups. All actions in one group share the same colour, which is chosen from ColorBrewer’s Set 3 of qualitative colours [19]. Our approach combine the strengths of both automated machine learning and valuable domain knowledge to produce a meaningful clustering analysis. This colourmap generation step is completed outside of the VASABI system.
6 EVALUATION
In this section, we first describe the design of our study and follow by discussing our findings.
6.1 Evaluation Design
As part of the user-centred design process, we conducted a user evalua-tion session to understand how our interactive visual hierarchical user profile approach and the resulting VASABI tool help domain experts perform analysis tasks using operational datasets. We recruited two cybersecurity experts who are both working in the organisation that provided the datasets. They are familiar with the data and were involved in one of the design workshops, thus having some prior knowledge of the VASABI tool.
The participants were all introduced to the tool in about 45 minutes. During this time, we walked the experts through the interface and functionality of VASABI. We also explained the technical details in response to questions. The experts were then asked to complete a comprehensive task. The task was to use VASABI to characterise user groups, to identify users of interest and to investigate unusual sessions. We used two comparable datasets that include logs collected from two similar applications. One of the datasets was used to design VASABI as described in Sect. 3 (this was used by Expert 1 –E1). The second dataset has 14,929 sessions with 296 unique actions and performed by 1,422 users (this was used by Expert 2 –E2).
6.2 Evaluation Findings
Overall, the security experts found the VASABI tool useful and easy to use. It helped them perform analysis tasks with operational datasets. The multiple characteristics of user profiles enabled them to build a more comprehensive understanding of user behaviour and made them more confident in their analyses. The experts commented that the tool help them explain cases that would not otherwise be possible and reduce analysis time; therefore, it would be an effective addition to their current toolbox. To substantiate these claims, the following subsections present detailed findings according to the three parts of the task as also aligned with the three goals that VASABI is designed for.
6.2.1 Understanding Groups of Users
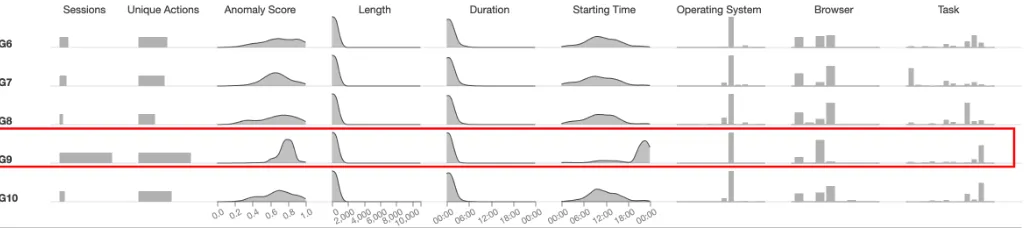
Both experts made use of the User Groups view and the User Profiles view heavily to explore features of the generated group profiles, with slightly different strategies. At start up, the User Profiles view is loaded with profiles of all groups. E1took that advantage and examined all features for each group. He recognised the difference between group
G9and other user groups (Fig. 7). Users inG9perform many more sessions with many more unique actions. They start late, close to mid-night and use Firefox heavily.E1also used the Task view to understand what the tasks are about. He thought all the tasks made sense except for one task that contained trivial actions such asTabBarandCloseTab. For the study withE2, we removed those actions before applying topic modelling. E2used the User Groups view first to understand how different tasks associated with user groups. She then selected each group to examine the features of the group together with features of its most relevant users.
6.2.2 Exploring Users of Interest
We provide examples of interesting users that were found in the study.
Fig. 7. Exploring multiple features of user groups. GroupG9stands out as abnormal: its users perform many sessions with a high number of unique actions. The sessions have high anomaly scores, start late and have different browser distribution compared to other groups.
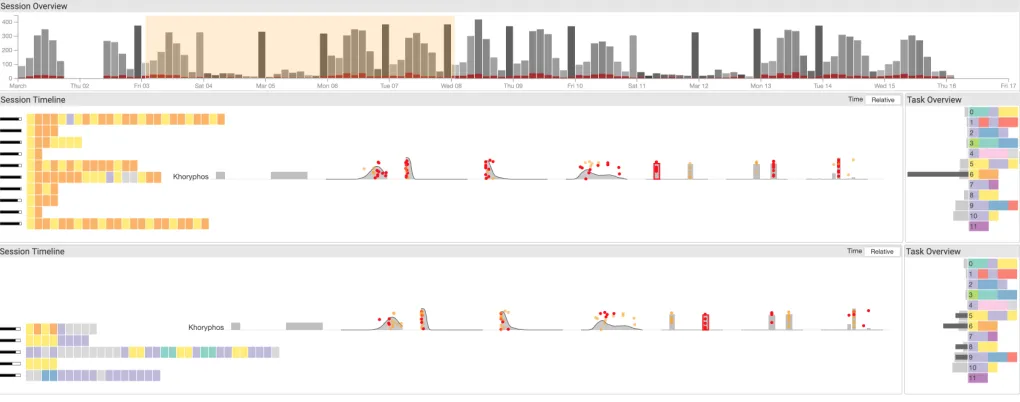
In a second example,E2inspected groupG1because it has the highest number of a task thatE2found interesting:SearchUser, Un-LockUserandResetPwdUnlock. UserKhoryphosappeared to be suspi-cious as it used a large number of unique actions than the group average and had high anomaly scores (Fig. 8). The most interesting observation with this user was the equally frequent use of both the mobile and the desktop version of the application.E2thought that this was unusual.
6.2.3 Investigating Sessions of Interest
We follow up the two suspicious users above to examine their sessions.
E1brushed sessions in different tasks fromDeadpoolto explore (Fig. 1 – Session Timeline). These sessions are short and succinct but cover many different unique actions. This raised suspicion that this might be a scripted event.E1guessed that this might be ashared accountthat is shared between several users and likely to be used within scripted activities to perform certain regular tasks. Such activities are against the policy and can be labelled for further investigation.
E2selected a one-week window and explore the sessions. As men-tioned earlier, Khoryphos used two different operating systems (OS) andE2investigated this aspect further. She clicked on each OS bar to select sessions only from a specific OS. Fig. 9 composes sessions from these two sets together for easy comparison. It is clear that in the first OS, Khoryphos only performed one single task – unlocking users. However, with the second OS, Khoryphos performed many different tasks (evidenced in both the Task Overview and the Task barchart).E2
confirmed that this user may violate working policy.
6.3 Key take-aways
Here we list a number of key take-aways from the observations made: • Evaluating sessions in multiple levels is a critical activity. Assess-ing a particular action is only possible when evaluated within the context of the user and the user’s potential roles and groups. • Meta-data is critical in making the decisions as they are well
known to the domain experts and should be treated as first-class information in the visual profiles, hence our emphasis on the meta-data in our visual representation.
• The derived tasks (extracted using an ensemble LDA based ap-proach [7]) are critical in informing decisions. However, we observed reservation towards some of the derived tasks which could hinder trust and adoption. Analyst driven, semi-manual task derivation approaches could be applied to enhance familiarity and robustness, which in turn faciliates the adoption of the approach. • The chosen representative users for groups are key influencers in the interactive analysis of groups. Alternative ways of choosing representative users need to be considered and consulted with experts to best fit the particularities of the domain.
7 DISCUSSION
7.1 User Profiles
The feature list we identified is suitable for our dataset but is not exhaustive. Currently, the features are hard-coded in the tool. Different analysts may have different strategies in assessing relevant features,
so they may want to adjust them. To make the tool easily transferable to other datasets, the features should be configurable in the interface. More conveniently, the tool should provide a simple way to define a new metric.
We currently leave out an important feature: IP address. In the User Profiles view, it is not ideal to visualise IP address as a categorical attribute like browser and operating system because of two issues. First is the number of different IPs that a group of users use can be high. Second is the fact that IPs have subnet relationship and geolocation. Therefore, having a compact visualisation of IPs that can be fit into the User Profiles view is an interesting challenge. We experimented with the use of Hilbert curves to visualise IP address and apply interaction to drill down the space (see supplementary material for details). However, for a small display estate in our case, it does not work perfectly yet. Another idea is to group IP addresses, for instance, by country.
The User Profiles view is currently able to show 10 – 20 profiles. To complement this scalability issue, more interesting profiles are shown at the top based on arelevancemetric. Currently we use a simple metric to estimate the relevance of users for ranking sessions. This approach might not be able to pick up subtle signals such as in a hijack cases, i.e., cases where user sessions normally have low scores with high scores in just a few sessions. Exploring different metrics such as variance of scores could be useful here. It would also be useful to provide additional sorting options such as by feature values (e.g., decreasing average anomaly score). Filtering profiles based on numerical ranges or categories of features is likely to make searching for relevant profiles more efficient.
7.2 Task Extraction with Topic Modelling
The current use of topic modelling to extract tasks does not consider the session lengths well. For long sessions, there could be more than three tasks taking place concurrently, exceeding our chosen threshold. One approach is to segment the sessions and consider each segment as a document. This would also help reduce noise between tasks.
Fig. 8. Exploring users of interest. UserKhoryphosappears to be abnormal with high anomaly scores and using both mobile and desktop operating systems equally frequently.
Fig. 9. Exploring sessions of interest. Selecting sessions from two different operating systems for investigation. There are clear differenences between the two.Note:This figure is composed from two screenshots to save space.
7.3 Generalizability
Here, we discuss the transferability of our approach to different appli-cation domain. Our approach is best fitted to context with the requires three key characteristics:
1. The lowest level activity in the data should have sufficient se-mantics to make sense individually; for example,actionssuch asDisplayUserDetailsandUnlockUser. Based on the four-layer model of activities [16, 41], we target theactionlayer, which has higher semantics than bottom-level events (e.g., keystrokes, mouse clicks) and lower semantics than sub-tasks and tasks. Therefore, our approach can be applied to datasets at the same application level but are unsuitable for datasets at the level of system events.
2. The data needs to be split intosegments– a meaningful unit of data separation, e.g.,sessionin our dataset. This implies that a continuous stream of events without any meaningful split is not applicable to our approach.
3. Each segment should be associated with anactor, which is auser
in our case. This allows us to build theuser profileconcept based on a set of segments associated with them.
We argue that the above characteristics are significantly common, for instance, electronic health records [33] where “actions” are any event such as drug prescriptions with patients considered as “users” and “visits” as sessions, or logs from evaluation studies of user interfaces as is common in visualisation research [13]. These widely applicable no-tions of “user”, “session” and “action” make our approach transferrable to other problem and application domains.
8 CONCLUSION
In this paper, we investigate how a visual analytics approach can pro-vide a comprehensive, multifaceted understanding of user behaviour to
facilitate effective decision making in UBA-enabled cybersecurity sys-tems. As a team of cybersecurity experts and visualisation researchers, we present an abstraction of the goals and the tasks involved in such systems, and describe our designs to build an interactive visual hierar-chical user profile. We developed a topic modelling based approach to extract latent features that describe the tasks carried out by the users of the system and made the results of this algorithm a part of the vi-sual analysis process. We performed a text-based clustering using the extracted tasks to group users based on their similar roles. These two techniques played important roles in building hierarchical user profiles, which are then visualised interactively in VASABI. The evaluation with two cybersecurity experts demonstrated how well the analytical tasks can be carried out through our visual analytics framework. The experts were able to use VASABI to characterise user groups, to identify users of interest and to investigate suspicious sessions in detail. We argue that visual analytics has significant potential in supporting analysts with such complex behaviour inferring tasks. With the increasing popularity of UBA models as inherent parts of any modern cybersecurity systems, visualisation and visual analytics methods are also likely to become indispensable components in these solutions. To achieve this, however, further research and development is needed for solutions that can work in various decision making scenarios.
ACKNOWLEDGMENTS
This work is supported by the European Commission through the H2020 programme under grant agreement 700692 (DiSIEM). We also would like to thank Zayani Dabbabi and Miruna-Mihaela Mironescu for their help in the evaluation of VASABI.
REFERENCES
[image:10.612.56.566.175.376.2]International Conference on World Wide Web, WWW ’07, pp. 161–170. ACM, New York, NY, USA, 2007. doi: 10.1145/1242572.1242595 [2] R. Agrawal, R. Srikant, et al. Fast algorithms for mining association
rules. InProc. 20th int. conf. very large data bases, VLDB, vol. 1215, pp. 487–499, 1994.
[3] P. Berkhin. A survey of clustering data mining techniques. InGrouping multidimensional data, pp. 25–71. Springer, 2006.
[4] D. M. Blei, A. Y. Ng, and M. I. Jordan. Latent dirichlet allocation.Journal of machine Learning research, 3(Jan):993–1022, 2003.
[5] I. Cadez, D. Heckerman, C. Meek, P. Smyth, and S. White. Visualization of navigation patterns on a web site using model-based clustering. Citeseer, 2000.
[6] J. Care and T. Phillips. Market guide for online fraud detection. https://www.gartner.com/doc/3849295/ market-guide-online-fraud-detection, January 2018. (Ac-cessed on 07/21/2018).
[7] S. Chen, N. Andrienko, G. Andrienko, L. Adilova, J. Barlet, J. Kinder-mann, P. H. Nguyen, O. Thonnard, and C. Turkay. Lda ensembles for interactive exploration and categorization of behaviors.IEEE transactions on visualization and computer graphics, 2019.
[8] S. Chen, S. Chen, N. Andrienko, G. Andrienko, P. H. Nguyen, C. Turkay, O. Thonnard, and X. Yuan. User behavior map: Visual exploration for cyber security session data. In2018 IEEE Symposium on Visualization for Cyber Security (VizSec), pp. 1–4, Oct 2018. doi: 10.1109/VIZSEC.2018. 8709223
[9] S. Chen, C. Guo, X. Yuan, F. Merkle, H. Schaefer, and T. Ertl. Oceans: Online collaborative explorative analysis on network security. In Proceed-ings of the Eleventh Workshop on Visualization for Cyber Security, VizSec ’14, pp. 1–8. ACM, New York, NY, USA, 2014. doi: 10.1145/2671491. 2671493
[10] Y. Chen, P. Xu, and L. Ren. Sequence synopsis: Optimize visual summary of temporal event data.IEEE transactions on visualization and computer graphics, 24(1):45–55, 2018.
[11] J. B. Colombe and G. Stephens. Statistical profiling and visualization for detection of malicious insider attacks on computer networks. In Proceed-ings of the 2004 ACM Workshop on Visualization and Data Mining for Computer Security, VizSEC/DMSEC ’04, pp. 138–142. ACM, New York, NY, USA, 2004. doi: 10.1145/1029208.1029231
[12] H. Dev and Z. Liu. Identifying frequent user tasks from application logs. InInternational Conference on Intelligent User Interfaces, pp. 263–273. ACM, 2017.
[13] W. Dou, D. H. Jeong, F. Stukes, W. Ribarsky, H. R. Lipford, and R. Chang. Recovering reasoning processes from user interactions.IEEE Computer Graphics and Applications, 29(3):52–61, 2009.
[14] W. DuMouchel. Computer intrusion detection based on bayes factors for comparing command transition probabilities. National Institute of Statistical Sciences Tech. Report, 91, 1999.
[15] D. Gotz and Z. Wen. Behavior-driven visualization recommendation. In
International conference on Intelligent user interfaces, pp. 315–324. ACM, 2009.
[16] D. Gotz and M. X. Zhou. Characterizing users’ visual analytic activity for insight provenance.Information Visualization, 8(1):42–55, 2009. [17] C. C. Gray, P. D. Ritsos, and J. C. Roberts. Contextual network navigation
to provide situational awareness for network administrators. In2015 IEEE Symposium on Visualization for Cyber Security (VizSec), pp. 1–8, Oct 2015. doi: 10.1109/VIZSEC.2015.7312769
[18] T. L. Griffiths, M. I. Jordan, J. B. Tenenbaum, and D. M. Blei. Hierarchical topic models and the nested chinese restaurant process. InAdvances in neural information processing systems, pp. 17–24, 2004.
[19] M. Harrower and C. A. Brewer. Colorbrewer. org: an online tool for selecting colour schemes for maps.The Cartographic Journal, 40(1):27– 37, 2003.
[20] W.-H. Ju and Y. Vardi. A hybrid high-order markov chain model for computer intrusion detection.Journal of Computational and Graphical Statistics, 10(2):277–295, 2001.
[21] T. M. Kodinariya and P. R. Makwana. Review on determining number of cluster in k-means clustering.International Journal, 1(6):90–95, 2013. [22] T. Lane, C. E. Brodley, et al. Sequence matching and learning in anomaly
detection for computer security. InAAAI Workshop: AI Approaches to Fraud Detection and Risk Management, pp. 43–49, 1997.
[23] P. A. Legg. Visualizing the insider threat: challenges and tools for identi-fying malicious user activity. In2015 IEEE Symposium on Visualization for Cyber Security (VizSec), pp. 1–7, Oct 2015.
[24] W. Li, G. Cao, T. Qin, and P. Cao. A hierarchical method for user’s behavior characteristics visualization and special user identification. In
2013 19th IEEE International Conference on Networks (ICON), pp. 1–5. IEEE, 2013.
[25] L. Liu, O. De Vel, Q.-L. Han, J. Zhang, and Y. Xiang. Detecting and preventing cyber insider threats: A survey.IEEE Communications Surveys & Tutorials, 20(2):1397–1417, 2018.
[26] Z. Liu, Y. Wang, M. Dontcheva, M. Hoffman, S. Walker, and A. Wil-son. Patterns and sequences: Interactive exploration of clickstreams to understand common visitor paths. IEEE Transactions on Visualization and Computer Graphics, 23(1):321–330, 2017.
[27] L. v. d. Maaten and G. Hinton. Visualizing data using t-sne. Journal of machine learning research, 9(Nov):2579–2605, 2008.
[28] J. MacQueen et al. Some methods for classification and analysis of multivariate observations. InProceedings of the fifth Berkeley symposium on mathematical statistics and probability, vol. 1, pp. 281–297. Oakland, CA, USA, 1967.
[29] T. Mikolov, I. Sutskever, K. Chen, G. S. Corrado, and J. Dean. Dis-tributed representations of words and phrases and their compositionality. InAdvances in neural information processing systems, pp. 3111–3119, 2013.
[30] P. H. Nguyen, C. Turkay, G. Andrienko, N. Andrienko, and O. Thonnard. A Visual Analytics Approach for User Behaviour Understanding through Action Sequence Analysis. InEuroVis Workshop on Visual Analytics. The Eurographics Association, 2017.
[31] P. H. Nguyen, C. Turkay, G. Andrienko, N. Andrienko, O. Thonnard, and J. Zouaoui. Understanding user behaviour through action sequences: from the usual to the unusual.IEEE Transactions on Visualization and Computer Graphics, 2018.
[32] A. Perer and F. Wang. Frequence: Interactive mining and visualization of temporal frequent event sequences. InInternational conference on Intelligent User Interfaces, pp. 153–162. ACM, 2014.
[33] A. Rind, T. D. Wang, W. Aigner, S. Miksch, K. Wongsuphasawat, C. Plaisant, B. Shneiderman, et al. Interactive information visualiza-tion to explore and query electronic health records. Foundations and Trends® in Human–Computer Interaction, 5(3):207–298, 2013. [34] J. Rzeszotarski and A. Kittur. Crowdscape: Interactively visualizing user
behavior and output. InProceedings of the 25th Annual ACM Symposium on User Interface Software and Technology, UIST ’12, pp. 55–62. ACM, New York, NY, USA, 2012. doi: 10.1145/2380116.2380125
[35] M. B. Salem, S. Hershkop, and S. J. Stolfo. A survey of insider attack detection research. InInsider Attack and Cyber Security, pp. 69–90. Springer, 2008.
[36] R. Shi, M. Yang, Y. Zhao, F. Zhou, W. Huang, and S. Zhang. A matrix-based visualization system for network traffic forensics. IEEE Systems Journal, 10(4):1350–1360, Dec 2016. doi: 10.1109/JSYST.2014.2358997 [37] H. Shiravi, A. Shiravi, and A. A. Ghorbani. A survey of visualization systems for network security. IEEE Transactions on Visualization and Computer Graphics, 18(8):1313–1329, Aug. 2012. doi: 10.1109/TVCG. 2011.144
[38] B. W. Silverman. Density estimation for statistics and data analysis. Routledge, 2018.
[39] R. Srikant and R. Agrawal. Mining sequential patterns: Generalizations and performance improvements. InInternational Conference on Extending Database Technology, pp. 1–17. Springer, 1996.
[40] G. Wang, X. Zhang, S. Tang, H. Zheng, and B. Y. Zhao. Unsupervised clickstream clustering for user behavior analysis. InProceedings of the 2016 CHI Conference on Human Factors in Computing Systems, CHI ’16, pp. 225–236. ACM, New York, NY, USA, 2016. doi: 10.1145/2858036. 2858107
[41] K. Xu, S. Attfield, T. Jankun-Kelly, A. Wheat, P. H. Nguyen, and N. Sel-varaj. Analytic provenance for sensemaking: A research agenda.IEEE Computer Graphics and Applications, 35(3):56–64, 2015.