City, University of London Institutional Repository
Citation
:
Tibber, M. S., Kirkbride, J. B., Joyce, E. M., Mutsatsa, S., Harrison, I., Barnes, T.
R. E. and Huddy, V. (2018). The component structure of the scales for the assessment of
positive and negative symptoms in first-episode psychosis and its dependence on variations
in analytic methods. Psychiatry Research, 270, pp. 869-879. doi:
10.1016/j.psychres.2018.10.046
This is the published version of the paper.
This version of the publication may differ from the final published
version.
Permanent repository link:
http://openaccess.city.ac.uk/21036/
Link to published version
:
http://dx.doi.org/10.1016/j.psychres.2018.10.046
Copyright and reuse:
City Research Online aims to make research
outputs of City, University of London available to a wider audience.
Copyright and Moral Rights remain with the author(s) and/or copyright
holders. URLs from City Research Online may be freely distributed and
linked to.
Contents lists available atScienceDirect
Psychiatry Research
journal homepage:www.elsevier.com/locate/psychres
The component structure of the scales for the assessment of positive and
negative symptoms in
fi
rst-episode psychosis and its dependence on
variations in analytic methods
Marc S. Tibber
a, James B. Kirkbride
b, Eileen M. Joyce
c, Stanley Mutsatsa
d, Isobel Harrison
b,
Thomas R.E. Barnes
e, Vyv Huddy
f,⁎aDepartment of Clinical, Educational and Health Psychology, UCL, London, UK bDivision of Psychiatry, UCL, London, UK
cUCL Institute of Neurology, London, UK
dSchool of Health Sciences, City University, London, UK eCentre for Psychiatry, Imperial College London, UK
fClinical Psychology Unit, Department of Psychology, University of Sheffield, UK
A R T I C L E I N F O
Keywords: Psychosis Positive symptoms Negative symptoms Disorganisation symptoms Factor analysis Factor structure
A B S T R A C T
A secondary analysis was undertaken on Scales for the Assessment of Positive and Negative Symptoms (SAPS/ SANS) data from 345first-episode psychosis (FEP) patients gathered in the West London FEP study. The purpose of this study was to determine: (i) the component structure of these measures in FEP (primary analyses), and (ii) the dependence of anyfindings in these primary analyses on variations in analytic methods. Symptom ratings were exposed to data reduction methods and the effects of the following manipulations ascertained: (i) level of analysis (individual symptom vs. global symptom severity ratings), (ii) extraction method (principal component vs. exploratory factor analysis) and (iii) retention method (scree test vs. Kaiser criterion). Whilst global ratings level analysis rendered the classic triad of psychotic syndromes (positive, negative and disorganisation), symptom level analyses revealed a hierarchical structure, with 11first-order components subsumed by three second-order components, which also mapped on to this syndrome triad. These results were robust across data reduction butnotcomponent retention methods, suggesting that discrepancies in the literature regarding the component structure of the SAPS/SANS partly reflect the level of analysis and component retention method used. Further, they support a hierarchical symptom model, the implications of which are discussed.
1. Introduction
Psychotic disorders represent a broad family of psychological
con-ditions that are characterised by cognitive, affective, perceptual,
be-havioural, and social symptoms (American Psychiatric Association,
2013; World Health Organisation, 1992). Whilst the psychoses have traditionally been described using a categorical approach based on
di-agnostic criteria (Parker, 2014; World Health Organization, 1992), a
number of authors have argued that psychotic disorders in fact
re-present a heterogeneous collection of phenomena (Allardyce et al.,
2007a; Bentall, 2004), with diagnostic categories demonstrating poor
validity, reliability and aetiological specificity. As an alternative
di-mensional based classification systems posit that psychosis may be
better formulated with respect to multiple, continuous symptom
dimensions (Allardyce et al., 2007b; Van Os, 2015). This is a view that
has permeated both research and clinical practice. For example, the latest version of the Diagnostic and Statistical Manual of Mental
Dis-orders (DSM-5) (American Psychiatric Association, 2013) carries a
rating tool called the Clinician-Rated Dimensions of Psychosis Symptom
Severity (Parker, 2014), and further, no longer includes the traditional
sub-types of schizophrenia (e.g. paranoid, disorganised, catatonic etc.) on the basis that they lack reliability, validity and stability (Nemeroffet al., 2013). A comprehensive understanding of the under-lying structure of psychotic symptoms is therefore critical.
Psychotic symptom dimensions are typically derived using the data reduction methods of exploratory factor analysis (EFA) or principal component analysis (PCA). However, there is great variability in the
number of symptom dimensions identified using these techniques
https://doi.org/10.1016/j.psychres.2018.10.046
Received 14 January 2018; Received in revised form 17 October 2018; Accepted 19 October 2018 ⁎Corresponding author.
E-mail addresses:m.tibber@ucl.ac.uk(M.S. Tibber),j.kirkbride@ucl.ac.uk(J.B. Kirkbride),e.joyce@ucl.ac.uk(E.M. Joyce),
stanley.mutsatsa@city.ac.uk(S. Mutsatsa),isobel.harrison@ucl.ac.uk(I. Harrison),t.r.barnes@imperial.ac.uk(T.R.E. Barnes),v.huddy@sheffield.ac.uk(V. Huddy). Psychiatry Research 270 (2018) 869–879
Available online 30 October 2018
0165-1781/ © 2018 The Authors. Published by Elsevier B.V. This is an open access article under the CC BY license (http://creativecommons.org/licenses/BY/4.0/).
(Peralta and Cuesta, 2001), ranging from an early ten syndrome model (Lorr et al., 1963) to later proposals of a core triad of syndromes: reality
distortion or‘positive’symptoms (certain delusions and hallucinations),
psychomotor poverty or‘negative’symptoms (poverty of speech, lack of
spontaneous movement and aspects of blunted affect) and
dis-organisation symptoms (inappropriate affect, poverty of content of
speech and disturbances of the form of thought) (Liddle, 1987; Liddle
and Barnes, 1990). SeeGrube et al. (1998), Peralta et al. (2001)and
Smith et al. (1998) for reviews and indications of the variation in proposed symptom models.
A number of methodological issues that might contribute to this
variability in symptom structure have been suggested (Peralta and
Cuesta, 2001; Toomey et al., 1997) including: the characteristics of the
patient sample, e.g. first-episode or established illness, the choice of
symptom rating tool, the data reduction method, e.g. EFA or PCA, and the method used to determine the number of factors to extract, e.g. scree test or Kaiser criterion (eigenvector > 1) method. The choice of symptom rating tool may be particularly critical, since scales that in-corporate a more comprehensive list of symptoms, such as the Positive
and Negative Syndrome Scale (PANSS: van Erp et al., 2014) often
generate a greater number of symptom dimensions (Peralta and
Cuesta, 2001). For example,five factor models, which commonly in-clude the classic triad of symptoms (positive, negative and dis-organisation) as well as mania (/excitement/activation) and depression
(/emotional distress) are also commonly reported; seeWallwork et al.
(2012), Shafer et al. (2017)andvan der Gaag et al. (2006)for example. Another potential source of variation in the literature is the level of analysis undertaken, i.e. what constitutes the raw material for data reduction: individual symptom scores or scores on symptom sub-scales (or some other composite measure/index). This is particularly relevant for the Scales for the Assessment of Positive and Negative Symptoms
(SAPS and SANS: Andreasen, 1990), which are commonly used for
rating psychotic symptoms. The SAPS and SANS together are comprised
of 49 individual symptom items, e.g. ‘auditory hallucinations’, in
ad-dition to nine sub-scale global symptom severity summary scores, e.g.
‘global rating of hallucinations’. Whilst individual symptom level
ana-lyses of SAPS and SANS ratings typically generate around ten factors (Minas et al., 1994; Peralta and Cuesta, 1999; Toomey et al., 1997; Vazquez-Barquero et al., 1996), global rating level analyses generate far fewer (typically three to four), including positive, negative and
dis-organisation syndromes (Dollfus and Petit, 1995; John et al., 2003;
Klimidis et al., 1993; Liddle, 1987; Peralta and Cuesta, 1999; Toomey et al., 1997). Consequently, existing studies and reviews of the
litera-ture that include data from the SAPS and SANS (Grube et al., 1998;
Smith et al., 1998) may underestimate the number of psychotic symptom dimensions as a result of the predominance of global level
analyses (Stuart et al., 1999).
One study that has the potential to resolve some of this variation in the literature involved a symptom level PCA undertaken on SAPS and
SANS ratings from 660 inpatients with psychotic illness (Peralta and
Cuesta, 1999). This resulted in the extraction of 12 inter-correlated,
first-order components. Critically however, the authors went on to use
thesefirst-order component scores as raw data for a second-order PCA;
this resulted in four second-order components, three of which accu-rately mapped on to the positive, negative and disorganisation
syn-dromes (Liddle, 1987; Liddle and Barnes, 1990). Thesefindings suggest
that psychotic symptoms may be inherently hierarchically structured,
with ten or more symptom clusters (Lorr et al., 1963) defining a handful
of higher-level clusters (or syndromes), including Liddle's classic triad.
Taken together, these findings suggest that discrepancies in the
literature as to the dimensional structure of common psychotic symptom measures may be driven, in part, by variations in analytic
method. Further, they suggest that some of the disparatefindings
re-ported might be integrated into a two-tiered hierarchical model (Peralta and Cuesta, 1999). To test this directly, we undertook a series of symptom level and global rating level analyses of SAPS and SANS
scores infirst-episode psychosis (FEP). Two primary hypotheses were
tested:first, that the derived symptom structure would depend on the
level of analysis undertaken. Specifically, we predicted that whilst a
global ratings level analysis would lead to the extraction of the classic triad of syndromes, symptom level analysis would generate
approxi-mately tenfirst-order components. Second, we predicted, that in
sup-port of Peralta and Cuesta's (1999) hierarchical symptom model, it would be possible to recover the classic triad of syndromes by under-taking a second-order symptom level analysis. Finally, in order to
ex-plore how different statistical approaches may have shaped
dis-crepancies in the literature as to the underlying structure of the SAPS
and SANS, we also explored the dependence of anyfindings on common
variations in method of data reduction or component retention (Peralta
and Cuesta, 2001; Toomey et al., 1997).
2. Methods
2.1. Setting
The data were collected as part of the prospective West London
First-Episode Psychosis study (WLFEP:Barnes et al., 2000; Joyce et al.,
2005). Participants had presented to secondary care services within the
London boroughs of Ealing, Hammersmith and Fulham, Wandsworth, Kingston, Richmond, Merton, Sutton and Hounslow, between 1998 and 2006. Ethical approval was obtained from local ethics committees of all boroughs included and written informed consent was obtained.
2.2. Participants
Patients were deemed eligible for inclusion in the study if they were
resident in London (defined as any borough within the M25), aged 16
years or older, experiencing afirst psychotic episode (affective or
non-affective), had received fewer than 12 weeks of antipsychotic
medica-tion and had sufficient command of the English language to facilitate
assessment. Potential participants were initially screened for a psy-chotic disorder using the World Health Organization Psychosis Screen (Jablensky et al., 1992). Where a psychotic disorder was indeed in-dicated, a full diagnosis was derived using a comprehensive structured interview known as the diagnostic module of the Diagnostic Interview
for Psychosis (Castle et al., 2006), which includes items from the World
Health Organization Schedules for Clinical Assessment in
Neu-ropsychiatry (SCAN;Wing et al., 1990) and the Operational Criteria
Checklist for Psychosis (OPCRIT;McGuffin et al., 1991). Information
derived from this interview was then fed into a computer algorithm (MRC Social Genetic and Dev Psychiatry Centre, n.d.) to generate
di-agnoses according to multiple classification systems including the
Di-agnostic and Statistical Manual of Mental Disorders (3rd ed.; DSM-III; American Psychiatric Association, 1980) and subsequently converted into DSM-IV categories by cross-referencing with DSM-IV criteria (American Psychiatric Association, 1994). These screening and diag-nostic assessment stages were undertaken by two psychiatric research nurses (IH and SM) trained in the administration of relevant tools by a
highly experienced psychiatrist (TB). SeeHuddy et al. (2007)also.
2.3. Data collection
Information was obtained, with informed consent, from
partici-pants’clinical records and clinical interview, as well as interviews with
participants’carers and relatives, where possible. Data gathered at the
time of first presentation to services included basic demographic
2.4. Measures
Psychotic symptoms were assessed using the SAPS and SANS (Andreasen, 1990), which were administered with an inter-rater
relia-bility of ≥0.77 by IH and SM. The SAPS is a 34-item
clinician-ad-ministered questionnaire, which divides symptoms into four sub-scales (hallucinations, delusions, bizarre behaviour and formal thought dis-order), each of which is also given a global symptom severity score by the rater (global ratings). It is therefore comprised of 30 individual symptom ratings and four global ratings. The SANS is a 24-item
clin-ician-administered questionnaire, which divides symptoms into five
sub-scales (affective flattening or blunting, alogia, avolition-apathy,
anhedonia-asociality, attention), also given global ratings. It is
there-fore comprised of 19 individual symptom ratings andfive global
rat-ings. The measures have been validated in recent-onset psychosis (Fulford et al., 2014) and correlate well with other symptom measures,
e.g. the PANSS (r= 0.71–0.84) (van Erp et al., 2014).
2.5. Analyses
All analyses were undertaken using SPSS (version 22; SPSS Inc., Chicago, IL). In order to determine data factorability, data were
as-sessed for sufficient correlation between items, excessively large
inter-item correlations (r> 0.9), sphericity (Bartlett's test) and sampling
adequacy (Kaiser, 1974)/anti-image correlation matrix
diag-onals > 0.5. Any failure to meet these checks are reported in the text. In a global ratings level analysis the nine global ratings of the SAPS and SANS were exposed to a PCA following the methods described by
John et al. (2003). Principal components were extracted if they had an eigenvector value > 1 using a VARIMAX rotation, leading to the ex-traction of orthogonal components.
In a symptom level analysis individual symptom item scores were exposed to a two-step analytic approach following the methods of
Peralta and Cuesta (1999). Thefirst-order PCA wasfirst undertaken on all 49 individual symptom SAPS and SANS scores, followed by a
second-order PCA on the principal component scores extracted from thisfi
rst-order analysis.
For thefirst-order analysis, principal components were extracted if
they had an eigenvector value > 1 using the OBLIMIN oblique rotation, since correlations were expected between symptom dimensions at this
stage of analysis (Peralta et al., 1997). The second-order PCA was
un-dertaken on principal component scores extracted from thefirst-order
analysis using a VARIMAX rotation.
For all analyses undertaken individual items were retained/deemed to belong to an extracted dimension if they exhibited a loading of 0.4 or greater.
In order to assess the dependence of anyfindings on analytic
ap-proach all analyses were run using alternative methods of data re-duction (whilst retaining dimensions using the Kaiser criterion method). Choices as to which methodological variants to include were made on the basis of the most common analyses adopted in the existing literature. This was because our intention was to explore the possible
impact of these on reportedfindings rather than to undertake an
ex-haustive review of all possible statistical approaches. Thus, in addition
to using the Kaiser criterion to define the number of factors to extract
the scree method was also assessed. The effects of running EFA as an
alternative to PCA was also explored. Four different estimation methods
were used with the EFA: principle axis factoring, unweighted least squares, generalised least squares and maximum likelihood.
Finally, since a number of researchers have argued that the
‘Attention’subscale should be excludeda priorifrom the SANS on the
basis that attention is a neurocognitive domain, e.g. Blanchard and
Cohen (2006), the primary PCAs were re-run without these subscale
items. Since these analyses did not generate substantially different
findings these data are presented in Supplementary Tables and
dis-cussed in brief only.
3. Results
3.1. Missing data and sample characteristics
Information as to the number of potential participants that were evaluated, screened and excluded was not routinely recorded throughout the study; consequently, these data are not available. Ultimately however, 345 participants met criteria for inclusion. Of these 345 full symptom data-sets (complete SAPS/SANS scores) were available for 335 cases; this formed the basis of all PCAs and EFAs re-ported (complete case analyses). Several additional variables are also reported for the patient sample, e.g. Age of Onset and Duration of
Untreated Psychosis (Table 1). Whilst a number of individual cases
were missing for these additional variables, with the exception of IQ (see below), this loss represented a small proportion of the total number of cases (< 3%).
Participant characteristics are presented inTable 1, including the
duration of untreated psychosis (DUP), calculated using the
Not-tingham Onset Scale (NOS) (Singh et al., 2005), socioeconomic status,
defined on the basis of participant occupation using the National
Sta-tistics Socio-Economic Classification system (NS-SEC) (Rose and
Pevalin, 2005) and premorbid IQ, assessed using the National Adult
Reading Test (NART) (Lezak, 2004; Nelson and Wilson, 1991). The
median age at assessment was 24.07 years with an inter-quartile range
(IQR) of 20–30.13, the median age at onset was 23 years
(IQR = 19–28), and the median DUP was 12 weeks (IQR = 4–45). With
respect to socioeconomic status the vast majority of participants were unemployed (189 of 332 participants for whom these data were available). The majority of participants were recorded as having a
di-agnosis of non-affective psychosis (255 of 329 participants for whom
these data were available) as opposed to an affective psychosis
[image:4.595.308.558.155.393.2](n= 74). With respect to symptom severity, the median SAPS total
Table 1
Demographic and clinical characteristics of the study sample. Statistics pro-vided include the number of cases (N), the median and the inter-quartile range (IQR). Data are provided for the complete-case analysis data-set, i.e. partici-pants for whom full symptom data were available (N= 335). Missing data (n/ %) indicate the number and percentage of cases missing relative to this data-set. DUP = duration of untreated psychosis; NS-SEC = National Statistics Socio-Economic Classification system; SAPS = Scales for the Assessment of Positive symptoms; SANS = Scales for the Assessment of Negative symptoms; NART = National Adult Reading Test.
Variable Level N Missing
(n/%)
Median IQR
Age at Assessment (years)
– 334 1 (0.29%) 24.07 20–30.13
Age at Onset (years) – 326 9 (2.69%) 23 19–28
DUP (weeks) – 330 5 (1.49%) 12 4–45
Gender All 333 2 (0.6%) – –
Male 218 – – –
Female 115 – – –
NS-SEC All 332 3 (0.9%) – –
Managerial and professional
18 – – –
Intermediate occupations
22 – – –
Routine and manual
51 – – –
Student 52 – – –
Unemployed 189 – – –
Diagnosis All 329 6 (1.79%) – –
Affective 74 – – – Non-affective 255 – – –
SAPS total – 335 0 (0%) 32 23–45
SANS total – 335 0 (0%) 18 7–34
NART – 267 68
(20.3%)
score was 32 (IQR = 23–45) and the median SANS total score was 18
(IQR = 7–34). Finally, the median IQ score was 97 (IQR = 87–107),
although these data were only available for a small section of the
sample (n= 267); nonetheless, these data are presented to facilitate
comparison with previous published studies.
3.2. Global ratings level analysis
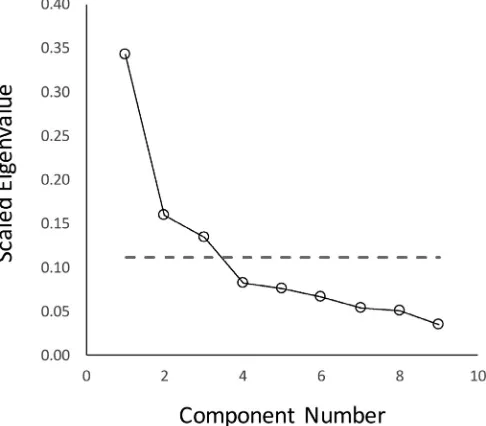
PCA of SAPS and SANS global ratings resulted in the extraction of three components with eigenvectors > 1; these explained 63.7% of the
variance. Examination of the associated scree plot (seeFig. 1) indicated
that if the scree test were used to determine the number of factors
(instead of the Kaiser criterion method) thefindings would be identical.
[image:5.595.43.286.58.271.2]Extracted components mapped on to the classic triad of symptoms.
Table 2 shows the component loadings. (See supplementary Table 1
also for the component score coefficient matrix). Thefirst component
(negative symptoms), which explained 34.3% of the variance in the
data was comprised of loadings from affectiveflattening, alogia,
avo-lition/apathy, anhedonia/asociality and attention. The second compo-nent (disorganisation symptoms), which explained 16% of the variance in the data, was comprised of loadings from delusions, bizarre beha-viour and positive formal thought disorder. Finally, the third compo-nent (positive symptoms), which explained 13.5% of the variance in the data, was comprised of loadings from hallucinations and delusions.
Highly similar results were obtained using EFA instead of PCA, ir-respective of which extraction method was used, i.e. principle axis factoring, unweighted least squares, generalised least squares or
max-imum likelihood (seeTable 2). The primary difference was that
load-ings were consistently lower for the EFAs than for PCA, a consequence of which is that several items just failed to reach the threshold for in-clusion on some components, e.g. delusions on the disorganisation symptoms component (seen across all EFAs), and hallucinations on the positive symptoms component (seen in the maximum likelihood method only).
3.3. First-order symptom level analysis
Next, a PCA was undertaken on SAPS and SANS individual item scores. Three of the values on the diagonals of the anti-image Fig. 1.Scree plot for components identified in the global ratings level principal component analysis. Component numbers are plotted against the scaled ei-genvalues for each eigenvector (eigenvalue divided by the total number of components). The dotted line represents the eigenvector > 1 line (i.e. 1 divided by the total number of components).
[image:5.595.336.458.69.746.2]correlation matrix were < 0.5, indicating items that did not share
suf-ficient variance with other items to warrant inclusion. Consequently,
these three items (persecutory delusions, delusions of sin or guilt and somatic delusions) were excluded and the analysis was rerun without them, i.e. using 46 of the full 49 individual symptom ratings.
Thefirst-order symptom level PCA resulted in the extraction of 11
components with eigenvectors > 1, which together explained 63.2% of the variance in the data. In contrast, it was not clear how many com-ponents should be extracted on the basis of the scree test since there
was no clearly defined inflection point (seeFig. 2), and arguably, two
inflection points: one that would lead to the extraction of∼four orfive
components, and one that would lead to ∼11 or 12. Thus, the two
methods of component retention produce highly divergent results in
this example, since retention of thefirst four orfive components would
exclude most of the positive symptoms of psychosis (most of the hal-lucinations and delusions for example).
Table 3shows the associated PCA structure with variable loadings. The 11 components extracted were named: (i) negative symptoms, (ii) thought disorder, (iii) delusions, (iv) social dysfunction, (v) bizarre behaviour, (vi) auditory hallucinations, (vii) grandiose and religious delusions, (viii) other hallucinations (ix) delusions of jealousy (com-prised of a single item only), (x) alogia and inattentiveness, and (xi) other bizarre behaviour.
Additional analyses were undertaken to determine the effects of
using EFA as opposed to PCA (SupplementaryTables 2–5). Since the
models would not converge (within 9999 iterations) using oblique ro-tation methods (OBLIMIN or PROMAX), an orthogonal roro-tation
(VAR-IMAX) was used instead. This was not planned fora priori, and it is not
clear why convergence did not occur: communalities were all < 1, ruling out the possibility of a Heywood Case, and all tests of data fac-torability were passed.
The main findings were highly robust, particularly for the lower
numbered components with multiple loadings, which showed high
consistency across EFA methods and only minor differences in their
ordering. For example, negative symptoms, thought disorder, social
dysfunction and delusions consistently emerged as thefirst four
com-ponents, with negative symptoms consistently thefirst to be extracted,
thought disorder consistently the second, and social dysfunction and delusions variably extracted third and fourth, or fourth and third,
respectively. Other minor differences were due to individual items
failing to cross the > 0.4 inclusion threshold, as well as the relative instability of components with few item loadings.
Finally, see Supplementary Table 6 for details on the effects of
re-running thefirst-order PCA without items relating to the Attention
subscale. Eleven components were again extracted, which together
explained 63.9% of the variance. These were sufficiently similar in their
pattern of item loadings that thefirst nine components extracted were
labelled identically to the basic PCA (see Supplementary Table 7 also). Components ten and 11 also showed similarities across analyses, but were reversed in their relative ordering. Fundamentally therefore, re-moval of items relating to attention had very little impact on the pattern
offindings.
3.4. Second-order symptom level analysis
Next a second-order PCA was undertaken on the component scores
to have emerged from thefirst-order symptom level analysis. Three
components were extracted with eigenvectors > 1, explaining 41.5% of
the variance. Examination of the associated scree plot (Fig. 3), indicated
that use of the scree test resulted in identicalfindings.
Table 4(columns 1–4) shows the associated PCA structure with
variable loadings. The first component (negative symptoms), which
explained 16.4% of the variance, showed loadings from the negative symptoms, social dysfunction and alogia and inattentiveness
compo-nents derived from thefirst-order PCA. The second component (positive
symptoms), which explained 13.3% of the variance, showed loadings from delusions, auditory hallucinations and other hallucinations. The third component (disorganisation symptoms), which explained 11.7% of the variance, showed loadings from thought disorder, bizarre beha-viour, grandiose and religious delusions and other bizarre behaviours.
Use of EFA instead of PCA (Table 4columns 5–16) resulted in three
highly similar factors that could also be labelled negative, positive and
disorganisation symptoms. The main differences between the PCA and
EFAs was that in the latter, the positive symptoms factor did not include a loading from other hallucinations and the negative symptoms factor did not include a loading from social dysfunction; this was consistent across factor analytic methods used. Further, in the EFAs the dis-organisation symptom factor was uniquely associated with symptoms of
thought disorder, i.e. there were no significant loadings from bizarre
behaviour and grandiose/religious delusions.
Finally, see Supplementary Table 7 for details on the effects of
re-running the second-order PCA using the output of thefirst-order
ana-lysis which did not include items relating to the Attention subscale.
Once again, thefindings were very similar to those reported when items
relating to attention were retained. Three components were again ex-tracted, which together explained 40.9% of the variance. These were labelled negative, positive and disorganisation components, and ex-hibited a near identical pattern of item loadings to the basic PCA.
4. Discussion
Consistent with hypothesis one (dependence on level of analysis), the data suggest that whilst symptom level analysis of the SAPS and
SANS results in ten + inter-correlatedfirst-order components, global
ratings level analysis results in a three component solution
(Toomey et al., 1997). Thefindings also support the robustness of the
triadic syndrome model (Grube et al., 1998; Smith et al., 1998). Thus,
positive, negative and disorganisation symptom dimensions emerged from analyses of SAPS and SANS global ratings as well as second-order analyses of individual item ratings, irrespective of data reduction and component retention method.
Consistent with hypothesis two (hierarchical symptom structure)
the findings also support a complex hierarchical structure to the
symptom data, with the aforementioned 10 +first-order factors being
[image:6.595.43.288.53.272.2]subsumed by three-to-four second-order factors (Peralta and
Cuesta, 1999). Infact, thefindings are remarkably similar to those
re-ported byPeralta and Cuesta (1999); this, despite a considerable
dif-ference in population sample (first-episode versus multi-episode
psy-chosis), a fact that points to the robustness of thefindings/symptom
structure revealed. Thus, whilstPeralta and Cuesta (1999)reported 12
first-order components, which explained 66% of the variance, we report
11first-order components, which explain 63%, thefirst four of which
were nearly identical across studies. The two sets of studies also
ren-dered highly similar, second-order components, with Peralta and
Cuesta (1999)reporting four second-order dimensions, which explained 54% of the variance, where we report three, which together explained
41%. Whilst thefirst three components mapped on to the classic triad of
syndromes (positive, negative and disorganisation), the fourth
compo-nent identified byPeralta and Cuesta (1999)was comprised of a single
loading only (‘other delusions’).
Whilst a minority of thefirst-order components identified could be
mapped almost directly onto SAPS and SANS global rating sub-scales,
e.g. component two (thought disorder), other components identified
either split or cut across categories with loadings from across multiple sub-scales, e.g. component six (auditory hallucinations), which
included items from the hallucinations sub-scale (including auditory hallucinations) as well as the delusions subscale (thought broad-casting). This lack of direct correspondence is perhaps not surprising given that the nine global rating sub-scales of the SAPS/SANS were in fact generated on the basis of clinical opinion and subjective experience (Andreasen, 1990; Andreasen and Olsen, 1982). This questions the validity of the SAPS and SANS sub-scales and has led some to call for
their re-structuring along more empirically-defined lines (de Leon et al.,
1993; Keefe et al., 1992; Vazquez-Barquero et al., 1996).
4.1. Dependence on component number estimation method
Whilst the same core symptom structure was revealed across ana-lyses the choice of component retention method did have some impact
onfindings (scree test versus Kaiser criterion method). Whilst the two
techniques rendered identical results for the global ratings and
second-order symptom level analyses,findings for thefirst-order symptom level
analysis were less stable. The scree test did not yield a definitive
number of components: inflection points were multiple and ambiguous;
[image:7.595.44.556.88.516.2]seeLedesma (2007)andZwick and Velicer (1986)for discussion. One Table 3
Component loadings (structure) matrix for all 46 items included in thefirst-order principal component analysis. Loadings > 0.4 in magnitude are shown in bold. Note: three items of the original 49 were excluded as they did not meet assumptions of the analysis.
F1 F2 F3 F4 F5 F6 F7 F8 F9 F10 F11
% variance explained 19.4 9.4 9.1 5 3.8 3.4 3 2.8 2.5 2.4 2.3
Hallucinations SAPS-H1 Auditory 0.03 −0.08 0.29 −0.10 −0.09 −0.81 0.04 0.23 −0.09 0.04 0.10
SAPS-H2 Voices commenting 0.07 −0.01 0.29 −0.15 −0.04 −0.84 0.01 0.23 0.08 0.01 −0.03 SAPS-H3 Voices conversing 0.08 −0.03 0.27 −0.09 −0.09 −0.82 −0.09 0.14 0.06 0.05 −0.02 SAPS-H4 Somatic or tactile −0.12 −0.02 0.17 −0.03 −0.36 −0.38 −0.25 0.45 0.11 0.07 −0.08
SAPS-H5 Olfactory −0.02 0.02 0.30 −0.06 0.03 −0.14 −0.03 0.72 0.11 0.01 0.00
SAPS-H6 Visual 0.01 0.03 0.14 −0.01 −0.08 −0.28 −0.04 0.75 0.03 −0.02 0.00
Delusions SAPS-D2 Jealous −0.02 −0.05 0.14 0.01 0.06 −0.04 0.03 0.12 0.77 −0.01 −0.06
SAPS-D4 Grandiose −0.15 0.21 0.10 0.12 0.30 0.01 −0.69 0.01 0.07 −0.06 −0.08
SAPS-D5 Religious −0.07 0.03 0.14 0.09 −0.09 −0.01 −0.79 0.05 −0.09 −0.04 −0.03
SAPS-D7 Of reference 0.00 0.02 0.45 −0.14 −0.10 −0.25 −0.25 −0.05 0.33 0.13 0.34 SAPS-D8 Of being controlled 0.04 0.07 0.65 −0.11 −0.25 −0.22 −0.32 0.21 0.05 0.15 0.03 SAPS-D9 Of mind reading 0.05 0.11 0.69 −0.05 −0.11 −0.17 −0.13 0.10 0.25 0.11 0.08 SAPS-D10 Thought broadcasting 0.05 0.07 0.72 −0.05 0.03 −0.43 −0.09 0.22 0.13 0.19 −0.01 SAPS-D11 Thought insertion 0.10 −0.04 0.72 −0.03 −0.07 −0.32 −0.09 0.20 0.00 0.05 −0.10 SAPS-D12 Thought withdrawal 0.13 0.12 0.76 −0.08 −0.01 −0.20 −0.01 0.28 0.01 −0.03 −0.06 Bizarre behaviour SAPS-B1 Appearance −0.09 0.11 −0.14 0.05 0.33 −0.09 −0.34 −0.07 0.05 −0.06 −0.59
SAPS-B2 Social/sexual 0.05 0.19 0.00 0.03 0.51 0.10 −0.42 0.16 0.03 0.08 −0.18
SAPS-B3 Aggressive/agitated −0.02 0.01 −0.10 0.07 0.77 0.06 −0.01 −0.08 0.02 0.03 −0.08 SAPS-B4 Repetitive/stereotyped 0.16 0.13 0.30 −0.05 −0.19 0.14 0.00 0.25 0.07 0.19 −0.52 Formal thought disorder SAPS-P1 Derailment 0.12 0.85 0.10 −0.15 0.01 0.04 −0.07 0.02 −0.02 0.29 −0.13
SAPS-P2 Tangentiality 0.15 0.83 0.05 −0.24 −0.02 0.01 −0.05 −0.05 0.06 0.31 −0.16
SAPS-P3 Incoherence 0.13 0.46 0.15 −0.13 0.10 −0.05 0.01 −0.09 0.02 0.15 −0.57
SAPS-P4 Illogicality 0.19 0.79 0.18 −0.24 0.10 0.05 −0.04 0.10 −0.05 0.24 −0.19
SAPS-P5 Circumstantiality 0.17 0.77 0.15 −0.21 −0.03 0.00 −0.18 0.03 −0.02 0.16 −0.09 SAPS-P6 Pressure of Speech −0.19 0.59 −0.20 0.04 0.25 0.20 −0.21 −0.02 −0.08 −0.20 −0.21 SAPS-P7 Distractible Speech 0.03 0.61 0.06 −0.03 0.35 0.04 −0.06 0.08 −0.24 0.24 −0.08
SAPS-P8 Clanging 0.10 0.61 0.16 −0.15 0.19 0.07 −0.02 0.30 −0.31 0.00 −0.12
Affectiveflattening/blunting SANS-1 Facial expression 0.88 0.09 0.08 −0.37 −0.06 −0.02 0.14 −0.05 −0.09 0.32 −0.03 SANS-2 Spontaneous movements 0.86 0.12 0.13 −0.27 −0.07 −0.07 0.05 −0.02 −0.13 0.19 −0.09 SANS-3 Expressive gestures 0.93 0.12 0.06 −0.36 −0.03 0.00 0.09 −0.01 −0.10 0.28 −0.07
SANS-4 Eye contact 0.56 0.04 0.01 −0.24 0.09 −0.06 0.08 0.01 −0.08 0.37 −0.29
SANS-5 Non-responsiveness 0.87 0.17 0.13 −0.35 0.07 −0.02 0.13 0.07 −0.02 0.29 −0.11 SANS-7 Vocal Inflections 0.87 0.05 0.15 −0.36 0.02 −0.08 0.12 0.02 −0.02 0.30 −0.10
Alogia SANS-9 Poverty of speech 0.72 −0.07 0.00 −0.19 0.05 −0.11 0.22 0.03 −0.15 0.57 0.00
SANS-10 Poverty of speech content 0.36 0.52 0.01 −0.23 −0.05 0.07 0.00 0.05 −0.09 0.53 −0.12
SANS-11 Blocking 0.55 0.26 0.26 0.03 0.07 0.02 0.15 0.15 −0.12 0.64 −0.01
SANS-12 Latency of response 0.68 0.18 0.12 −0.04 0.05 −0.08 0.10 0.06 −0.19 0.61 0.04 Avolition/apathy SANS-14 Grooming/hygiene 0.34 0.13 0.00 −0.53 0.26 −0.05 −0.07 −0.09 −0.36 0.27 −0.43
SANS-15 Impersistence 0.23 0.24 0.11 −0.68 0.23 −0.09 −0.11 −0.02 −0.17 0.25 0.04 SANS-16 Physical anergia 0.52 0.14 0.16 −0.63 −0.06 −0.15 0.02 0.00 −0.34 0.27 −0.06 Anhedonia/asociality SANS-18 Recreational interest/ activity 0.35 0.10 0.08 −0.70 −0.19 −0.20 0.21 −0.03 −0.19 0.18 −0.01 SANS-19 Sexual interest/activity 0.25 0.08 0.03 −0.64 −0.25 −0.15 0.09 0.15 0.00 −0.04 0.04 SANS-20 Ability to feel intimacy 0.31 0.18 0.12 −0.75 −0.06 −0.04 0.19 0.04 0.21 0.20 −0.17
SANS-21 Relationships 0.45 0.24 0.06 −0.81 −0.02 −0.05 0.16 0.07 0.14 0.32 −0.08
possible inflection point would have yielded a comparable number of
components to the Kaiser criterion method (∼11 or 12), whilst the
other would have yielded far fewer (∼four orfive). The choice of
re-tention method thus has profound implications on thefindings since the
exclusive retention of thefirst four components would result in the loss
of all information relating to hallucinations as well as a subset of
de-lusions (seeTable 3). This would seem to represent an unjustifiable loss
of information from a clinical perspective. In contrast, retention of the
full 11–12 components (e.g. as indicated by the Kaiser criterion
method) would result in the inclusion of components with few item
loadings (sometimes only one, e.g.Table 3component 9), or
compo-nents that combine seemingly unrelated symptoms that make little
sense clinically (e.g.Table 3, component 7).
Thefindings therefore support the notion that discrepancies in the
literature as to the precise number of psychotic components may be
driven, in part, by differences in the methods used to determine the
number of factors. Further, they are consistent with Peralta and
Cuesta's (2001)review of the literature, which found that the use of the scree method consistently resulted in the extraction of around half the number of dimensions rendered by the Kaiser criterion method.
4.2. Dependence on data reduction method
The choice of data reduction method did not impact drastically
upon thefindings. PCA and EFA generated near-identical results in the
global ratings and symptom level analyses. There was, however, a consistent trend for lower loadings using EFA relative to PCA, with several items failing to reach the threshold for inclusion as a result.
Peralta and Cuesta similarly concluded that the core structure un-derlying psychotic symptoms (as revealed by common symptom mea-sures) is relatively robust to changes in data reduction method. They
found near-identical effects of using EFA (with principal axis factoring)
or PCA to analyse SAPS and SANS data in a sample of 660 patients with
psychosis (Peralta and Cuesta, 1999), and further, in a review of the
literature noted robust factor solutions across a range of studies using
[image:8.595.43.285.54.272.2]different data reduction methods (Peralta and Cuesta, 2001).
Fig. 3.Scree plot for components identified in the second-order symptom level principal component analysis. Component numbers are plotted against the scaled eigenvalues for each eigenvector (eigenvalue divided by the total number of components). The dotted line represents the eigenvector > 1 line (i.e. 1 divided by the total number of components).
[image:8.595.339.475.61.748.2]4.3. Model utility and validity
The data reported strongly suggest that a simple dichotomy between positive and negative symptoms, which underlies the construction of the SAPS and SANS, does a poor job of capturing the full complexity of the underlying symptom structure. Thus, at the very least, it is clear that the symptoms of disorganisation cannot be lumped together on either positive or negative dimensions, but instead, represent a distinct
syn-drome or cluster; see discussion in Dazzi et al. (2016) for example.
Beyond this, however, it is not clear which level of description
de-scribed here offers the most useful account of psychotic symptom
structure: thefirst-order model, which describes 10 + dimensions,
re-taining much of the complexity of the original data-set, or a higher-order (more parsimonious) model based on the classic triad of positive, negative and disorganisation symptoms. To address this question as it
related to their own data, Peralta and Cuesta (1999) turned to the
amount of variance explained by each level of the model (first-order
and second-order). Thus, whilst the data reported here show that the 11
first-order components accounted for 63.1% of the variance in the 46
symptoms included in the model, the three second-order components
accounted for 41.5% of thefirst-order components. This implies that
the second-order components only accounted for 26.2% of the variance in individual SAPS/SANS scores (41.5% of 63.2%). This represents a considerable loss of variance, and suggests that the positive, negative and disorganisation symptom clusters, by themselves, do a relatively poor job of capturing the full richness of psychotic symptoms.
This trade-offbetween parsimony and completeness of description
is inevitable, however, and the relative utility of each model will de-pend on the purpose/s for which they are being used. One might argue, therefore, that clinical/professional judgement should play a crucial role in deciding how many -and which- components should be retained, although this would inevitably introduce a further stage of subjectivity to the analyses. For example, a measure/model that is used in a clinical context, should be of clinical utility, able to assist in the processes of assessment, treatment and outcome monitoring. One might question,
for example, to what extent component nine in thefirst-order item-level
analysis (comprised of a single item: delusions of jealousy) adds
any-thing of clinical utility to the model (Table 3). In contrast, models
employed in research may require a distinct set of utilities, although there may be some overlap, particularly where research is applied and of direct clinical relevance.
With this in mind, the triadic symptom model is robust, highly
re-producible (including across different measures) and, with only three
scores to define it, easy to manage with good face validity (Grube et al.,
1998; Smith et al., 1998). For research purposes, such as the
in-vestigation of associations between symptom dimensions and defined
risk factors, clinical outcomes and treatment effects can be tested and
interpreted without a large inflation in the risk of a type one error
(Allardyce et al., 2007a; Oher et al., 2014; Wickham et al., 2014), as would be the case if a more complex multi-dimensional model were used. However, this loss of information inevitably risks missing patterns
of association operating at a finer scale of analysis, e.g. between risk
factors and individual symptoms. (Note: a similar discussion in the
literature has arisen around the benefits versus costs and trade-offs
involved in using longer versus shorter versions of common symptom
measures such as the PANSS; seeLindenmayer (2017) andLin et al.
(2018)for example.)
If a system of symptom classification is to be truly valid, however,
one might argue that its structure should reflect something meaningful
about the aetiology, course or treatment-responsiveness of symptoms (for example), rather than mere statistical artefact. In support of the former, there is some evidence to suggest that positive, negative and
disorganisation symptom clusters are predictive of differences in
clin-ical course and outcome (Allardyce et al., 2007a; Austin et al., 2013).
Further, they may be associated with distinct neuropsychological
pro-files (Aderibigbe and Gureje, 2008; Basso et al., 1998; Liddle and
Morris, 1991) and partially separable patterns of structural and
func-tional brain abnormalities (Kaplan et al., 1993; Koutsouleris et al.,
2008; Mozley et al., 1994; Schröder et al., 1995; Zhang et al., 2015).
However, components extracted at afiner grain of analysis, e.g. the
delusions, bizarre behaviour and social dysfunction to emerge from the
first-order symptom level analysis, may also show unique patterns of
association with defined risk factors and treatment outcomes; see
Bentall et al. (2012)for example. Further research is needed therefore, to determine which items and symptom clusters embedded in com-monly used symptom measurement tools correlate/predict other para-meters that are of genuine importance to our understanding of psy-chosis, and conversely, which items/clusters should be omitted from these measures.
In this regard it is worth noting that, to date, no formal assessment of the relative validity (e.g. discriminant validity or predictive validity) of higher-order versus lower-order factors has been undertaken. Irrespective, it would seem essential that this question be addressed if
dimensional systems of classification are to be adopted more widely in
clinical and research practice (Morris and Cuthbert, 2012; Parker,
2014). In seeking to validate different models, however, it would be a
mistake to assume that all dimensions extracted necessarily reflect
mechanisms that reside at a single, common level. Returning to the
example above, whilst it might be possible to link delusions to defined
neurobiological substrates, hypothetically, one mightfind that other
symptoms, e.g. social dysfunction, show much less specificity in their
association; instead they might relate to multiple factors and processes
operating at distinct levels, e.g. dysfunction within defined cortical
networks underpinning social cognition, but also, behavioural,
inter-personal–and potentially even sociological- processes. Hence, in
vali-dating distinct models of symptoms it will be important to seek their correlates at multiple levels (from the neurophysiological to the social), whilst paying close attention to the meaning of extracted dimensions alongside their statistical properties.
4.4. Implications and future research
Within thefields of psychosis research (Morris and Cuthbert, 2012),
classification (American Psychiatric Association, 2013; Parker, 2014)
and clinical practice (The British Psychological Society, 2014), it has
been argued that the current system of nosology is far from optimal,
and that a shift towards a dimensional model would be beneficial.
However, it is arguable that such a shift would only be fruitful and meaningful to the extent that the dimensional system adopted is robust, e.g. reliable and valid across broad variations in age, gender, ethnicity, culture, diagnosis, stage of illness, duration without treatment and
methods of administration; seeAnderson et al. (2017), Rabinowitz et al.
(2017)andLehoux et al. (2009)for example.
Future studies are therefore needed to explore the extent to which
symptom models vary (or remain consistent) across different
popula-tion samples. The results reported here, however, suggest that diff
er-ences in statistical methodology may also contribute to variations in
findings across studies; seePeralta and Cuesta (2001)andToomey et al.
(1997). In order to distinguish between this kind of statistical artefact
and informative ‘treatment effects’, a number of approaches can be
employed. As a minimum, authors should make explicit the precise analytic methods they use, as well as the reasoning behind their choices; thus, even seemingly minor decisions such as the choice of data
factorability tests employed are likely to impact upon thefindings (see
Section 3.3for example). Ideally however, sensitivity analyses should
be undertaken (as reported here), so that the effects of changing the
methodology are tested within the same data-set.
Whilst we have explored the effects of varying data reduction, factor
which a single‘general’psychosis factor competes withfive correlated symptom factors to describe variance in symptoms scores, provides a
better fit to psychotic symptoms than uni-dimensional or two-tiered
hierarchical models of the kind tested here and commonly found in the
literature. Further, this held true for patients with diagnoses of affective
and non-affective psychosis, as well as participants from the general
population (Reininghaus et al., 2016, 2013; Shevlin et al., 2017). To
facilitate such comparisons and foster transparency journals should demand open-access to data; information can then be aggregated across studies, and discrepancies due to variations in approach tested (Gewin, 2016). It is worth noting also, that debate as to the relative
merit of diagnostic versus dimensional systems of classification, as well
as the validity of hierarchical versus non-hierarchical (e.g. bifactor)
models of mental health difficulties, is not restricted to the study of
psychosis, but is mirrored in more general models of psychopathology
also; see Lahey et al. (2018)andKotov et al. (2018)for discussion.
Consequently, thefindings reported here may have broader relevance
outside thefield of psychosis. To test this however, future studies that
integrate data from across multiple diagnostic categories are needed in
addition to in-depth meta-analyses/systematic reviews of thefield; see
Waszczuk et al. (2017)for example.
Finally, basic data reduction approaches of this kind should also be used in conjunction with a broad array of functional, clinical, cognitive, neuropsychological, psychosocial and environmental indices, in order to determine the neurobiological and etiological underpinnings (or otherwise) of derived models, as well as their clinical and prognostic utility. It is likely that multi-disciplinary research of this kind will deepen our understanding of how psychosis symptoms emerge and are maintained, and hence, lend itself to the development of novel
treat-ments and interventions that target specific symptoms or symptoms
clusters; see, for example,Pontillo et al. (2016), Freeman and Garety
(2006)andRemington et al. (2016).
4.5. Limitations
There are a number of potential limitations to this study. First, due to a lack of correlation with other variables a number of items were
excluded from thefirst-order symptom level analyses. Whilst this
ap-proach was methodologically sound, one of the symptoms to be dis-carded was persecutory delusions, one of the most commonly reported in psychosis. It is not clear why this was the case; however, the ex-clusion of this symptom should be considered in future analyses of these data and/or use of the statistical models generated (see Supplementary
Table 1). For example, it may limit the extent to which extracted components would be expected to correlate with other variables com-monly associated with paranoia, e.g. measures of attributional biases (Bentall et al., 2001).
Second, the study only explored the structure of the SAPS and SANS, symptom measures that do not include items relating to mood disorder.
As a result, thefindings reported are limited in the extent to which they
can be compared directly to other common psychosis symptom mea-sures that include a more comprehensive list of items, e.g. the PANSS (Kay et al., 1987) and operational criteria checklist for psychotic
ill-nesses (OCCPI:McGuffin et al., 1991). Thus, PCA/EFA of PANSS and
OCCPI ratings typically render afive-factor solution that includes manic
and depressive symptom dimensions (van der Gaag et al., 2006;
Wallwork et al., 2012) in addition to the classic triad of symptoms (Peralta and Cuesta, 2001). Whilst this does not challenge the robust-ness of the positive, negative and disorganisation symptoms as a core underlying structure, it does suggest that the triadic syndrome model (underlying the SAPS/SANS for example) may not capture the full range of symptoms associated with psychotic illness. However, it is
worth noting that despite differences in their design, symptom
mea-sures such as the PANSS and SAPS/SANS have still been found to
converge; seevan Erp et al. (2014)for example.
With respect to data gathering, one potential limitation that was
raised by a reviewer is that participants recruited to the study were diagnosed by nurses rather than a psychiatrist or clinical psychologist. However, as mentioned in the Methods section, these were psychiatric
research nurses who were extremely experienced in their field and
trained to a high level in the administration of all relevant screening, diagnostic and symptom measurement tools. Further, and critically, they showed high inter-rater reliability on the SAPS and SANS.
Another limitation to the study is the possible confounding effects of
medication. Thus, it is unclear whether thefindings reported would be
different in patients with no history of exposure to medication.
Although individuals were excluded from the study if they had been taking antipsychotics for more than 12 weeks, a number of reviews
have in fact shown effects on symptoms, e.g. insight (Mattila et al.,
2017), after a considerably shorter period of medication use
(Agid et al., 2006). However, it is worth noting that the core triadic syndrome structure has been demonstrated across a wide range of studies including patients with recent-onset as well as chronic psychotic illness, patient samples that are likely to have varied considerably with
regards to medication history (Peralta and Cuesta, 2001). Further,
follow-up/longitudinal studies suggest that whilst at the level of the individual symptom dimension scores may shift with time (i.e.
symptom severity may shift) (Dragioti et al., 2017; Edgar et al., 2014),
within a patient sample the core symptom structure remains relatively
robust (Reichenberg et al., 2005), presumably despite an accumulating
history of medication use. Nonetheless, we cannot rule out the
possi-bility that thefindings reported may have differed if characteristics of
the population sample tested had differed considerably, e.g. with
re-spect to medication history and/or DUP.
Finally, at a methodological level, it is worth noting that all di-mension reduction approaches used here (i.e. variants of the EFA and PCA) are based on Pearson's correlation matrices. Whilst, to the
au-thors’knowledge this reflects the full range of approaches that have
been used to analyse the structure of psychotic symptoms in the extant literature, Pearson's correlation matrices are in fact intended for use with interval or ratio data, which cannot be assumed with self-report Lickert scales such as the SAPS and SANS; nonetheless, this is common
practice within the biological and social sciences (Gilley and
Uhlig, 1993). Thus, whilst analyses included in this study were limited to basic EFA and PCA (in line with the stated aim of exploring how commonlyreported statistical practices may have shaped discrepancies in the extant literature), future studies should examine the impact of using alternative data reduction approaches that do not rely on corre-lation matrices that assume normality. Thus, it is possible that the use of
an alternative correlation matrix, e.g. one based on Spearman‘s rank
correlation coefficients, would further change the pattern offindings to
emerge.
Funding
The West London Study of First Episode Psychosis was funded by a Wellcome Trust Programme grant to Eileen Joyce, Thomas Barnes, Maria Ron and Gareth Barker (grant number 064607/Z/01/Z). James Kirkbride was supported by a Sir Henry Dale Fellowship, jointly funded by the Wellcome Trust and the Royal Society (Grant no. 101272/Z/13/ Z). Eileen Joyce and James Kirkbride were supported by the National Institute for Health Research University College London Hospitals Biomedical Research Centre.
Supplementary materials
Supplementary material associated with this article can be found, in
the online version, atdoi:10.1016/j.psychres.2018.10.046.
References
integration of neurophysiological and neuropsychological correlates. Neuropsychobiology 34, 192–200.https://doi.org/10.1159/000119310. Agid, O., Seeman, P., Kapur, S., 2006. The "delayed onset" of antipsychotic action–an idea
whose time has come and gone. J. Psychiatry Neurosci. 31, 93–100.
Allardyce, J., McCreadie, R.G., Morrison, G., van Os, J., 2007a. Do symptom dimensions or categorical diagnoses best discriminate between known risk factors for psychosis? Soc. Psychiatry Psychiatr. Epidemiol. 42, 429–437. https://doi.org/10.1007/s00127-007-0179-y.
Allardyce, J., Suppes, T., Van Os, J., 2007b. Dimensions and the psychosis phenotype. Int. J. Methods Psychiatr. Res. 16 (Suppl 1), S34–S40.https://doi.org/10.1002/mpr.214. American Psychiatric Association, 2013. Diagnostic and Statistical Manual of Mental
Disorders, Fifth edition. American Psychiatric Association, Arlington, VA. Anderson, A.E., Mansolf, M., Reise, S.P., Savitz, A., Salvadore, G., Li, Q., Bilder, R.M.,
2017. Measuring pathology using the PANSS across diagnoses: Inconsistency of the positive symptom domain across schizophrenia, schizoaffective, and bipolar disorder. Psychiatry Res. 258, 207–216.https://doi.org/10.1016/j.psychres.2017.08.009. Andreasen, N., 1990. Methods for assessing positive and negative symptoms. In:
Andreasen, N. (Ed.), Schizophrenia: Positive and Negative Symptoms and Syndromes. Modern Problems in Pharmacopsychiatry, Karger, Basel, pp. 73–85.
Andreasen, N.C., Olsen, S., 1982. Negative v positive schizophrenia. Definition and va-lidation. Arch. Gen. Psychiatry 39, 789–794.
Austin, S.F., Mors, O., Secher, R.G., Hjorthøj, C.R., Albert, N., Bertelsen, M., Jensen, H., Jeppesen, P., Petersen, L., Randers, L., Thorup, A., Nordentoft, M., 2013. Predictors of recovery infirst episode psychosis: the OPUS cohort at 10year follow-up. Schizophr. Res. 150, 163–168.https://doi.org/10.1016/j.schres.2013.07.031.
Barnes, T.R., Hutton, S.B., Chapman, M.J., Mutsatsa, S., Puri, B.K., Joyce, E.M., 2000. West Londonfirst-episode study of schizophrenia. Clinical correlates of duration of untreated psychosis. Br. J. Psychiatry 177, 207–211.
Basso, M.R., Nasrallah, H.A., Olson, S.C., Bornstein, R.A., 1998. Neuropsychological correlates of negative, disorganized and psychotic symptoms in schizophrenia. Schizophr. Res. 31, 99–111.
Bentall, R.P., 2004. Madness Explained: Psychosis and Human Nature. Penguin Adult. Bentall, R.P., Corcoran, R., Howard, R., Blackwood, N., Kinderman, P., 2001. Persecutory
delusions: a review and theoretical integration. Clin. Psychol. Rev. 21, 1143–1192. Bentall, R.P., Wickham, S., Shevlin, M., Varese, F., 2012. Do specific early-life adversities
lead to specific symptoms of psychosis? A study from the 2007 the Adult Psychiatric Morbidity Survey. Schizophr. Bull. 38, 734–740.https://doi.org/10.1093/schbul/ sbs049.
Blanchard, J.J., Cohen, A.S., 2006. The structure of negative symptoms within schizo-phrenia: implications for assessment. Schizophr. Bull. 32, 238–245.https://doi.org/ 10.1093/schbul/sbj013.
Castle, D.J., Jablensky, A., McGrath, J.J., Carr, V., Morgan, V., Waterreus, A., Valuri, G., Stain, H., McGuffin, P., Farmer, A., 2006. The diagnostic interview for psychoses (DIP): development, reliability and applications. Psychol. Med. 36, 69–80.https:// doi.org/10.1017/S0033291705005969.
Dazzi, F., Shafer, A., Lauriola, M., 2016. Meta-analysis of the Brief Psychiatric Rating Scale–Expanded (BPRS-E) structure and arguments for a new version. J. Psychiatr. Res. 81, 140–151.https://doi.org/10.1016/j.jpsychires.2016.07.001.
de Leon, J., Peralta, V., Cuesta, M.J., 1993. Negative symptoms and emotional blunting in schizophrenic patients. J. Clin. Psychiatry 54, 103–108.
Dollfus, S., Petit, M., 1995. Principal-component analyses of PANSS and SANS-SAPS in schizophrenia: their stability in an acute phase. Eur. Psychiatry 10, 97–106.https:// doi.org/10.1016/0924-9338(96)80320-8.
Dragioti, E., Wiklund, T., Siamouli, M., Moutou, K., Fountoulakis, K.N., 2017. Could PANSS be a useful tool in the determining of the stages of schizophrenia? A clinically operational approach. J. Psychiatr. Res. 86, 66–72.https://doi.org/10.1016/j. jpsychires.2016.11.013.
Edgar, C.J., Blaettler, T., Bugarski-Kirola, D., Le Scouiller, S., Garibaldi, G.M., Marder, S.R., 2014. Reliability, validity and ability to detect change of the PANSS negative symptom factor score in outpatients with schizophrenia on select antipsychotics and with prominent negative or disorganized thought symptoms. Psychiatry Res. 218, 219–224.https://doi.org/10.1016/j.psychres.2014.04.009.
Freeman, D., Garety, P., 2006. Helping patients with paranoid and suspicious thoughts: a cognitive-behavioural approach. Adv. Psychiatr. Treat. 12, 404–415.https://doi.org/ 10.1192/apt.12.6.404.
Fulford, D., Pearson, R., Stuart, B.K., Fisher, M., Mathalon, D.H., Vinogradov, S., Loewy, R.L., 2014. Symptom assessment in early psychosis: the use of well-established rating scales in clinical high-risk and recent-onset populations. Psychiatry Res. 220, 1077–1083.https://doi.org/10.1016/j.psychres.2014.07.047.
Gewin, V., 2016. Data sharing: An open mind on open data. Nature 529, 117–119. https://doi.org/10.1038/nj7584-117a.
Gilley, W.F., Uhlig, G.E., 1993. Factor analysis and ordinal data. Education 114, 258–264. Grube, B.S., Bilder, R.M., Goldman, R.S., 1998. Meta-analysis of symptom factors in
schizophrenia. Schizophr. Res. 31, 113–120.
Huddy, V.C., Hodgson, T.L., Kapasi, M., Mutsatsa, S.H., Harrison, I., Barnes, T.R.E., Joyce, E.M., 2007. Gaze strategies during planning infirst-episode psychosis. J. Abnorm. Psychol. 116, 589–598.https://doi.org/10.1037/0021-843X.116.3.589. Jablensky, A., Sartorius, N., Ernberg, G., Anker, M., Korten, A., Cooper, J.E., Day, R.,
Bertelsen, A., 1992. Schizophrenia: manifestations, incidence and course in different cultures. A World Health Organization ten-country study. Psychol. Med. Monogr. Suppl. 20, 1–97.
John, J.P., Khanna, S., Thennarasu, K., Reddy, S., 2003. Exploration of dimensions of psychopathology in neuroleptic-naïve patients with recent-onset schizophrenia/ schizophreniform disorder. Psychiatry Res. 121, 11–20.
Joyce, E.M., Hutton, S.B., Mutsatsa, S.H., Barnes, T.R.E., 2005. Cognitive heterogeneity in
first-episode schizophrenia. Br. J. Psychiatry 187, 516–522.https://doi.org/10.
1192/bjp.187.6.516.
Kaiser, H.F., 1974. An index of factorial simplicity. Psychometrika 39 (1), 31–36. Kaplan, R.D., Szechtman, H., Franco, S., Szechtman, B., Nahmias, C., Garnett, E.S., List, S.,
Cleghorn, J.M., 1993. Three clinical syndromes of schizophrenia in untreated sub-jects: relation to brain glucose activity measured by positron emission tomography (PET). Schizophr. Res. 11, 47–54.
Kay, S.R., Fiszbein, A., Opler, L.A., 1987. The positive and negative syndrome scale (PANSS) for schizophrenia. Schizophr. Bull. 13, 261–276.
Keefe, R.S., Harvey, P.D., Lenzenweger, M.F., Davidson, M., Apter, S.H., Schmeidler, J., Mohs, R.C., Davis, K.L., 1992. Empirical assessment of the factorial structure of clinical symptoms in schizophrenia: negative symptoms. Psychiatry Res. 44, 153–165.
Klimidis, S., Stuart, G.W., Minas, I.H., Copolov, D.L., Singh, B.S., 1993. Positive and ne-gative symptoms in the psychoses. Re-analysis of published SAPS and SANS global ratings. Schizophr. Res. 9, 11–18.
Kotov, R., Krueger, R.F., Watson, D., 2018. A paradigm shift in psychiatric classification: the Hierarchical Taxonomy Of Psychopathology (HiTOP). World Psychiatry 17, 24–25.https://doi.org/10.1002/wps.20478.
Koutsouleris, N., Gaser, C., Jäger, M., Bottlender, R., Frodl, T., Holzinger, S., Schmitt, G.J, Zetzsche, T., Burgermeister, B., Scheuerecker, J., Born, C., Reiser, M., Möller, H.-J., Meisenzahl, E.M., 2008. Structural correlates of psychopathological symptom di-mensions in schizophrenia: a voxel-based morphometric study. Neuroimage 39, 1600–1612.https://doi.org/10.1016/j.neuroimage.2007.10.029.
Lahey, B.B., Zald, D.H., Perkins, S.F., Villalta-Gil, V., Werts, K.B., Van Hulle, C.A., Rathouz, P.J., Applegate, B., Class, Q.A., Poore, H.E., Watts, A.L., Waldman, I.D., 2018. Measuring the hierarchical general factor model of psychopathology in young adults. Int. J. Methods Psychiatr. Res. 27, e1593.https://doi.org/10.1002/mpr.1593. Ledesma, R., 2007. Determining the number of factors to retain in EFA: an easy-to- use
computer program for carrying out parallel analysis. Pract. Assessment, Res. Eval. 1–11.
Lehoux, C., Gobeil, M.-H., Lefèbvre, A.-A., Maziade, M., Roy, M.-A., 2009. Thefive-factor structure of the PANSS: a critical review of its consistency across studies. Clin. Schizophr. Relat. Psychoses 3, 103–110.https://doi.org/10.3371/CSRP.3.2.5. Lezak, M.D., 2004. Neuropsychological Assessment. Oxford University Press, New
York, NY.
Liddle, P.F., 1987. The symptoms of chronic schizophrenia. A re-examination of the po-sitive-negative dichotomy. Br. J. Psychiatry 145–151.
Liddle, P.F., Barnes, T.R., 1990. Syndromes of chronic schizophrenia. Br. J. Psychiatry 157, 558–561.
Liddle, P.F., Morris, D.L., 1991. Schizophrenic syndromes and frontal lobe performance. Br. J. Psychiatry 158, 340–345.
Lin, C.-H., Lin, H.-S., Lin, S.-C., Kuo, C.-C., Wang, F.-C., Huang, Y.-H., 2018. Early im-provement in PANSS-30, PANSS-8, and PANSS-6 scores predicts ultimate response and remission during acute treatment of schizophrenia. Acta Psychiatr. Scand. 137, 98–108.https://doi.org/10.1111/acps.12849.
Lindenmayer, J.-P., 2017. Are shorter versions of the positive and negative syndrome scale (PANSS) Doable? A critical review. Innov. Clin. Neurosci 14, 73–76. Lorr, M., Klett, C.J., McNair, D.M., 1963. Syndromes of Psychosis. Pergamon Press,
Oxford.
Mattila, T., Koeter, M., Wohlfarth, T., Storosum, J., van den Brink, W., Derks, E., Leufkens, H., Denys, D., 2017. The impact of second generation antipsychotics on insight in schizophrenia: results from 14 randomized, placebo controlled trials. Eur. Neuropsychopharmacol. 27, 82–86.https://doi.org/10.1016/j.euroneuro.2016.10. 004.
McGuffin, P., Farmer, A., Harvey, I., 1991. A polydiagnostic application of operational criteria in studies of psychotic illness. Development and reliability of the OPCRIT system. Arch. Gen. Psychiatry 48, 764–770.
Minas, I.H., Klimidis, S., Stuart, G.W., Copolov, D.L., Singh, B.S., 1994. Positive and ne-gative symptoms in the psychoses: principal components analysis of items from the scale for the assessment of positive symptoms and the scale for the assessment of negative symptoms. Compr. Psychiatry 35, 135–144.
Morris, S.E., Cuthbert, B.N., 2012. Research domain criteria: cognitive systems, neural circuits, and dimensions of behavior. Dialogues Clin. Neurosci. 14, 29–37. Mozley, P.D., Gur, R.E., Resnick, S.M., Shtasel, D.L., Richards, J., Kohn, M., Grossman, R.,
Herman, G., Gur, R.C., 1994. Magnetic resonance imaging in schizophrenia: re-lationship with clinical measures. Schizophr. Res. 12, 195–203.
MRC Social Genetic & Dev Psychiatry Centre, n.d. OPCRIT 4 Windows [WWW Document]. URLhttp://sgdp.iop.kcl.ac.uk/opcrit/(Accessed 5 January 2017). Nelson, H., Wilson, J., 1991. National Adult Reading Test (NART). Windsor, UK. Nemeroff, C.B., Weinberger, D., Rutter, M., MacMillan, H.L., Bryant, R.A., Wessely, S.,
Stein, D.J., Pariante, C.M., Seemüller, F., Berk, M., Malhi, G.S., Preisig, M., Brüne, M., Lysaker, P., 2013. DSM-5: a collection of psychiatrist views on the changes, con-troversies, and future directions. BMC Med. 11, 119. https://doi.org/10.1186/1741-7015-11-202.
Oher, F.J., Demjaha, A., Jackson, D., Morgan, C., Dazzan, P., Morgan, K., Boydell, J., Doody, G.A., Murray, R.M., Bentall, R.P., Jones, P.B., Kirkbride, J.B., 2014. The effect of the environment on symptom dimensions in thefirst episode of psychosis: a multilevel study. Psychol. Med. 44, 2419–2430.https://doi.org/10.1017/ S0033291713003188.
Parker, G.F., 2014. DSM-5 and psychotic and mood disorders. J. Am. Acad. Psychiatry Law Online 42 (2), 182–190.
Peralta, V., Cuesta, M.J., 2001. How many and which are the psychopathological di-mensions in schizophrenia? Issues influencing their ascertainment. Schizophr. Res. 49, 269–285.https://doi.org/10.1016/S0920-9964(00)00071-2.