Article
Optimisation of a Quasi-Steady Model of
a Free-Piston Stirling Engine
Ayodeji Sowale1,*, Edward J. Anthony2and Athanasios John Kolios1
1 Offshore Renewable Energy Engineering Centre, School of Water, Energy and Environment,
Whittle Building 52, Cranfield University, Bedfordshire MK43 0AL, UK; [email protected] 2 Power Engineering Centre, School of Water, Energy and Environment, Whittle Building 52,
Cranfield University, Bedfordshire MK43 0AL, UK; [email protected] * Correspondence: [email protected]
Received: 25 October 2018; Accepted: 21 December 2018; Published: 27 December 2018
Abstract:Energy from waste heat recovery is receiving considerable attention due to the demand for power systems that are less polluting. This has led to the investigation of external combustion engines such as the free-piston Stirling engine (FPSE) due to its ability to generate power from any source of heat and, especially, waste heat. However, there are still some limitations in the modelling, design and practical utilisation of this type of engine. Modelling of the FPSE has proved to be a difficult task due to the lack of mechanical linkages in its configuration, which poses problems for achieving stability. Also, a number of studies have been reported that attempt to optimise the output performance considering the characteristics of the engine configuration. In this study the optimisation of the second-order quasi-steady model of the gamma-type FPSE is carried out using the genetic algorithm (GA) to maximise the performance in terms of power output, and considering the design parameters of components such as piston and displacer damper, geometry of heat exchangers, and regenerator porosity. This present study shows that the GA optimisation of the RE-1000 FPSE design parameters improved its performance from work done and output power of 33.2 J and 996 W, respectively, with thermal efficiency of 23%, to 44.2 J and 1326 W with thermal efficiency of 27%.
Keywords:free-piston Stirling engine; genetic algorithm; optimisation
1. Introduction
The increasing demand for renewable forms of energy less harmful to the environment has led to increased interest and research into various applications that can harness such energy, especially from waste heat. The free-piston Stirling engine (FPSE), which is an external combustion engine suitable for energy recovery application especially in combined heat and power systems, has many advantages such as a simple mechanical configuration and longevity, efficiency and thermal-to-electrical energy conversion. However, due to the lack of a rotating shaft in the FPSE, it is not easy to predict a regime for its stable operation, unlike the kinematic Stirling engines [1]. Different methods have been implemented to analyse the operational performance of the FPSE, such as the investigation using computational fluid dynamics (CFD) analysis [2,3]. However, these models could not describe the performance of the engine accurately due to the inability to define the spring stiffness and damping factors that determine the motions of the piston and displacer during engine operation.
Other numerical models have been developed to analyse the FPSE using different techniques, such as the motion control mechanism [4] and linear control method [5]. For adequate and satisfactory prediction of the performance of Stirling and free-piston Stirling engines, advanced and precise numerical models are required (second-order models [6–10]) for this purpose. The second-order models are employed based on the ability to predict the relationship between the thermodynamics
Energies2019,12, 72 2 of 17
and dynamic part of the engines. Sowale [11] carried out a comparison of an isothermal, adiabatic and quasi model of a gamma-type FPSE, considering dynamic and thermodynamic equations to analyse the engine operation in real time. The study presented the quasi model as having the best performance output among the three models. Also, a study on FPSE was presented on the use of masses of the piston and displacer, including the heat exchanger geometry design, in relation to heat loss to scale the performance of the engine [12]. In their study the possibility of determining the efficiency and output power of a miniaturised FPSE was explored using scaling laws. Wu et al. [13] developed an FPSE using a semi-analytical approach to the parametric design. The study presented the single engine system with different stiffness and damping as a hard self-oscillating system. An experimental approach was presented by Jia et al. [14] considering the start-up operation of the free-piston engine generator. Steady state operation was attained after a certain number of cycles, including the unstable increase in the compression and pressure ratio. Furthermore, various analyses have been conducted on the thermodynamic properties of the FPSE [15–20] in order to model the relationship between the dynamic and thermodynamic characteristics of the engine.
Various approaches have been carried out on the recovery of waste heat using Stirling engines. Chaudhari et al. [21] carried out an investigation on the use of the Stirling engine to recover waste heat from the exhaust of an internal combustion engine in order to increase the output power and fuel economy, and reduce environmental pollution. Kolios et al. [22] conducted a study using a probabilistic modelling method to investigate energy generated from the Nano-Membrane Toilet using Stirling engines. The results suggested a high probability that Stirling engines can be utilised to achieve a positive power output. An investigation was carried out on the recovery of exhaust waste from gasoline engine using Stirling engines, the results indicated a possibility of harnessing the waste heat recovered and converting into useful work with the aid of the Stirling engine integrated to the gasoline engine [23–26].
Recently, different methods have been employed for the design and optimisation of complex energy systems. Despite the fact that there are a number of investigations on the use of the genetic algorithm (GA) to optimise various energy systems, few published findings on the optimisation of Stirling engines exist, especially the FPSEs aided by the GA approach. Kraitong and Mahkamov [27] carried out the optimisation of a low-temperature differential Stirling engine with the aid of the GA. The design parameters, including the diameter and stroke of the displacer and piston, and the thickness of the regenerator, were selected as variables and the brake power was selected as the objective function of the optimisation algorithm. It was found that the design parameters selected resulted in a considerable increment in the performance of the Stirling engine. Boucher et al. [28] carried out an optimisation on a dual FPSE considering the analysis of the dynamic balance equations of the engine using time-based linearised pressure. Stable operation was achieved taking into account the dynamic, thermodynamic and geometrical characteristics of the engine. A frequency-based design model of the FPSE using the GA was developed by Zare and Tavakolpour-Saleh [29] where the variables selected from the engine design parameters are the mass and stiffness of the displacer and piston, including the displacer rod’s cross-sectional area. The optimal values of the design parameters obtained were then employed to produce a FPSE prototype and tests conducted showed the validity of the results based on the similarity in the numerical and experimental output.
Energies2019,12, 72 3 of 17
2. Principle of FPSE Operation
External combustion engines such as the FPSEs operate on a closed regenerative cycle with the aid of the piston and displacer’s movement integrated into dampers and springs. The engine operates on a typical Stirling cycle, but unlike Stirling engines there is no linkage between the displacer and piston. For the FPSE the major components that facilitate the operation are: piston, displacer, dampers, springs and heat exchangers. The work spaces are where most of the work is being carried out as a result of the pressure exerted on the working gas. Here, the temperature and volume of the gas in the work spaces change over time in a repeated cycle, with the help of the heat exchangers surrounding the work spaces which aid heat transfer within the working gas during the oscillatory motion between the work spaces.
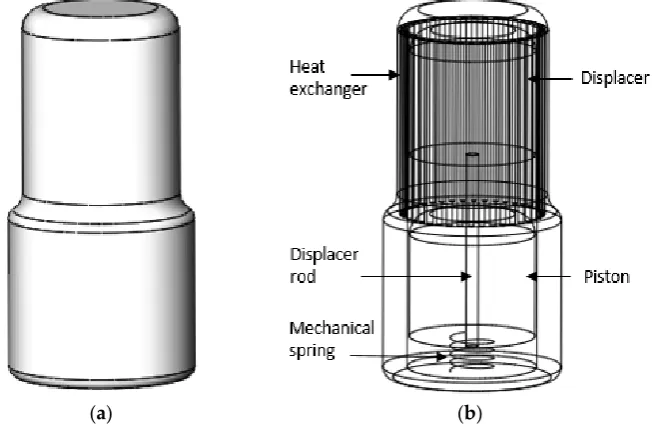
A description of the engine dynamics of the FPSE is essential as it is necessary to know the types of forces acting on the piston and displacer. Figure1shows the schematic diagram of the engine. There exist three forces acting on the displacer and piston due to their relative displacements, velocities and accelerations. These forces contribute to the description of the work done in the expansion and compression spaces as they act on the working gas, which is assumed to be an ideal gas. The force acting in the work spaces exerted by the pressure build-up in the working gas is the linear spring force on the piston and displacer, corresponding to their respective displacement, while the linear damping force on the piston and displacer is proportional to their relative velocity.
simulation of the developed model to confirm the optimised results including the applicability and relevance of the GA to the design of energy systems.
2. Principle of FPSE Operation
External combustion engines such as the FPSEs operate on a closed regenerative cycle with the aid of the piston and displacer’s movement integrated into dampers and springs. The engine operates on a typical Stirling cycle, but unlike Stirling engines there is no linkage between the displacer and piston. For the FPSE the major components that facilitate the operation are: piston, displacer, dampers, springs and heat exchangers. The work spaces are where most of the work is being carried out as a result of the pressure exerted on the working gas. Here, the temperature and volume of the gas in the work spaces change over time in a repeated cycle, with the help of the heat exchangers surrounding the work spaces which aid heat transfer within the working gas during the oscillatory motion between the work spaces.
A description of the engine dynamics of the FPSE is essential as it is necessary to know the types of forces acting on the piston and displacer. Figure 1 shows the schematic diagram of the engine. There exist three forces acting on the displacer and piston due to their relative displacements, velocities and accelerations. These forces contribute to the description of the work done in the expansion and compression spaces as they act on the working gas, which is assumed to be an ideal gas. The force acting in the work spaces exerted by the pressure build-up in the working gas is the linear spring force on the piston and displacer, corresponding to their respective displacement, while the linear damping force on the piston and displacer is proportional to their relative velocity.
[image:3.595.133.460.352.565.2](a) (b)
Figure 1. Schematic diagram of the gamma-type FPSE used in this study. (a) Casing of the FPSE; (b) Layout diagram of the FPSE.
3. Methodology
Numerical simulation of the FPSE requires accurate and careful calculation of the dynamic and thermodynamic features of the engine parameters, including the algorithm, to provide an effective solution and description of the output performance. In this study, MATLAB is employed to solve the motion equations of the piston displacer and the thermodynamic equations that describe the engine’s operation. The problem posed by the damping and spring stiffness on the stability of the engine is solved by calculation of these parameters at every iteration in the cycle and the convergence criterion was defined so as to achieve steady operation and calculate the output power. The regenerator, being a critical component of the FPSE as it determines the thermal efficiency, requires a careful approach in order to study and observe its performance; as a result it was divided
Figure 1. Schematic diagram of the gamma-type FPSE used in this study. (a) Casing of the FPSE; (b) Layout diagram of the FPSE.
3. Methodology
Energies2019,12, 72 4 of 17
to ensure optimal heat balance capacity and minimise flow losses, as the efficiency of the regenerator material is highly dependent on its thermal capacity. The computation is carried out in 1000 timesteps over 10 complete cycles; the output performance is determined and results are plotted. The solution to the difficulty of obtaining stable operation of the FPSE is obtained by calculating the damping coefficient of every iteration at a defined increment for every cycle and a criterion is defined for termination of the algorithm so as to converge and calculate the output power and efficiency of the FPSE, when the values of the expansion and compression space temperature at the beginning of the cycle are the same at the end of the cycle.
Figure2shows the calculation scheme of the engine used for modelling the temperature profile from the expansion space through the heat exchangers and into the compression space.
Energies 2018, 11, x FOR PEER REVIEW 4 of 17
[image:4.595.84.514.233.375.2]into 10 parts to observe the behavioural characteristics and their influence on and by the heater and cooler, including the overall effect on the engine performance. Also, the regenerator matrix is divided into 10 parts so as to ensure optimal heat balance capacity and minimise flow losses, as the efficiency of the regenerator material is highly dependent on its thermal capacity. The computation is carried out in 1000 timesteps over 10 complete cycles; the output performance is determined and results are plotted. The solution to the difficulty of obtaining stable operation of the FPSE is obtained by calculating the damping coefficient of every iteration at a defined increment for every cycle and a criterion is defined for termination of the algorithm so as to converge and calculate the output power and efficiency of the FPSE, when the values of the expansion and compression space temperature at the beginning of the cycle are the same at the end of the cycle.
Figure 2 shows the calculation scheme of the engine used for modelling the temperature profile from the expansion space through the heat exchangers and into the compression space.
Figure 2. The control volumes of the FPSE [30].
3.1. Assumptions of the Mathematical Model
To model the FPSE certain assumptions are required to represent the algorithm and also govern the performance characteristics of the engine parameters:
1) The mass of the working gas in the chambers of the FPSE is constant.
2) The working gas in the engine is an ideal gas. Helium is selected for this simulation. 3) The thermal losses are derived using the superposition principle.
4) The temperature of the working gas in the work spaces and heat exchangers changes with time over a complete cycle.
5) The buffer pressure is equal to the average of the dynamic pressure in the compression space during oscillation of the piston.
6) The operation of the engine is in a steady-state condition. The temperature of the expansion and compression space at the beginning of the cycle should be equal to the value at the end of the cycle to satisfy this criterion.
The equations and boundary conditions used for the modelling have been previously derived by the author, as reported in [11]. The motions of the displacer and piston are determined in order to predict their amplitudes, velocities and acceleration, and they are derived with respect to the masses of the displacer and piston, the damping force, spring force, surface area and pressure of the working gas. Equation (1) is used to determine the motion of the displacer:
𝑚 𝑥 + 𝐾 𝑥 + 𝐶 𝑥 = 𝑃(𝐴 ) (1)
where 𝑚 represents the mass of the displacer; 𝐾 is the spring stiffness of the displacer; 𝐶 is the damping load of the displacer; and 𝐴 is the cross-sectional area of the displacer. The motion of the piston is defined as a result of the damping force, spring force, area of piston, bounce space pressure and the pressure of the working gas, according to Equation (2):
Figure 2.The control volumes of the FPSE [30].
3.1. Assumptions of the Mathematical Model
To model the FPSE certain assumptions are required to represent the algorithm and also govern the performance characteristics of the engine parameters:
(1) The mass of the working gas in the chambers of the FPSE is constant.
(2) The working gas in the engine is an ideal gas. Helium is selected for this simulation. (3) The thermal losses are derived using the superposition principle.
(4) The temperature of the working gas in the work spaces and heat exchangers changes with time over a complete cycle.
(5) The buffer pressure is equal to the average of the dynamic pressure in the compression space during oscillation of the piston.
(6) The operation of the engine is in a steady-state condition. The temperature of the expansion and compression space at the beginning of the cycle should be equal to the value at the end of the cycle to satisfy this criterion.
The equations and boundary conditions used for the modelling have been previously derived by the author, as reported in [11]. The motions of the displacer and piston are determined in order to predict their amplitudes, velocities and acceleration, and they are derived with respect to the masses of the displacer and piston, the damping force, spring force, surface area and pressure of the working gas. Equation (1) is used to determine the motion of the displacer:
md ..
x + Kdxd + Cd .
x = P(Ad) (1)
wheremdrepresents the mass of the displacer;Kdis the spring stiffness of the displacer;Cdis the damping load of the displacer; andAdis the cross-sectional area of the displacer. The motion of the piston is defined as a result of the damping force, spring force, area of piston, bounce space pressure and the pressure of the working gas, according to Equation (2):
wheremprepresents the mass of the piston;Kpis the spring stiffness of the piston;Cpis the damping load of the piston; Apis the cross-sectional area of the piston; and Pbis the bounce space pressure in the piston compartment. From the ideal gas equation, the equation for pressure in the engine for closed-cycle operation is defined (Equation(3)) [31]:
P= MR
Vc Tck +
Vk Tk +
Vr Tr +
Vh Th +
Ve The
(3)
Boundary conditions for the conditional temperatures are determined with these constraints:
Ifmck0> 0 thenTck=TcelseTck=Tk (4)
Ifmhe0> 0 thenThe=ThelseThe=Te (5)
Using the engine’s geometry, the positions of the piston and displacer, xp and xd, with the expansion and compression volumes,VeandVc, can be derived from the following equations:
Ve = (Vcle+xd)Ad (6)
Vc = (Vclc+xp)Ap−(xd+Vcle)Ad (7)
The gas temperature derivatives in the expansion and compression spaces are:
dTe =Te
dP p +
dVe Ve
−dme
me
(8)
dTc =Tc(dP p +
dVc Vc
−dmc
mc ) (9)
The temperatue of the working gas across the boundary between the heater and the expansion space is determined in Equations (10) and (11):
If:
.
mhe>0, The= Th (10)
If:
.
mhe ≤ 0, The= Te (11)
The temperature of the mass flow from the tenth part of the regenerator to the heater is described as follows:
If:
.
mr10h>0, Tr10h=Trh (12)
.
mr10h≤0, Tr10h= Th (13)
wherem.r10hrepresents the mass flow rate from the tenth part of the regenerator to the heater (kgs−1), Tr10hthe temperature of the mass flow rate from the tenth part of the regenerator to the heater, andTrh the temperature of the tenth part of the regenerator space to the heater.
The temperature of the working gas in the regenerator is obtained with Equation (14):
Tr(i)−r(i+1)= (Tr(i)+Tr(i+1))/2 (14)
Tr(i) and Tr(i+1) represent the working gas temperature of the (i) and (i+1) parts of the regenerator space, whereiis the number of regenerator parts, from one to ten.
Energies2019,12, 72 6 of 17
If:
.
mkr1>0, Tkr1=Tk (15)
.
mkr1≤0, Tkr1=Trk (16)
wherem.kr1represents the mass flow from the cooler to the first part of the regenerator (kgs−1);Tkr1is
the temperature from the cooler to the first part of the regenerator;Tkis the temperature of the cooler space; andTrkis the temperature between the first part of the regenerator and the cooler.
For the compression space to the cooler, the conditions for mass flow rate are given as follows: If:
.
mck>0,Tck=Tc (17)
.
mck ≤0,Tck =Tk (18)
wherem.ckrepresents the mass flow rate from the compression space to the cooler;Tckis the temperature from the compression space to the cooler;Tcis the temperature of the compression space;m.herepresents mass flow rate from heater to expansion space (kgs−1);Theis the temperature of the mass flow from the heater to the expansion space;This the temperature of the heater; andTeis the temperature of the expansion space.
The equation used to determine the heat loss from conduction in the heat exchanger is given as:
dQlir= kA l(T1−T2)
(19)
wherekis the thermal conductivity;Ais the cross-sectional area; andlis the length. T1andT2are
used to determine the temperature difference between the heat exchangers.
The transfer of heat from the first part of the regenerator to the tenth part due to heat conduction in relation to the environment is defined as external conduction heat loss. It also accounts for the heat transfer from the part of the regenerator with a higher temperature to the part with a lower temperature. This is defined only for the regenerator:
dQrext = (1−ε)hrAf s(Tm−Tr) (20)
whereAf sis the free surface area,εis the effectiveness of the regenerator, andTmandTrare used to
determine the temperature of the regenerator matrix and the regenerator part, respectively. The work done (W) in the cycle is determined with Equation (21):
W=
Z t
0
PedVe dt + Pc
dVc dt
(21)
Hence, the power output (P) is derived as a function of work done and frequency:
P=W f (22)
3.2. Numerical Simulation Procedure
Table 1.Parameters of the RE-1000 Sunpower FPSE used in this study [11,31].
Engine Data Value
Mean pressure (MPa) 7.1
Heater temperature (K) 814.3 Cooler temperature (K) 322.8
Working gas Helium
Oscillating frequency (Hz) 30 Piston damping load (Nsm−1) 461.5 Displacer damping load (Nsm−1) 35.34 Spring stiffness of piston (Nm−1) 296,000 Spring stiffness of displacer (Nm−1) 25,000
Mass of piston (kg) 6.2
Mass of displacer (kg) 0.426 Regenerator volume (m3) 0.56
Heater volume (m3) 0.27 Cooler volume (m3) 0.20 Expansion space clearance volume (m3) 0.019 Compression space clearance volume (m3) 0.018
The simulation is then computed over 10 cycles in 1000 timesteps until the steady-state criterion is satisfied. The criterion is satisfied when the value of the expansion and compression spaces at the beginning of the cycle are the same at the end of the cycle. Thereafter, the work done, power and efficiency are determined. For stable operation of the FPSE, a methodical approach is applied to the algorithm taking into consideration the damping load of the piston and displacer. Their values are computed in each cycle for every iteration at a specific increment, then tested against the criterion for convergence for calculating power and efficiency and, finally, they are determined at the moment when the temperature of the work spaces at the start of a cycle equals the value at the end of the cycle. The initial temperatures of the working gas volume in the work spaces and heat exchangers were defined prior to the simulation, while the linear interpolation method was used to determine the temperatures of the heat exchangers.
4. Optimisation Procedure Using the Genetic Algorithm
Energies2019,12, 72 8 of 17
[image:8.595.134.460.183.270.2]to produce the next generation. Thereafter, the newly generated offspring are produced by the recombination of crossover and mutation procedures. The fitness of the new population generated is then evaluated. Numerous generations are then produced from this algorithm pending the satisfaction of the termination condition given in the convergence criterion. The GA procedure and expressions are listed in Table2.
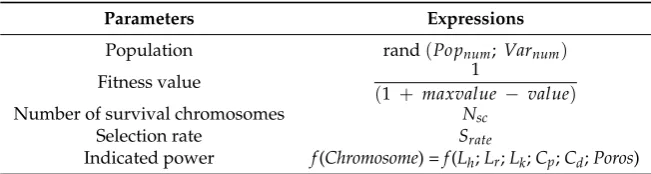
Table 2.Genetic algorithm procedure and expressions.
Parameters Expressions
Population rand(Popnum; Varnum)
Fitness value 1
(1 + maxvalue − value)
Number of survival chromosomes Nsc
Selection rate Srate
Indicated power f(Chromosome) =f(Lh;Lr;Lk;Cp;Cd;Poros) 4.1. Definition of Variables and Objective Function
The engine design parameters used as variables and the objective function for optimisation are determined. The parameters selected are defined as chromosomes such as: length of heater, regenerator and cooler, porosity of regenerator matrix, and the damping coefficient of displacer and piston. The heat exchangers require a careful selection of the design parameter as their functionality has an immense effect on the output performance of the FPSE. The chromosome used in the GA optimisation is represented as a function of the indicated power, which is the objective function:
Pi = f(Chromosome) (23)
f(Chromosome) =f(Lh;Lr;Lk;Cp;Cd;Poros) (24) where Pi is indicated power; Lh, Lr and Lk are the lengths of heater, regenerator, and cooler, respectively;Cpis damping coefficient of piston;Cdis damping coefficient of displacer; andPorosis regenerator porosity.
For the initial population, the design parameters are selected at random and generate a matrix formation of different chromosomes, wherePopnumis the number of chromosomes andVarnumis the number of variables (Table2). An appropriate selection of population size is required using the GA due to its considerable effect on the convergence speed of the optimisation solution. On the one hand, small population size may result in the solution converging quickly and achieving a poor solution, while on the other hand, too large a population size may result in excessive time for convergence of the solution. From 30 to 100 chromosomes are recommended when using the GA [33]; therefore, a population of 30 per generation(Popnum) is selected in this study based on the nature of the problem and its applicability for the design and development of the FPSE. To evaluate the indicated power defined as the chromosome value by the fitness function, the value for each generation is determined and ranked in the value map by the fitness value function given in Table2, wheremaxvalueis the maximum value of the chromosome andvalueis the value of the chromosome. The selection procedure to determine the best chromosomes in order to produce a new generation is a very important process in the GA. The fitness value is arranged in descending order. The formula is given in Table2, whereNscis the number of survival chromosomes andSrateis the selection rate of 0.5. The weight ranking technique is the procedure used for selecting the fittest chromosome from the ranking order randomly and pairing selection of the parents for the reproduction operation [34].
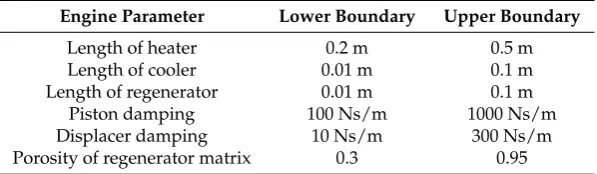
Table 3.Constraints for the FPSE design parameters.
Engine Parameter Lower Boundary Upper Boundary
Length of heater 0.2 m 0.5 m
Length of cooler 0.01 m 0.1 m
Length of regenerator 0.01 m 0.1 m
Piston damping 100 Ns/m 1000 Ns/m
Displacer damping 10 Ns/m 300 Ns/m
Porosity of regenerator matrix 0.3 0.95
The constraints of the boundaries are selected in order to check the convergence of the optimisation procedure and achieve the best fitness function so as to maximise the objective function.
4.2. Procedure for Mating
Mating is the process where the reproduction operator employs parents to generate new offspring for the next generation. To accomplish this, the operator performs a random selection of the design parameters to produce new chromosomes from different sides of the crossover point between two parents.
4.3. Procedure for Mutation
The objective of the optimisation procedure is the global solution; however, the derived solution might be the localised minimum or maximum if there exists a rapid convergence. Therefore, the procedure of mutation is employed as a second operator in the process of reproduction to prevent the optimisation problem resulting in a local solution. There is a need for selection of the mutation rate; although it reduces the convergence speed, it ensures a global solution is achieved [32]. A mutation rate of 0.2 is selected in the optimisation process in this study. This mutation rate is chosen so as to achieve a global solution of the objective function.
4.4. Convergence Check
Convergence is utilised to ensure the termination criterion of a numerical simulation is achieved. In this study, 200 is used as the maximum number of generations to achieve algorithm convergence. Selection of the number of generations is a critical point in the GA as this has a considerable effect on the convergence of the procedure as well as ensuring a reasonable computing time for the solution to converge. The indicated power is the objective and for the last 20 generations, the fixed negligible/small differences in the indicated power are used as a termination criterion for the computation prior to reaching the maximum number of generations. At this point, in case no convergence is achieved, the fitness selection process produces a new generation by forming a population of chromosomes. To avoid quantitative limitations and reduce computing time, the continuous or real value GA optimisation code, where variables are expressed as single floating-point numbers, was modified and used in this study [34].
Energies2019,12, 72 10 of 17
[image:10.595.154.438.85.379.2]Energies 2018, 11, x FOR PEER REVIEW 10 of 17
Figure 3. Flow chart of the genetic algorithm procedure.
5. Results and Discussion
5.1. Validation
The developed quasi-steady model is investigated with the parameters of the RE-1000 FPSE obtained from Urieli and Berchowitz [31]. The results obtained show good agreement with the experimental data in terms of amplitude ratio, phase angle and output power. Validation of the developed model was conducted previously and the percentage error in the output power prediction, phase angle and amplitude ratio prediction was 0.4%, 4.7% and 36%, respectively [18].
The output results from the numerical simulation describing the performance of the FPSE are presented in this section. The input parameters used are those of the RE-1000 Sunpower FPSE listed in Table 1, while the values of the heater and cooler temperatures are set as 814.3 K and 322.8 K, respectively, including a maximum pressure of 7.1 MPa and helium as the working fluid.The pressures and volumes are shown in Table 4. The variation of pressure is between 7.25 MPa and 6.75 MPa including volumes (expansion and compression) between 0.3x10⁻⁴ (m ) and 0.5x10⁻⁴ (m ). From this, the indicated cyclic work done and output power is 33.2 J and 996 W, respectively, with thermal efficiency of 23%.
Table 4. Results from the numerical simulation of the FPSE.
Parameters Maximum Minimum
Pressure (MPa) 7.25 6.75
Bounce Pressure (MPa) 7.01 6.99
Volume (m3 ) 0.00003 0.00005
Piston Velocity (ms−1) 1.36 −1.33
[image:10.595.187.409.656.734.2]Displacer Velocity (ms−1) 1.29 −1.30
Figure 3.Flow chart of the genetic algorithm procedure.
5. Results and Discussion
5.1. Validation
The developed quasi-steady model is investigated with the parameters of the RE-1000 FPSE obtained from Urieli and Berchowitz [31]. The results obtained show good agreement with the experimental data in terms of amplitude ratio, phase angle and output power. Validation of the developed model was conducted previously and the percentage error in the output power prediction, phase angle and amplitude ratio prediction was 0.4%, 4.7% and 36%, respectively [18].
The output results from the numerical simulation describing the performance of the FPSE are presented in this section. The input parameters used are those of the RE-1000 Sunpower FPSE listed in Table1, while the values of the heater and cooler temperatures are set as 814.3 K and 322.8 K, respectively, including a maximum pressure of 7.1 MPa and helium as the working fluid. The pressures and volumes are shown in Table4. The variation of pressure is between 7.25 MPa and 6.75 MPa including volumes (expansion and compression) between 0.3 × 10⁻⁴ (m3) and 0.5 × 10⁻⁴ (m3). From this, the indicated cyclic work done and output power is 33.2 J and 996 W, respectively, with thermal efficiency of 23%.
Table 4.Results from the numerical simulation of the FPSE.
Parameters Maximum Minimum
Pressure (MPa) 7.25 6.75
The bounce space pressure in the piston compartment is shown in Table4. The maximum pressure is 7.01 MPa and minimum pressure is 6.99 MPa; the average is equal to the mean working pressure in the engine as it satisfies the assumptions made in the model development. The variation in velocity of the displacer and piston is also shown, where it can be observed that the displacer and piston have maximum velocities of 1.29 ms−1and 1.36 ms−1and minimum velocities of−1.30 ms−1and −1.33 ms−1, respectively.
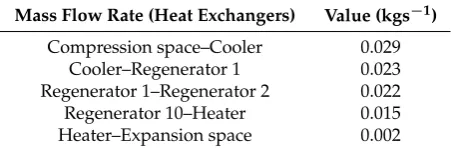
The mass flow rate in the heat exchangers is shown in Table5. It is worth noting the flow of the working gas and its movement from the work spaces to the heat exchangers and vice versa as the gas is being acted upon by the forces from the oscillatory movement of the piston and displacer. The flow of gas from the compression space to the cooler shows the highest flow rate of 0.029 kgs−1, due to the
increase in the compression space pressure, Pc, as the working gas is acted upon by forces from the
[image:11.595.185.411.417.492.2]piston and displacer. Next, the mass flow rate of the working gas at 0.023 kgs−1from the cooler to the first part of the regenerator shows the reduction in the flow of gas from the cooler to the first part of the regenerator due to the reduction in pressure and temperature of the working gas. The mass flow rate is also observed from the first to the second part of the regenerator with a flow rate of 0.022 kgs−1; the flow rate is not too different from the flow rate between the cooler to the first part of the regenerator, although this depicts a transition in the flow of the working gas between the chambers. The tenth part of the regenerator to the heater has a mass flow rate of 0.015 kgs−1which shows a gradual reduction in the flow of the working gas as it approaches the expansion space, while the heater to the expansion space exhibits a mass flow rate of 0.002 kgs−1. Nevertheless, it is worth considering the flow of working gas volume in the work spaces and heat exchangers as this can give a clearer understanding of the transfer of working gas within the chambers during engine operation.
Table 5.Mass flow rate in the heat exchangers.
Mass Flow Rate (Heat Exchangers) Value (kgs−1)
Compression space–Cooler 0.029 Cooler–Regenerator 1 0.023 Regenerator 1–Regenerator 2 0.022 Regenerator 10–Heater 0.015 Heater–Expansion space 0.002
5.2. Optimisation Result
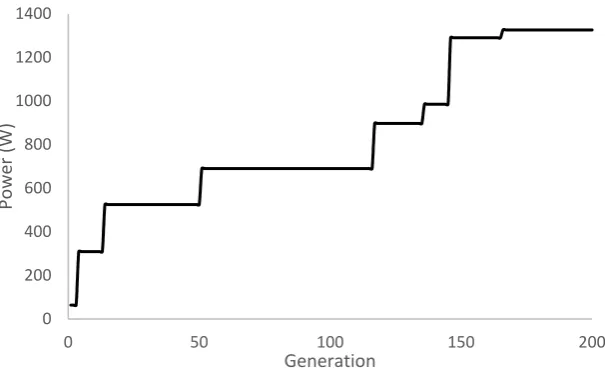
According to the optimisation procedure, the solution of the objective could be achieved with the selected constrained range (upper and lower limits) of design parameters in Table3by using an adequate global search method; hence, the consideration of the GA to optimise the design parameters of the FPSE so as to maximise the power output. Figure 4shows the variation in the indicated power of the engine over the stipulated number of generations. The termination criterion was achieved at the 180th generation; however, the indicated power increased significantly from the first few generations.
Energies2019,12, 72 12 of 17
[image:12.595.147.450.88.274.2]Energies 2018, 11, x FOR PEER REVIEW 12 of 17
Figure 4. Optimal value of output power for each generation.
[image:12.595.95.503.428.513.2]To achieve this, the population of 30 was selected with mutation and selection rate of 0.2 and 0.5, respectively. The objective function was achieved with the optimal values of six parameters at the 180th generation. From Table 6, it can be observed that the length of the heater increased considerably while the length of the regenerator and cooler were reduced. This is suitable for the real engine as the heater could provide a more sufficient heating surface area and optimise heat transfer to the working fluid, while the regenerator improves the thermal efficiency and the cooler reduces the thermal losses in the engine from the newly selected geometry design.
Table 6. The design parameters obtained from GA optimisation procedure.
Engine parameter Parameters of the RE-1000 FPSE Optimal Engine Parameter
Length of heater 0.1834 m 0.3 m
Length of cooler 0.0792 m 0.068 m
Length of regenerator 0.065 m 0.043 m
Piston damping 461.5 Ns/m 602 Ns/m
Displacer damping 35.34 Ns/m 78.2 Ns/m
Porosity of regenerator matrix 0.759 0.69
However, as a result of the reduction in the length of the cooler and regenerator, and porosity of the regenerator matrix, there is a 33% increase in the value of the indicated power from the new design parameters obtained from the GA algorithm. The new design parameters were used as input in the simulation of the quasi-steady model of the FPSE and the indicated output power generated corresponds to the 1326 W obtained from the GA.
In order to verify the outputs from the optimisation procedure, a parametric check of the selected engine design parameters was carried out (Figures 5–7) to show the sensitivity of the indicated output power to the selected design parameters. It can be observed in Figure 5a,b that the power output rises to a maximum with the increase in displacer and piston damping and reduces drastically thereafter. This is a result of the excess additional load added to the piston and displacer masses which causes increased dead volume followed by the rapid reduction in the output power. In Figure 6a,b, the increase in the length of the heater and cooler results in an increase of the power output followed by a rapid reduction, due to the dead volume and frictional losses in both. Similar patterns are observed in Figure 7a,b, where the power rises to a maximum with the increase in the length of the regenerator and porosity, then reduces drastically afterwards. This is a result of the increased heat transfer area and dead volume, which are proportional to the frictional and thermal losses in the regenerator chamber. Similar findings were reported in [27] where the GA was used to optimise a low-temperature Stirling engine.
0 200 400 600 800 1000 1200 1400
0 50 100 150 200
Power (W)
Generation
Figure 4.Optimal value of output power for each generation.
To achieve this, the population of 30 was selected with mutation and selection rate of 0.2 and 0.5, respectively. The objective function was achieved with the optimal values of six parameters at the 180th generation. From Table6, it can be observed that the length of the heater increased considerably while the length of the regenerator and cooler were reduced. This is suitable for the real engine as the heater could provide a more sufficient heating surface area and optimise heat transfer to the working fluid, while the regenerator improves the thermal efficiency and the cooler reduces the thermal losses in the engine from the newly selected geometry design.
Table 6.The design parameters obtained from GA optimisation procedure.
Engine parameter Parameters of the RE-1000 FPSE Optimal Engine Parameter
Length of heater 0.1834 m 0.3 m
Length of cooler 0.0792 m 0.068 m
Length of regenerator 0.065 m 0.043 m
Piston damping 461.5 Ns/m 602 Ns/m
Displacer damping 35.34 Ns/m 78.2 Ns/m
Porosity of regenerator matrix 0.759 0.69
However, as a result of the reduction in the length of the cooler and regenerator, and porosity of the regenerator matrix, there is a 33% increase in the value of the indicated power from the new design parameters obtained from the GA algorithm. The new design parameters were used as input in the simulation of the quasi-steady model of the FPSE and the indicated output power generated corresponds to the 1326 W obtained from the GA.
(a) (b)
Figure 5. (a) Indicated power vs. piston damping; (b) Indicated power vs. displacer damping.
[image:13.595.94.504.321.512.2](a) (b)
Figure 6.(a) Indicated power vs. length of heater; (b) Indicated power vs. length of cooler.
(a) (b)
Figure 7.(a) Indicated power vs. length of regenerator; (b) Indicated power vs. regenerator porosity.
0 200 400 600 800 1000 1200 1400
0 500 1000
Power (W)
Piston damping (Nsm-1) 602 Nsm-1
0 200 400 600 800 1000 1200 1400
0 50 100
Power (W)
Displacer damping (Nsm-1) 78.2 Nsm-1
400 500 600 700 800 900 1000 1100 1200 1300 1400
0.1 0.3 0.5
Power (W)
Length of heater (m) 0.3 m 500 600 700 800 900 1000 1100 1200 1300 1400
0.001 0.051 0.101
Power (W)
Length of cooler (m) 0.068 m 600 700 800 900 1000 1100 1200 1300 1400
0.01 0.06 0.11
Power (W)
Length of regenerator (m) 0.043 m 300 500 700 900 1100 1300 1500
0.2 0.4 0.6 0.8 1
Power (W)
[image:13.595.83.511.542.742.2]Regenerator porosity 0.69
Figure 5.(a) Indicated power vs. piston damping; (b) Indicated power vs. displacer damping.
(a) (b)
Figure 5. (a) Indicated power vs. piston damping; (b) Indicated power vs. displacer damping.
(a) (b)
Figure 6.(a) Indicated power vs. length of heater; (b) Indicated power vs. length of cooler.
(a) (b)
Figure 7.(a) Indicated power vs. length of regenerator; (b) Indicated power vs. regenerator porosity.
0 200 400 600 800 1000 1200 1400
0 500 1000
Power (W)
Piston damping (Nsm-1) 602 Nsm-1
0 200 400 600 800 1000 1200 1400
0 50 100
Power (W)
Displacer damping (Nsm-1) 78.2 Nsm-1
400 500 600 700 800 900 1000 1100 1200 1300 1400
0.1 0.3 0.5
Power (W)
Length of heater (m) 0.3 m 500 600 700 800 900 1000 1100 1200 1300 1400
0.001 0.051 0.101
Power (W)
Length of cooler (m) 0.068 m 600 700 800 900 1000 1100 1200 1300 1400
0.01 0.06 0.11
Power (W)
Length of regenerator (m) 0.043 m 300 500 700 900 1100 1300 1500
0.2 0.4 0.6 0.8 1
Power (W)
Regenerator porosity 0.69
Figure 6.(a) Indicated power vs. length of heater; (b) Indicated power vs. length of cooler.
(a) (b)
Figure 5. (a) Indicated power vs. piston damping; (b) Indicated power vs. displacer damping.
(a) (b)
Figure 6.(a) Indicated power vs. length of heater; (b) Indicated power vs. length of cooler.
(a) (b)
Figure 7.(a) Indicated power vs. length of regenerator; (b) Indicated power vs. regenerator porosity.
0 200 400 600 800 1000 1200 1400
0 500 1000
Power (W)
Piston damping (Nsm-1) 602 Nsm-1
0 200 400 600 800 1000 1200 1400
0 50 100
Power (W)
Displacer damping (Nsm-1) 78.2 Nsm-1
400 500 600 700 800 900 1000 1100 1200 1300 1400
0.1 0.3 0.5
Power (W)
Length of heater (m) 0.3 m 500 600 700 800 900 1000 1100 1200 1300 1400
0.001 0.051 0.101
Power (W)
Length of cooler (m) 0.068 m 600 700 800 900 1000 1100 1200 1300 1400
0.01 0.06 0.11
Power (W)
Length of regenerator (m) 0.043 m 300 500 700 900 1100 1300 1500
0.2 0.4 0.6 0.8 1
Power (W)
Regenerator porosity 0.69
Energies2019,12, 72 14 of 17
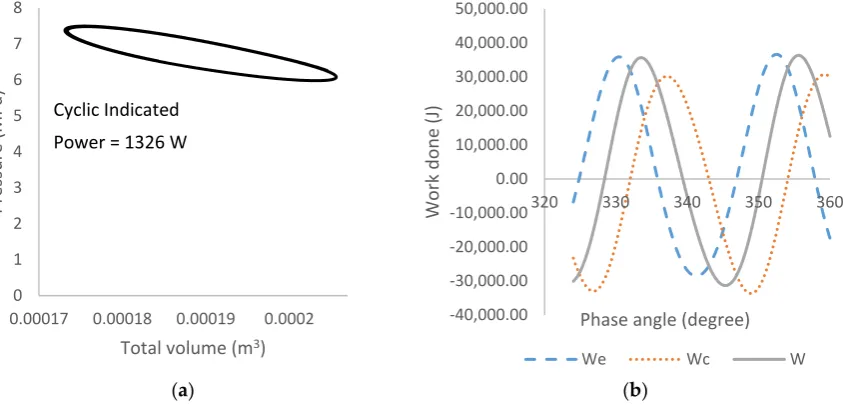
From the outputs generated, this shows that GA application is a good precision tool for determining the optimal value of the FPSE’s design parameters; however, it is difficult to locate the exact point at which the maximum power could be achieved. To clarify this, the pressure-to-volume diagram and the work done in the expansion and compression spaces, indicating the optimised output performance of the newly selected design parameters, are shown in Figure8a,b, which illustrate the pressure-to-volume diagram and the work done in the compression and expansion spaces, including the total work done. It can be observed that the pressure variation is between 7.47 MPa and 6.0 MPa with volumes of expansion and compression spaces between 0.000174 m3and 0.000206 m3. The cyclic work done, shown in Figure8b, indicates an increase in total work done (WT) to 44.2 J, resulting in
output power of 1326 W with thermal efficiency of 27%. Unlike this study where the major design parameters of the heat exchangers are considered, including the damping of the piston and displacer in order to maximise the power output of the engine, the GA application was applied to minimise the objective function of the FPSE with selected parameters such as the masses and stiffnesses of the piston and displacer, including the cross-sectional area of the displacer, as was reported in [29]. It can be observed that the prediction of the GA algorithm on the engine performance is sufficiently close and the accuracy was confirmed with the newly selected parameters used as inputs, the results of which are shown in the P-V diagram in Figure8a. Hence, the applicability of the GA for optimisation has proved to be an effective tool and can be utilised for design purposes to improve the output performance of the FPSE.
Energies 2018, 11, x FOR PEER REVIEW 14 of 17
[image:14.595.90.512.356.560.2](a) (b)
Figure 8. (a) Pressure-to-volume diagram of the optimal solution of the FPSE; (b) Work done in the optimal solution of the FPSE.
From the outputs generated, this shows that GA application is a good precision tool for determining the optimal value of the FPSE’s design parameters; however, it is difficult to locate the exact point at which the maximum power could be achieved. To clarify this, the pressure-to-volume diagram and the work done in the expansion and compression spaces, indicating the optimised output performance of the newly selected design parameters, are shown in Figures 8a,b, which illustrate the pressure-to-volume diagram and the work done in the compression and expansion spaces, including the total work done. It can be observed that the pressure variation is between 7.47 MPa and 6.0 MPa with volumes of expansion and compression spaces between 0.000174 m3 and 0.000206 m3. The cyclic work done, shown in Figure 8b, indicates an increase in total work done (WT) to 44.2 J, resulting in output power of 1326 W with thermal efficiency of 27%. Unlike this study where the major design parameters of the heat exchangers are considered, including the damping of the piston and displacer in order to maximise the power output of the engine, the GA application was applied to minimise the objective function of the FPSE with selected parameters such as the masses and stiffnesses of the piston and displacer, including the cross-sectional area of the displacer, as was reported in [29]. It can be observed that the prediction of the GA algorithm on the engine performance is sufficiently close and the accuracy was confirmed with the newly selected parameters used as inputs, the results of which are shown in the P-V diagram in Figure 8a. Hence, the applicability of the GA for optimisation has proved to be an effective tool and can be utilised for design purposes to improve the output performance of the FPSE.
6. Conclusions
A novel framework for the design and optimisation of the FPSE using second-order quasi-steady modelling and the GA was developed and implemented in this study. The design variables employed for the optimisation of the FPSE based on output power are features of the heat exchangers, such as length and diameter including the regenerator porosity. The piston and displacer damping coefficients are included as they present difficulty in achieving the stable operation of the FPSE. Although application of the GA to the developed model using the operating conditions of the RE-1000 FPSE requires significant computing time to converge, the new set of design parameters generated produced quite a noticeable increment in the output power and efficiency of the engine. The quasi-steady model developed in this study, considering the thermal losses, control volumes, characteristic of the working gas and the engine’s geometry, gives an improved description of the working process. The control volumes of the engine divided into 14 parts, including the regenerator parts and matrix divided into 10, indicated the temperature variation between the working gas and the chamber walls of the heat exchangers and work spaces
0 1 2 3 4 5 6 7 8
0.00017 0.00018 0.00019 0.0002
Pressure (MPa)
Total volume (m3)
-40,000.00 -30,000.00 -20,000.00 -10,000.00 0.00 10,000.00 20,000.00 30,000.00 40,000.00 50,000.00
320 330 340 350 360
Work
d
one
(J)
Phase angle (degree)
We Wc W
Cyclic Indicated Power = 1326 W
Figure 8.(a) Pressure-to-volume diagram of the optimal solution of the FPSE; (b) Work done in the optimal solution of the FPSE.
6. Conclusions
10, indicated the temperature variation between the working gas and the chamber walls of the heat exchangers and work spaces for accurate description. Validation of the developed model with the experimental output shows good agreement in terms of output power and amplitude ratio of the piston and displacer. The GA optimisation procedure improved the performance of the FPSE from work done and output power of 33.2 J and 996 W, respectively, with thermal efficiency of 23%, to 44.2 J and 1326 W, respectively, with thermal efficiency of 27%. The second-order quasi-steady model of the FPSE developed in this study is coupled with the GA optimisation code to maximise the objective function. The output results from the optimisation solution produced a new set of design parameters for the engine, which when used in the developed model resulted in a measurable improvement in performance. Hence, this method can be employed by manufacturers for designing optimised FPSE performance.
Author Contributions:Conceptualization, A.S. and A.J.K.; Methodology A.S.; Software, A.S.; Validation, A.S., A.J.K. and E.J.A.; Formal Analysis, A.S., A.J.K. and E.J.A.; Investigation, A.S. and A.J.K.; Resources, A.S.; Data Curation, A.S.; Writing-Original Draft Preparation, A.S., A.J.K. and E.J.A.; Visualization, E.J.A.; Supervision, E.J.A.; Project Administration, A.S. and A.J.K.; Funding Acquisition, A.J.K.
Funding:This research received no external funding.
Conflicts of Interest:The authors declare no conflict of interest.
Nomenclature
Ad Cross-sectional area of the piston (m2)
Ap Cross-sectional area of the displacer (m2)
Cap Specific heat at constant pressure (J/kg K)
Cav Specific heat at constant volume (J/kg K)
K Kelvin
k Thermal conductivity (W/m K)
md Mass of the displacer(kg)
mp Mass of the piston(kg)
Lh Length of heater (m)
Lk Length of cooler (m)
Lr Length of regenerator (m)
Poros Regenerator porosity
Tk Temperature of the cooler (K)
Tr Temperature of the regenerator (K)
Th Temperature of the heater (K)
Tck Temperature of the compression space to cooler (K)
The Temperature of the heater to expansion space (K)
Trh Temperature of the regenerator to heater (K)
Tkr Temperature of the cooler to regenerator (K)
Vb Bounce space volume (m3)
Vr Volume of the regenerator(m3)
Vh Volume of the heater (m3)
Vk Volume of the cooler (m3)
Ve Volume of the expansion space (m3)
Vc Volume of the compression space (m3) ϕ Phase angle (degrees)
Vclc Compression space clearance volume (m3)
Vcle Expansion space clearance volume (m3)
Vsp Piston swept volume (m3)
Vsd Displacer swept volume(m3)
R Gas constant value (J/mol·K)
d Derivative
Energies2019,12, 72 16 of 17
Pc Pressure in compression space (MPa)
Varnu Number of variables
Popnum Number of chromosomes
val Value of chromosomes
maxvalue Maximum value of chromosomes
Nsc Number of survival chromosomes
Srate Selection rate
Ngen Number of generation GA Genetic Algorithm
References
1. Rogdakis, E.D.; Bormpilas, N.A.; Koniakos, I.K. A thermodynamic study for the optimization of stable operation of free piston Stirling engines.Energy Convers. Manag.2004,45, 575–593. [CrossRef]
2. Mikalsen, R.; Roskilly, A.P. Performance simulation of a spark ignited free-piston engine generator.
Appl. Therm. Eng.2008,28, 1726–1733. [CrossRef]
3. Mao, J.; Zuo, Z.; Li, W.; Feng, H. Multi-dimensional scavenging analysis of a free-piston linear alternator based on numerical simulation.Appl. Energy2011,88, 1140–1152. [CrossRef]
4. Zhang, C.; Li, K.; Sun, Z. Modeling of piston trajectory-based HCCI combustion enabled by a free piston engine.Appl. Energy2015,139, 313–326. [CrossRef]
5. Riofrio, J.A.; Al-Dakkan, K.; Hofacker, M.E.; Barth, E.J. Control-based design of free-piston stirling engines. In Proceedings of the 2008 American Control Conference, Seattle, WA, USA, 11–13 June 2008; pp. 1533–1538. 6. Sowale, A.; Kolios, A.; Jiang, Y.; Somorin, T.; Anastasopoulou, A.; Anthony, E.J.; Fidalgo, B.; Parker, A.; McAdam, E.; Williams, L.; et al. Thermodynamic analysis of a gamma type Stirling engine in an energy recovery system.Energy Convers. Manag.2018,165, 528–549. [CrossRef] [PubMed]
7. Mou, J.; Hong, G. Startup mechanism and power distribution of free piston Stirling engine.Energy2017,
123, 655–663. [CrossRef]
8. Remiorz, L.; Kotowicz, J.; Uchman, W. Comparative assessment of the effectiveness of a free-piston Stirling engine-based micro-cogeneration unit and a heat pump.Energy2018,148, 134–147. [CrossRef]
9. Sowale, A.; Odofin, S. Regenerator Losses in Free Piston Stirling Engines. In Proceedings of the International Conference on Leadership, Innovation and Entrepreneurship, Dubai, UAE, 20–22 April 2016.
10. Altin, M.; Okur, M.; Ipci, D.; Halis, S.; Karabulut, H. Thermodynamic and dynamic analysis of an alpha type Stirling engine with Scotch Yoke mechanism.Energy2018,148, 855–865. [CrossRef]
11. Sowale, A. Modelling and Optimisation of a Free Piston Stirling Engine for Micro-CHP Applications. Ph.D. Thesis, Northumbria University, Newcastle upon Tyne, UK, 2015.
12. Formosa, F.; Frechette, L.G. Scaling laws for free piston Stirling engine design: Benefits and challenges of miniaturization.Energy2013,57, 796–808. [CrossRef]
13. Wu, W.; Hu, J.; Shihua, Y. Semi-analytical modelling of a hydraulic free-piston engine.Appl. Energy2014,
120, 75–84. [CrossRef]
14. Jia, B.; Tian, G.; Feng, H.; Zuo, Z.; Roskilly, A.P. An experimental investigation into the starting process of free-piston engine generator.Appl. Energy2015,157, 798–804. [CrossRef]
15. Jia, B.; Smallbone, A.; Feng, H.; Tian, G.; Zuo, Z.; Roskilly, A.P. A fast response free-piston engine generator numerical model for control applications.Appl. Energy2016,162, 321–329. [CrossRef]
16. Xiao, J.; Qingfeng, L.; Huang, Z. Motion characteristic of a free piston linear engine. Appl. Energy2010,
87, 1288–1294. [CrossRef]
17. Yang, Q.; Luo, E.; Dai, W.; Yu, G. Thermoacoustic model of a modified free piston Stirling engine with a thermal buffer tube.Appl. Energy2012,90, 266–270. [CrossRef]
18. Sowale, A.; Kolios, A. Thermodynamic Performance of Heat Exchangers in a Free Piston Stirling Engine.
Energies2018,11, 505. [CrossRef]
20. Kim, J.; Bae, C.; Kim, G. Simulation on the effect of the combustion parameters on the piston dynamics and engine performance using the Wiebe function in a free piston engine.Appl. Energy2013,107, 446–455. [CrossRef]
21. Chaudhari, P.D.; Chordiya, S.G.; Borade, S.S.; Adsul, P.B.; Patil, R.S. Waste Heat Recovery of IC Engine using Stirling Engine.Int. J. Curr. Eng. Technol.2016.
22. Kolios, A.; Somorin, Y.J.T.; Sowale, A.; Anastasopoulou, A.; Anthony, E.J.; Fidalgo, B.; Parker, A.; McAdam, E.; Williams, L.; Collins, M.; et al. Probabilistic performance assessment of complex energy process systems—The case of a self-sustained sanitation system.Energy Convers. Manag.2018,2018, 74–85. [CrossRef]
23. Yu, Y.; Yuan, Z.; Ma, J.; Li, S. Design and simulation of exhaust gas waste heat recovery system of gasoline engine based on Stirling cycle. In Proceedings of the International Conference on Materials for Renewable Energy and Environment, Chengdu, China, 19–21 August 2014.
24. Aladayleh, W.; Alahmer, A. Recovery of Exhaust Waste Heat for ICE Using the Beta Type Stirling Engine.
J. Energy2015,2015, 495418. [CrossRef]
25. Onabanjo, T.; Patchigolla, K.; Wagland, S.T.; Fidalgo, B.; Kolios, A.; McAdam, E.; Parker, A.; Williams, L.; Tyrrel, S.; Cartmell, E. Energy recovery from human faeces via gasification: A thermodynamic equilibrium modelling approach.Energy Convers. Manag.2016,118, 364–376. [CrossRef]
26. Jurado, N.; Somorin, T.; Kolios, A.J.; Wagland, S.; Patchigolla, K.; Fidalgo, B.; Parker, A.; McAdam, E.; Williams, L.; Tyrrel, S. Design and commissioning of a multi-mode prototype for thermochemical conversion of human faeces.Energy Convers. Manag.2018,163, 507–524. [CrossRef] [PubMed]
27. Kraitong, K.; Mahkamov, K. Optimisation of Low Temperature Difference Solar Stirling Engines using Genetic Algorithm. In Proceedings of the World Renewable Energy Congress—Sweden, Linköping, Sweden, 8–13 May 2011.
28. Boucher, J.; Lanzetta, F.; Nika, P. Optimization of a dual free piston Stirling engine.Appl. Therm. Eng.2007,
27, 802–811. [CrossRef]
29. Zare, S.; Tavakolpour-Saleh, A.R. Frequency-based design of a free piston Stirling engine using genetic algorithm.Energy2016,109, 466–480. [CrossRef]
30. Kraitong, K. Numerical Modelling and Design Optimisation of Stirling Engines for Power Production. Ph.D. Thesis, Northumbria University, Newcastle upon Tyne, UK, 2012.
31. Urieli, I.; Berchowitz, D.M.Stirling Cycle Engine Analysis; A. Hilger: Bristol, UK, 1984.
32. Haupt, S.E.; Haupt, R.L.Practical Genetic Algorithms; John Wiley & Sons, Inc.: Hoboken, NJ, USA, 2004. 33. Zalzala, A.M.S.; Flemming, P.J.Genetic Algorithms in Engineering Systems; Institution of Electrical Engineers:
London, UK, 1997.
34. Shopova, E.G.; Vaklieva-Bancheva, N.G. BASIC—A genetic algorithm for engineering problems solution.
Comput. Chem. Eng.2006,30, 1293–1309. [CrossRef]

![Table 1. Parameters of the RE-1000 Sunpower FPSE used in this study [11,31].](https://thumb-us.123doks.com/thumbv2/123dok_us/1416865.94485/7.595.184.409.107.307/table-parameters-sunpower-fpse-used-study.webp)