AN ICT COST COMPARISON OF DIFFERENT MARKET STRUCTURES FOR
DISTRIBUTED ANCILLARY SERVICES
Pirkko KUUSELA, Pekka KOPONEN Ivana KOCKAR, Han XU
VTT, Technical Research Centre of Finland – Finland University of Strathclyde – UK [email protected],[email protected] [email protected],[email protected]
ABSTRACT
Future energy ecosystems need new market structures and interactions between TSO and DSOs, in order to realise distributed ancillary services. This paper estimates and compares ICT costs of several TSO-DSO coordination and market aggangements proposed in the SmartNet project. A hybrid cost estimation methodology, which utilises constructive cost model methodology, expert estimates, a national DSO regulation model, and implementation of a simulator, is employed to estimate the development costs of aggregation and market clearing systems needed to realise the market schemes. ICT costs of different arrangements turn out to be at the same level and they are minor in comparison to energy-related costs. However, depending on the overall design of the markets for distributed flexibility, aggregators may have the largest ICT costs and investment needs.
INTRODUCTION
In the future power systems, the power generation, flexibility etc. will come from distributed resources, and power will be supplied from varying renewable sources. The provision of decentralized Ancillary Services (AS) to power grids is considered necessary, in order to avoid excessive costs, inadequate resilience, and negative environmental impacts.
The EU-H2020 project SmartNet [1] develops, analyses and compares new market architectures that enable distributed AS. The project focus is on frequency restoration and congestion management type automated AS and related Transmission System Operator (TSO) -Distribution System Operator (DSO) interactions. All developed and studied approaches are based on nearly real time market clearing tightly connected to power flow calculations.
The benefits of the different approaches to the energy system have been compared by performing extensive simulations described in [2]. In addition, Information and Communications Technology (ICT) costs have been estimated and compared for each approach. This paper explains the approach and results of this ICT cost analysis. The results of this paper are used as input to a cost-benefit analysis presented in [3].
One assumption of the project is that by 2030 there will be a centralized market, where TSO will procure flexibility for ancillary services offered by Distributed Energy Resources (DERs) in transmission and distribution
networks. This acts as a reference Coordination Scheme (CS A - centralized market). The project also examines how this market arrangement and/or TSO-DSO coordination can be tuned/updated to be more effective (i.e. less curtailment and balancing costs). Therefore, local markets (CS B), shared balancing responsibility market (CS C) and common TSO-DSO market (CS D1-centralized version and CS D2 - deD1-centralized version) are proposed as well. These coordination schemes are described in detail in [4] and shortly in [3]. The SmartNet project has selected Italy, Spain and Denmark to be national cases in which all CSs are simulated in scenarios representing national energy ecosystem in 2030.
Cost estimation task
The main goals of the ICT costs estimation are: (i) to discover differences in terms of ICT costs between updating alternative CSs based on CS A, under the assumption that CS A has been implemented by 2030 ; and (ii) to estimate the ICT costs to update the baseline CS A to each proposed CS variant in the three national cases.
Restriction of scope
This ICT cost estimation involves large uncertainties on technology development and cost variation, since energy markets and grids are developing currently and the target year 2030 is rather far, at least from the ICT development cycle point of view. Reviewing several cost-benefit analyses in the context of smart meter deployment indicate that ICT experts have different views of costs even in the near future [5]. Thus, the focus of the analysis will be on issues that can make differences between CSs. The systems and communications, which are not directly related to CSs, are left outside the scope of this analysis. The analysed market arrangements require custom made IT systems that solve aggregation, market clearing tasks, and advanced optimization, such systems are one of a kind and their costs are likely to vary a lot. In general, the purchase cost of ICT is subject to a few factors, e.g. market opportunity, cost estimate uncertainty, contractual terms, requirements volatility, and financial health [6]. Therefore, this paper compares development costs of Information Technology (IT) systems needed in different market arrangements.
that existing communication channels between TSO, DSO and aggregators can accommodate the communications needed in all CSs. Further, existing infrastructure, such as machine rooms, is assumed to be available for CS use. Differences in CSs appear in aggregation to DSO or TSO level, and the markets are cleared differently. SmartNet project analyses CSs in typical energy grid and market situations. Therefore, abnormal events are not considered in this analysis. The proposed CSs may not cope equally well in abnormal events relating to major disturbances in the technical system operation or failures in the operation of the markets for electricity and ancillary services. Thus their ICT costs may differ due to different needs for mitigating measures.
Contribution of the paper
This paper presents a holistic methodology to estimate the costs of ICT systems needed in implementing or upgrading different TSO-DSO market arrangements by utilising various types of information as input. According to the best of our knowledge, no similar approach has been applied before in such a context. However, we believe that the approach could be applied to various development and research projects.
In this paper, estimation methodology together with cost information sources are described in METHODOLOGY section followed by sections for results and conclusions.
METHODOLOGY
Constructive Cost Model (COCOMO)
Estimation of work efforts needed to implement IT systems is generally very difficult. According to the software engineering literature [6], the software development can be estimated to consist of 15% of analysis, 25% of design, 20% of coding, 30% of testing, and 10% of documentation. There are some functional methods to derive approximate estimates of software development efforts, and the results of these methods therefore contain a large uncertainty. One of the classic and the best-known methods is the Constructive Cost Model (COCOMO) [7], which estimates the number of Person Months (PM) needed for IT system implementation as a function of source code lines:
= ( ) ,
where KLOC stands for thousand (kilo) lines of source code and a, b are adjustable parameters. The adjustable parameters depend on the IT system environment. In an embedded system, where there exits other hardware, software, regulation and operational procedures, the suggested values are a=3.6 and b= 1.2 [6]. This environment corresponds best to the environment of TSO-DSO coordination schemes developed in SmartNet. There are more advanced COCOMO versions and other methods, but those were not considered to be feasible in the context of SmartNet project and resources. Nevertheless, the simple COCOMO model expresses well the fact that the development efforts depend exponentially on application
conditions. For example, IT systems for critical infrastructures are much more expensive, as the testing and validation require more efforts and care [6].
The simple COCOMO method estimation needs to be adjusted for the CS cost estimation, because COCOMO is applied to the SmartNet simulator implementation, which is not equivalent to a full IT system.
Three modifications on the simple COCOMO model were made. Firstly, the complete full IT system is estimated to be four times as large as the SmartNet simulator work. This work is further divided as 25% of higher cost work by senior experts and 75% of lower cost work. Secondly, the objective of SmartNet was to bring technology from Technology Readiness Level (TRL) 2 to TRL 4-5. Although this objective has been achieved, TRL is still below the level of commercial applications (TRL 9). Therefore, further developments will be needed to validate CS candidates before they can be taken into use. It is assumed that validation simulator requires twice the effort of the SmartNet simulator, because it needs to be more comprehensive in terms of DSO networks and it should provide information on handling abnormal grid, market or ICT events as well. Lastly, the market clearings in the common TSO-DSO AS market models (CS D1 and CS D2) become critical and hence their costs increase. For example, the market clearing in CS D2 clears the market for the whole country at both TSO and DSO level. This CS does not allow local market clearing, so DSO resources are cleared in the centralized market. Highly fault tolerant and dependable market clearing solution is needed. This kind of software costs more due to increased efforts in validation and testing [6]. The criticality cost increase of the centralized version contains also efforts to make sure that a feasible market clearing solutions can be obtained for all time steps under various market/grid conditions.
Cost estimation information sources Simulator code
Comparison of TSO-DSO CSs is performed by simulations in the SmartNet project [2]. The simulator is implemented in Python and AMPL languages, and CPLEX solver is used to solve complex optimization problems. The simulation models describe flexible energy resources at a physical level from large units down to domestic white appliances and electric vehicles. The development of SmartNet simulator includes implementing aggregation algorithms for various types of resources and market clearing algorithms needed in the CSs. The simulator differs from the real-life system by utilising a common database for all the data. This implies that the simulator has fewer interfaces among different systems than in real life, so it reduces the amount of coding to some extent. However, the simulator contains a certain amount of data processing required for analysing the results.
is used to relate the SmartNet simulator implementation to work efforts estimates, and further to ICT costs. The ICT cost estimation utilises the numbers of simulator code lines for aggregations (36,000 lines) and market clearings (21,000 lines) as input.
The COCOMO method applied to the simulator code is the primary input for estimating work effort in creating aggregation and market clearing systems for real implementations in 2030.
Expert estimates
The SmartNet aggregation and market clearing components of the simulator were developed by six project partners. Four main partners provided estimates of required person months for real life implementations of aggregation and market clearing algorithms (i.e. to be utilised by commercial aggregators, DSOs, and TSOs in the future). It turned out that partners were optimistic about the work efforts required, which was expected to happen. However, the partners’ inputs gave valuable insight into splitting the total work efforts, derived from SmartNet simulator implementation via COCOMO, into subtasks of implementing the baseline CS A and updating that to future candidates (CS B, CS C, CS D1 and CS D2). Finnish DSO regulation model
The Finnish DSO regulation model includes minimum functional requirements and explicit upper bound costs for the general IT systems needed in distribution grid operation by the DSOs. According to the Finnish Energy Authority, the IT system cost estimation is based on a report by Empower Ltd., assessment of their field experts in 2010, as well as costs reported by DSOs. These estimates have been updated by the Finnish Energy Authority for the regulation period 2016- 2023 [8]. The IT system costs correspond to “traditional” systems that meet normal customer service requirements and fulfil functionalities required by laws and regulations.
This input serves as a collection of reference systems and a sanity checker in estimating costs. Although there are considerable differences between DSOs common IT systems and AS market arrangement solutions, the regulation model still may provide lower bound cost estimates.
A hybrid estimation process
In the hybrid cost estimation process, the first step is to estimate PM efforts based on the number of code lines in the SmartNet simulator by using the simple COCOMO method. Based on partner consultations, the work efforts are divided further into smaller tasks in order to estimate the effort of updating the centralized AS market (CS A) implementation to alternative coordination schemes (CS B, CS C, CS D1 and CS D2). At this point, adjustments explained in the cost estimation methodology section are performed as well. Finally, the costs for the baseline (CS A) and upgrades to four alternative schemes (CS B, CS C, CS D1 and CS D2) are calculated by estimating person month costs.
Cost model structure
Due to assuming that CS A will be in use in 2030 and the existing communications can be used for additional market messages, the ICT estimation reduces to estimating the costs of IT systems that are needed to perform different types of aggregations and market clearings. The CS A consists of IT systems for aggregating DERs to TSO AS market and the corresponding TSO market clearing. Those systems are assumed to exist. The cost estimation is two-fold: firstly, the implementation cost of IT systems in CS A is estimated as a reference and secondly, we estimate the costs to update from CS A to all proposed alternative CSs. We assume that there is a small number organizations developing and maintaining software for commercial aggragators, who aggregate DERs to various AS markets according to the CS structure. Furthermore, we assume that there will be a few service providers who implement the local markets in those CSs with local DSO AS markets. Cost elements
For CS B to CS D2 we calculate the costs for updating existing CS A to each alternative CS. The main cost elements for each CS are updating CS A for the new CS and the following IT systems
CS B: aggregation of DERs and bidding to local markets, implementation of local (DSO) AS markets, DSO smart aggregation and disaggregation implementation (see [4]) CS C: as CS B without DSO smart aggregation and disaggregation implementation
CS D1 and CS D2: aggregation of DERs and bidding to local markets, TSO-DSO common AS market, DSO smart aggregation (D2), interfaces and handling of DSO grid data (D1), solution for efficient computation of market clearing optimization (D1)
OPEX costs: OPEX costs are approximated to be 20% of the estimated investment costs.
Variables
The ICT cost model consists of a number of variables that can be split into four categories. The market clearing and aggregation categories are based on COCOMO work efforts estimation with simulator implementation data and expert estimates. A criticality category applies to CS D1 and CS D2, where market clearing becomes vital and hence more expensive. The DSO grid data category is derived by relating SmartNet systems to DSOs Network Information System and corresponding costs in the regulation model [8].
Parameters
The parameters of the cost model are:
• PM cost of a senior specialist :25,000€, • PM cost of a specialist: 22,000€,
• the number of aggregation solution developers: 3, and
• the number of service providers offering local AS markets: 3.
Reasons for the scope restriction
The questions of the last kilometer communications are left outside the scope of the cost estimation as they apply to each CS equally and predicting future developments is difficult. DER communication/activation costs may be too large for a profitable aggregation business.One should not assume that the development of smart metering and communications technologies will automatically solve the problem of cost-efficient DER control signal communications. Suitable cost-efficient technologies and business models already exist, but as market unbundling is a barrier for their wider utilisation, the regulation and minimum requirements may need further development, before lower cost communication technologies with adequate performance for AS are applied everywhere.
RESULTS
Currently, Italy has 638 DSOs, Spain has 397 DSOs, and Denmark has 66 DSOs. Cost estimates of the IT system development are in Net Present Value (NPV). The relation between development costs and purchase costs is complex, since purchase costs depend on politics, markets, and other issues, as explained in the introduction. Costs related to CSs other than CS D1 do not depend on the country. However, the centralized market clearing in CS D1 handles large amounts of DSO grid data and suffers from real time challenges. Therefore, its development cost is based on the amount of grid data and the number of nodes when solving the optimization problem for market clearing. This yields different cost estimates in Italy, Spain, and Denmark.
For an aggregator, the cost model estimates the IT system costs for aggregating flexibilities to the TSO market to be 13.5 M€ and the cost of updating the aggregation to bid in local markets to be 10.6 M€. The IT system cost of implementing TSO market clearing is estimated to be 5.1 M€. The cost of developing a platform service for local market clearings in the local AS market model is estimated to be as high as 11.3 M€. In shared balancing responsibility model (CS C) and in the common TSO-DSO market model (CS D2), the local market clearing costs are 6.1 M€ and 12.6 M€, respectively. In addition, the DSO aggregation implementation is included in the local AS market model (CS B) and the common TSO-DSO AS market model (CS D2). Note that updating aggregation to local markets can be more expensive than making the local market clearing service. In general, aggregators will have high costs due to the required complex IT systems.
The update costs of the centralized version of common TSO-DSO markets (CS D1) come from differences in implementing the centralized common market clearing. The costs for updating the centralized AS market implementation (CS A) to centralized common TSO-DSO markets (CS D1) are estimated to be 20.4 M€, 14.9 M€, and 7.5 M€ for Italy, Spain, and Denmark, respectively. Here it can be observed that the market clearing
implementation will be more expensive if the number of DSOs and grid nodes is larger. In a small country like Denmark, the centralized common market clearing will be an efficient solution and less challenging.
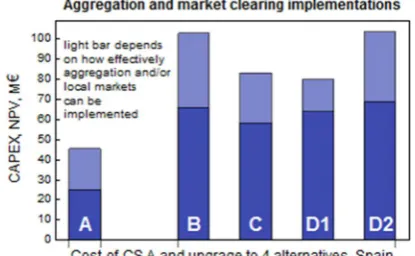
In each CS, estimates for higher and lower costs are calculated as costs boundaries depending on the implementation effectiveness of local aggregation and/or markets. If each aggregator and service provider will implement their own solution without any additional support, the costs are estimated to be the highest. However, if there will exist certain national supports in terms of algorithm development for advanced functionalities, such as DSO aggregation, and results will be available for all parties, the cost of implementing local market aggregation and market clearing will be lower. At the lowest total cost level, it is assumed that general purpose implementations can be achieved with a 50% increase to a single implementation cost.
[image:4.595.318.526.442.567.2]Illustrations of aggregation and market clearing costs in national cases are provided in Figures 1 -3. The implementation cost of the base line centralized AS market (CS A) is illustrated on the left and the additional update costs of the candidate coordination schemes (CS B, CS C, CS D1 and CS D2) are provided on the right. In the figures, the differences between the high and low estimates are illustrated by a lighter color. The light blue bar illustrates the effectiveness of implementing local actions as explained above.
Figure 1 Cost estimates of aggregation and market clearing implementations in Italy.
[image:4.595.318.526.606.734.2]Figure 3 Cost estimates of aggregation and market clearing implementations in Denmark.
Equivalent annuity costs
Equivalent annuity costs for an investment, I, can be calculated as:
= ( )
1−(1 + )
where NPV is the net present value,r is an interest rate, andn is number of period.
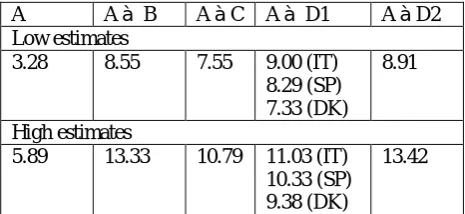
For a 10-year period with an interest rate of 5%, the annuity costs are presented in Table 1.
A Aà B AàC Aà D1 AàD2
Low estimates
3.28 8.55 7.55 9.00 (IT) 8.29 (SP) 7.33 (DK)
8.91
High estimates
5.89 13.33 10.79 11.03 (IT) 10.33 (SP) 9.38 (DK)
13.42
Table 1 Equivalent annuity costs in M€ with a 10-year period and 5% interest rate. Column A refers to the aggregation and market clearing implementation costs of CS A and subsequent columns refer to costs in updating CS A to an alternative CSs.
The investment duration coincides with the hold time of DSO network management systems in the Finnish DSO regulation model. Inflation rates for Italy, Denmark and Spain are estimated to be 1.7%, 0.8% and 1.7%, respectively1. The corresponding 10-year bond rates are
3.13%, 0.24% and 1.47%%, respectively2. This increases
to a conservative interest estimate of 5%.
CONCLUSIONS
Under the scope restrictions and the formulation of the ICT cost estimation problem, the main finding is that ICT costs in different market arrangements are almost the same
1 Data for November 2018 taken from: https://tradingeconomics.com/country-list/inflation-rate?continent=europe
2 Data taken from:
https://www.investing.com/rates-(subject to uncertainties). As ICT costs are minor in comparison to energy costs, they are not the key elements to consider in selecting AS market arrangements. See [3] and Figure 6 for energy related costs and benefits as well as for a combined energy-ICT cost-benefit analysis. Aggregators will have a large share of ICT costs. They will most likely be responsible for DER control signal communications and their software needs are considerable. The ICT cost analysis indicates that the aggregator IT systems will be the most expensive ones. In addition, the aggregators may need to modify aggregation algorithms in order to cope with changes in energy production, consumption, markets and regulations, and to offer competitive bids to markets.
Acknowledgments
We would like to express our sincere thanks to G. Leclercq and P. Sels of N-Side, Y. Vardanyan of DTU, and M. Rossi of RSE for their valuable inputs in the cost estimation work.
REFERENCES
[1] SmartNet project,http://smartnet-project.eu/ [2] M. Rossi, G. Viganò, G. Migliavacca, Y. Vardanyan,
R. Ebrahimy, G. Leclercq, P. Sels, M. Pavesi, T. Gueuning, J. Jimeno, N. Ruiz, G. Howorth, J. Camargo, C. Hermans, F. Spiessen, H.Svendsen 2019, “Testing TSO-DSO Interaction Schemes for the Participation of Distribution Energy Resources in the Balancing Market: the SmartNet Simulator”,
CIRED 2019, paper nº 1158 (unpublished).
[3] C. Madina, S. Riaño, I. Gómez, P. Kuusela, H. Aghaie, J. Jimeno, N. Ruiz, M. Rossi, G. Migliavacca, 2019, “Cost-Benefit Analysis of TSO-DSO Coordination to Operate Flexibility Markets”,
CIRED 2019, paper nº 1632 (unpublished).
[4] H. Gerard, E. I. Rivero and D. Six, 2018, “Coordination between transmission and distribution system operators in the electricity sector: A conceptual framework”,Utilities Policy, vol. 50, 40-48. DOI: 10.1016/j.juup.2017.09.011.
[5] SmartNet deliverable D4.3, 2019, “Cost-benefit analysis of the selected national cases” (to appear). [6] I. Sommerville, 2011, Software Engineering, 9th
edition, Pearson Education.
[7] B. Boehm, 1981, Software Engineering Economics,
Prentice Hall.
[8] Finnish Energy Authority, 2015, “Regulation methods for energy distribution during 2016-2023” (in Finnish).
[image:5.595.51.284.403.510.2]