Author’s Biography
Dr. Kyle Ian Jennett received the MEng. degree in electrical and mechanical engineering in 2009 and the PhD degree in electrical and electronic engineering in 2013 from the University of Strathclyde, Glasgow, U.K. He is presently a Lead Research and Development Engineer (Knowledge Exchange Fellow) at the Power Networks Demonstration Centre at the University of Strathclyde, Glasgow, U.K. At the Power Networks Demonstration Centre he is the technical lead on the MoD research program and also leads the Demand Side Management theme. His research interests include real time simulation, ship power systems, distribution ancillary services, and future power systems encompassing converter interfaces and energy storage.
Performance Optimisation of a Flywheel Energy Storage System using the PNDC Power
Hardware in the Loop Platform
K I Jennett* PhD, A S H Downie BEng, A Avras MEng, F Coffele PhD, A Tate MSc, S Lewinton BEng MSc
* PNDC, UK
* Corresponding Author. Email: [email protected]
Synopsis
The UK MOD has an objective to improve the efficiency and flexibility associated with the integration of naval electrical systems into both new & existing platforms. A more specific challenge for the MOD is in the de-risking of the integration of future pulse & stochastic loads such as Laser Directed Energy Weapons. To address this the Power Networks Demonstration Centre (PNDC) naval research programme is focused towards understanding & resolving the associated future power system requirements.
To address these challenges, the UK MOD and the PNDC have worked collaboratively to develop a 540kVA Power Hardware in the Loop (PHIL) testing facility. For the UK MOD this supports the “UK-US Advanced Electric Power and Propulsion Project Arrangement (AEP3).” This testing facility has been used to explore the capabilities of PHIL testing and evaluate a Flywheel Energy Storage System (FESS) in a notional ship power system environment. This testing provided an opportunity to develop and further validate the capability of the PHIL platform for continued marine power system research. This paper presents on the results from PHIL testing of the FESS at PNDC, which involved both characterisation and interfacing the FESS within a simulated ship power system. The characterisation tests involved evaluating the: response to step changes in current reference; frequency and impedance characteristics; and response during uncontrolled discharge. The ship power system testing involved interfacing the FESS to a simulated real time notional ship power system model and evaluating the response of the FESS and the impact on the ship power system under a range of different operational scenarios.
This paper also discuss the links between FESS characterisation testing and the development of the energy management system implemented in the real time model. This control system was developed to schedule operation of the FESS state (charging, discharging and idle) with the other simulated generation sources (the active front end and battery storage) and with the loads within the ship power system model. Finally, this paper highlights how the testing at PNDC has also supported the comparison and validation of previous FESS testing at Florida State University’s Centre Advanced Power Systems (FSU CAPS) facility, and how the combined efforts help to collectively de-risk future load Total Ship Integration and Evolving Intelligent Platforms in both UK and US programmes via the AEP3 PA.
Keywords: Energy storage; Propulsion; Integration; Marine systems
1. Introduction: PNDC marine testing platform
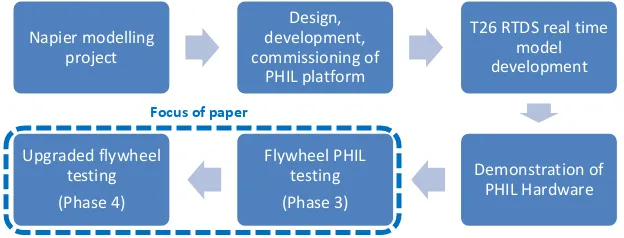
The present stage of work involved testing an upgraded FESS and builds on the previous stages of work (shown in Figure 1) that have included:
Developing an RTDS (real time) naval modelling library and using it to conduct realistic naval power system scenario analysis.
Investment to design, install and commission a PHIL testing platform at PNDC.
Development of a Type 26 (T26) frigate real time model for use in the PHIL platform.
Figure 1: MOD research programme to date
These previous stages of work have been published in [1]–[3]. The testing of the FESS is the first MOD project that has used the PNDC platform to test real hardware designed for a naval platform. The two phases of FESS testing were focused on:
Characterising the behaviour of the FESS using open loop testing to understand the behaviour and inform the development of representative models (Simulink and RTDS).
Repeating the FSU CAPS testing in the PNDC PHIL test environment to support the validation of the capability of both facilities for PHIL testing of naval power system energy storage solutions.
PHIL testing of the FESS in a simulated naval power system platform to de-risk the connection of the FESS to a real naval power system platform.
Feedback of performance issues with the FESS to the supplier (identified in phase 3).
Evaluate the change in performance after the FESS had been updated by the supplier (phase 4).
Develop a generic Simulink and RTDS model of a FESS system (based on the results from testing).
The FESS testing was also used to validate the capability of the PHIL platform for marine power system testing. This was implemented by first running the test schedule at FSU CAPS and then repeating the testing at PNDC (using the same FESS). The findings from the FSU CAPS testing are available in [4]. On analysis of the results from both test facilities it could be observed that the responses were equivalent (within expected tolerances accounting for the different amplifier configurations). This gave confidence to both the MOD and DOD stakeholders that both facilities had received validation from an external research centre and had an established capability for marine power system PHIL testing.
This paper will report on three topics: a comparison in the response of the FESS between both stages of testing; the generic model that was developed as part of this phase of the programme; and how the generic model was used within the PHIL platform to demonstrate a multi-FESS PHIL configuration.
Napier modelling project
Design, development, commissioning of
PHIL platform
T26 RTDS real time model development
Demonstration of PHIL Hardware Flywheel PHIL
testing (Phase 3) Upgraded flywheel
testing (Phase 4)
2. FESS testing at the PNDC
As previously discussed in the introduction and in [3], [4] the FESS was first tested at FSU CAPS and then retested using a similar test routine at PNDC. After testing at PNDC the findings from both the FSU CAPS and PNDC tests were submitted to the GKN (the FESS developer) and the system was given a software update to improve responsiveness, stability and protection functions. The FESS was then re-tested at PNDC to evaluate the improvement in the FESS operation.
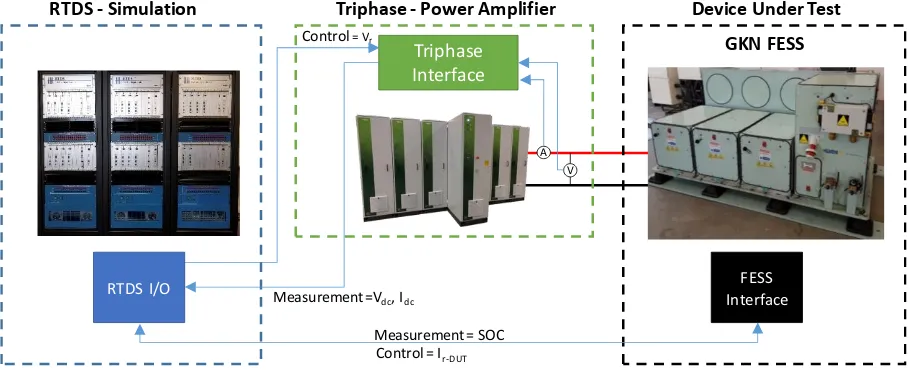
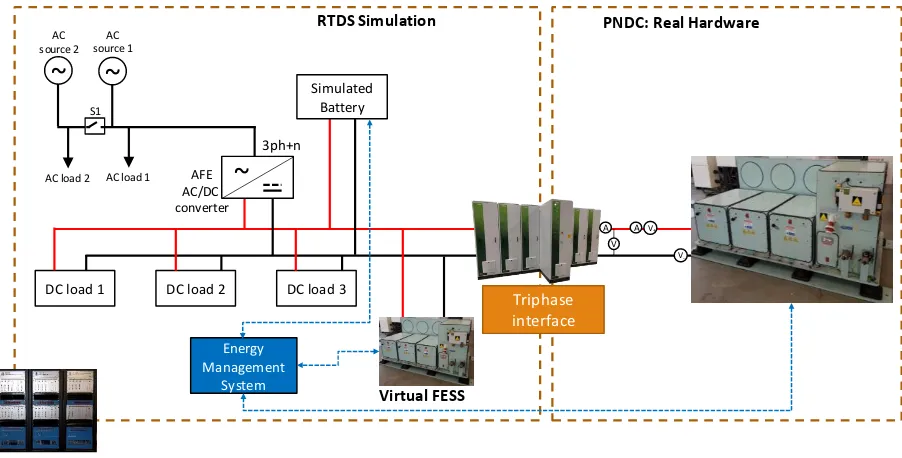
[image:3.595.85.540.258.443.2]The test setup that was used during this testing is shown in Figure 2. As can be seen from the diagram there are three key components of the test platform: the RTDS simulator (where the naval platform power system is modelled); the Triphase power amplifier (that interfaces the virtual RTDS model to the hardware under test); and the device under test (in this case this is the GKN FESS). This setup is explained in more detail in [1]. The following sections present on some of the results (phase 4) from the re-testing of the FESS after it had been updated by the supplier.
Figure 2: PHIL test setup line diagram
2.1. Step change test
This test involves applying step changes in the current reference to the FESS in order to capture information about the large signal behaviour of the FESS, including delays and ramp rate limitations. During the test program ten separate profiles were run to evaluate how the FESS behaved for different step magnitudes and step durations. One representative test profile response is shown in Figure 3. In this figure the control signal that is being sent to the FESS is shown as the dotted black line, the response of the FESS from the first round of testing is shown in red (phase 3) and the response of the FESS from the second round of testing is shown in green (phase 4).
RTDS - Simulation Device Under Test
Triphase Interface
RTDS I/O
A V
Measurement = SOC Measurement =Vdc, Idc
Control= Vr
Control = Ir-DUT
GKN FESS
FESS Interface
Figure 3: Step change test response
It can be observed that the phase 4 response more accurately follows the control signal than the phase 3 response. This improvement in response is entirely due to the software control system update applied by GKN (i.e. the supplier). The improved response reduces the required complexity of the ship energy management system. With the improved phase 4 response the feedforward delay compensation (that counteracts the FESS delay) can be reduced. During the phase 3 PHIL testing with the simulated ship an additional fast response energy store was required. This energy store supplied energy to compensate for: the FESS delay (to control signals) and the FESS offset (oscillation around setpoint observable at 6-8secs and 18-20secs in Figure 3). As both the delay and offset are reduced in phase 4 this means the capacity of the required additional energy store can be scaled down or removed (if the existing ship power system is robust enough to compensate for the fluctuating demand).
2.2. Frequency measurement test
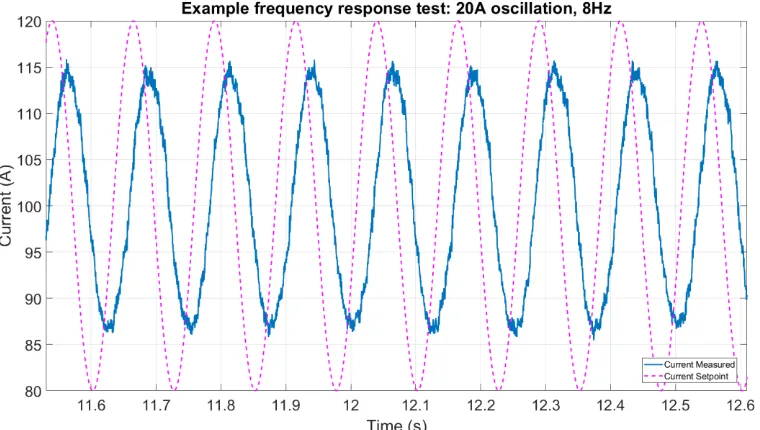
This test involves applying an oscillating current reference to the FESS in order to capture the FESS response in terms of delay and attenuation. During the test program the FESS was tested for both 20A and 5A current setpoint oscillations for a range of frequencies between 0.1Hz and 10Hz (both in charging and discharging modes). An example response is shown in Figure 4. In this response it can be observed that the FESS response lags the control setpoint by approximately 0.02secs. Also due to the delay the FESS response attenuates to 115A at the peak and to 87A at the trough of the sine wave (changes of 4.2% and 8.75% respectively).
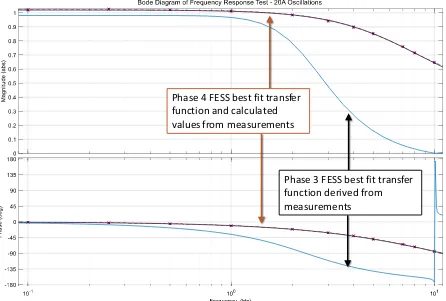
[image:4.595.121.501.527.742.2]Figure 5 is a bode diagram showing the response of the FESS to the full range of frequencies (0.1-10Hz) for the 20A oscillation. A best fit transfer function has been generated for the recorded test data in phase 3 and phase 4. The blue line shows the phase 3 response and the black and red lines show the phase 4 response. It can be observed that at the higher frequencies the phase 4 signal amplitude is attenuated less (top graph) and the phase delay is reduced (bottom graph). This means that the updated phase 4 FESS more accurately follows the control signal at high frequencies than the original phase 3 FESS. In a ship context this means the updated FESS would be able to react more rapidly and accurately to control demands (associated with ship loads). Again this improvement in response is entirely due to the software control system update applied by GKN.
Figure 5: Frequency measurement test response
2.3. Impedance measurement test
In the previous test a current reference oscillation was applied to the FESS to evaluate the frequency response. In this impedance measurement test instead of a current reference oscillation a voltage oscillation is applied to the FESS to capture the FESS impedance measurement. Information regarding the impedance presented by a device can be important for ensuring stability of the system, as well as understanding potential interactions, when integrating the device into a larger system. During the test program the FESS was tested while discharging and during charging using a single tone injection at the terminal voltage. For each test, the FESS was controlled to discharge (or charge) at 50 A. Once the FESS current had ramped up to the reference value and reached steady state, a set frequency oscillation in the amplifier voltage reference (20 V in magnitude) was applied and the FESS terminal voltage and current was recorded. This process was repeated for a range of frequencies from 0.2 Hz to 1 kHz.
For analysing the recorded test data, a Discrete Fourier Transform (DFT) was applied to the voltage and current waveforms in order to extract the complex spectral voltage (V) and current (I) at the frequency of oscillation. The impedance at the frequency of oscillation was then computed. Multiple captures are needed at each frequency point in order to provide some indication of the variance in the measurements. In this way, impedance measurements can be taken at pre-determined frequencies over the range from 0.2 Hz to 1 kHz. The results from this test are shown in Figure 6: the graph on the left shows the response during charging and the graph on the right shows the response during discharging. These graphs show that at low frequencies the updated FESS (phase 4) has a higher impedance than the original phase 3 FESS during both charging and discharging scenarios. This
Phase 3 FESS best fit transfer
function derived from
measurements
Phase 4 FESS best fit transfer
implies the updated FESS is less impacted by lower frequency voltage oscillations (i.e. it is more accurately able to follow the reference current setpoint during low voltage oscillations). This might occur in ship power systems due to sinusoidal low frequency loads.
Figure 6: Impedance measurement test response
3. FESS modelling
Part of the project scope of the current project at PNDC was to develop generic FESS models (based on an existing high fidelity Simulink model), with an objective to develop models that could be readily altered to represent different types of FESS for future studies. With the addition of the real time model these studies could include scenarios where multiple ‘virtual’ FESS are integrated into a naval power system. This would also allow each virtual FESS performance characteristics to be varied or scaled in some way, to understand the naval power system and FESS interaction. With the real time system both the real FESS and the virtual FESS can be utilised in the same test and from the power system perspective the real and virtual FESS are effectively indistinguishable. A representation of this system is shown in Figure 7.
Figure 7: PHIL test platform with virtual FESS in ship power system
There are multiple benefits to having both Simulink and Real Time models of ship power system components (in this case the FESS) including:
The ability to share models and problems between different institutions;
The ability for rapid testing of existing modelled equipment for non-standard operational scenarios;
The ability to independently test new equipment either in a fully virtually system before trials or to test new equipment as part of a PHIL test bed interface to real hardware.
The opportunity to quickly test new hardware within a naval platform environment without the need for potentially costly fully hardware based shore demonstrators.
0 20 40 60 80 100
0.1 1 10 100 1000
Im ped an ce M ag ni tu de ( W ) Frequency (Hz)
Impedance against Frequency: Charging
Phase 4 Charging |Z| (Ω)
Phase 3 Charging |Z| (Ω) 0 20 40 60 80 100
0.1 1 10 100 1000
Im ped an ce M ag ni tu de ( W ) Frequency (Hz)
Impedance against Frequency: Discharging
Phase 4 Discharging |Z| (Ω)
Phase 3 Discharging |Z| (Ω)
RTDS Simulation PNDC: Real Hardware
Triphase interface AC source 2
~
AC source 1~
~
DC load 1 DC load 2 DC load 3 AC load 2
3ph+n
AC load 1
Simulated Battery S1 AFE AC/DC converter Energy Management System A V
A V+
V
[image:6.595.87.538.420.649.2]It is proposed by the authors that there is a growing need for suppliers to share validated software models along with the products they’re developing (e.g. diesel generators, energy storage systems, sensor systems, etc.). These models can then be rapidly tested within a digital twin of the shipboard power system by independent organisations to de-risk and accelerate collaborative development and deployment of new equipment.
3.1. Introduction to Real Time and Simulink models
Both models were based on an existing high fidelity FESS model developed by GKN, FSU CAPS and the Sandia National Laboratory. The first stage in model development was to identify controllable parameters that could be implemented as variables so that the model could be controlled to respond like different types of FESS (e.g. different energy capacity, speed of response, etc.).
The model parameters that were identified at this stage were:
Number of flywheel pods
Initial State of Charge (SOC) (at simulation start)
Max flywheel speed (at maximum energy storage limit)
Min flywheel speed (below this speed the FESS power output capability is constrained)
Max SOC limit of the FESS (defines upper operational boundary)
Min SOC limit of the FESS (defines lower operational boundary)
Response delay for charge and discharge modes
Transfer Function Coefficient (for charge and discharge modes): time constant associated with transfer function to define the characteristics of the response
Slew rate (for charge and discharge modes): maximum rate of change for FESS response
The Simulink model was first updated to incorporate these parameters as control variables. Then the test data was used (via an iterative process) to ensure that the generic Simulink model could be made to behave like both the phase 3 and the modified phase 4 FESS. The RTDS model was developed from the Simulink model and the same iterative process was followed to ensure the RTDS model matched the recorded test data from FESS testing.
3.2. Response of the models
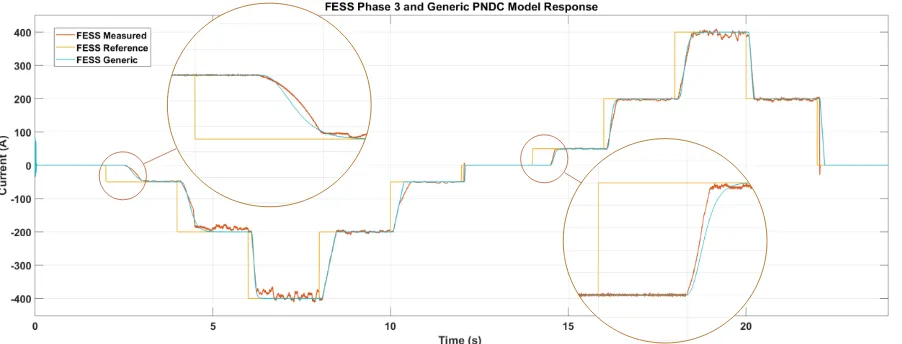
[image:7.595.88.539.551.723.2]The model response of the Simulink and Real time model were both checked against each other and also against the recorded test data from the FESS characterisation tests. This paper will focus on the response of the Simulink model when compared against the test data. Figure 8 shows a comparison of the generic (Simulink) model compared against the recorded data from the FESS testing prior to the software update (phase 3 response). A more detailed analysis of the phase 3 test data (without the model response) is published in [2], [3]. In the figure the red line is the recorded test data, the yellow line is the control current reference signal being sent to the real FESS and the generic model, and the blue line is the model response.
This figure illustrates the capability of the model to represent the real FESS behaviour. Two sections of the graph have been enlarged to illustrate parts of the response where the error between the test data and model increases. The objective of the model was to create a generic FESS model that could be readily modified to represent different types of FESS. This meant accepting some model error to allow the model to be readily modified (i.e. as a generic FESS). It should also be noted that it was decided by the modelling team to not include the noise component observed on the current steps (at 200A and 400A). Figure 9 demonstrates how changing the parameters listed in section 3.1 (Delays, step response and slew rates) the same model can be modified to respond like the phase 4 (post-update) FESS.
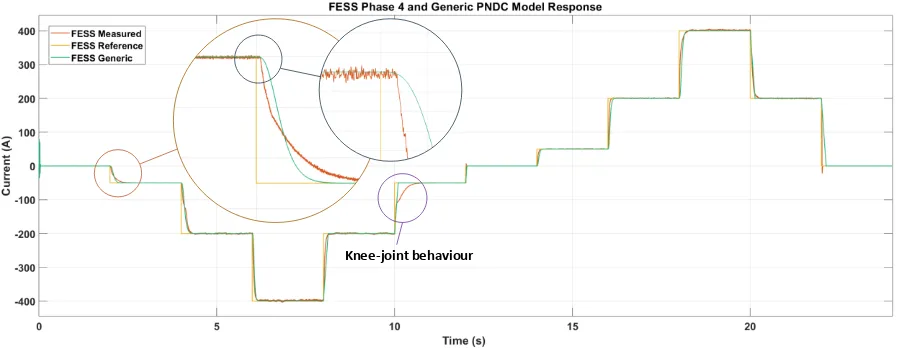
Figure 9: Generic model & FESS post-update (phase 4 test data)
In Figure 9, the phase 4 FESS test data is more responsive and accurate in following the current control signal than observed in the phase 3 response and the noise component is significantly reduced. The latency is less than 0.01s between the test data and model response during step changes. As with the phase 3 response there are some components to the FESS characteristic response that are not captured by the model (again a compromise to allow the model to be configurable and run efficiently). The key points where this is observed are highlighted in the graph: notably there is a ‘knee-joint’ behaviour that is observed when stepping from -200A to 0A and an approximation in the characteristic ramp down when stepping from 0A to -50A. In both cases a choice was made to not add additional complexity to the model in order to capture these unique behaviours, as these could be unique to this FESS.
4. Conclusions
This paper presents on the results from PHIL testing of a FESS at PNDC. This testing involved both the characterisation of the FESS, interfacing the FESS with a simulated ship power system, and development of a representative generic FESS model. The characterisation tests involved evaluating the FESS in the following areas: response to step changes in current reference; frequency and impedance characteristics; and response during uncontrolled discharge (not reported in the scope of this paper). The ship power system testing involved interfacing the FESS to a simulated real time notional ship power system model and evaluating the response of the FESS and the impact on the ship power system under a range of different operational scenarios. Through the two stages of FESS testing the centre has demonstrated: the capability of the PHIL platform for naval power system research; the capability to collaborate with suppliers and international partners to develop and integrate equipment; and the capability to develop validated models of equipment under test to support future research projects.
For the UK MOD, this activity has provided a range of insights and benefits. It has shown the value of PHIL approach both as method of efficiently and quickly conducting characterisation and integration studies of potential hardware in a representative system, and as an approach to developing and validating power systems models and control approaches. It has shown the benefit of close collaboration between industry, an independent test house (PNDC) and government partners, and has effectively supported UK and US collaboration via the “UK-US Advanced Electric Power and Propulsion Project Arrangement (AEP3).” Potential benefits can also be identified
across a range of domain, application and across multiple vectors, all with the potential to reduce risk, cost and time restrictions for complex system-of-system tests and studies.
5. Future work
The research in the MOD program of work has so far focused on the following topics: offline scenario testing for naval platform upgrades; design, commissioning and testing the PHIL platform capability at PNDC; characterisation and testing of the FESS; and validation of the PHIL platform against the test data recorded at FSU CAPS. From these efforts and the interaction with other projects and facilities including FSU and UK MOD’s US DOD partners, a range of follow-on activities have been identified and proposed. These include the following potential options:
1. PHIL in alternative domains e.g. aerospace. The PHIL platform is already used within the wider PNDC programme of work for utility projects and there is potential and an aspiration to expand into other domains & applications. This would build on the existing University of Strathclyde capability in these areas that exists in the main campus, some related work is listed in [2], [5]–[7].
2. The projects to date have focused on the FESS system as the energy storage device under test. One logical extension to this body of work would be to undertake a cross comparison with other energy storage technologies operating in isolation and as part of a hybrid energy storage system within a range of virtual ship environment. This could include both chemical and supercapacitor based technologies and could investigate integration challenges including physical installation, power, cooling, control, and energy management.
3. Multi-site PHIL studies (geographically dispersed demonstration): The inherent nature of PHIL opens up a potential opportunity to couple geographical dispersed testing of multiple elements of a complex system. This could link, for example, tests of new pulse energy based weapon system to a virtualised power system at PNDC and a thermal management system test at scale at a 3rd location. This offers an opportunity to
show system level effects with reduced risk when compared to a combined and highly interdependent test of multiple systems. It could support the opportunity to develop models and would enable real-time testing and experimentation of a mix of real, virtual system at both full and model scales under common control [8], [9].
4. Interfacing to high fidelity ship power system model: the present study utilises a notional representative ship power system model. Integrating hardware into a more complex power system architecture, such as the Type 26 model previously developed at PNDC could improve the understanding of whole platform impacts and interdependencies of new power-system hardware such as energy storage.
5. Multi-vector options: As suggested in 3 there are a range of integration challenges that mirror those investigated at PNDC to date. These include thermal management within the ship environment [10]. While studies at PNDC have focused to date on electrical integration, the capability has the potential to be scaled and paralleled with other vectors such as cooling systems
6. For each of these potential activities above the projects are likely to focus around an analysis of: Power system Robustness, Power quality, Management of Electrical Networks, Requirements for Thermal Management and Electrical Energy Storage.
Acknowledgements
This work in this paper has been supported by the Directorate of Engineering and Safety (DE&S) via the Defence Science and Technology Laboratory (DSTL) Platform Systems Division. Any opinions, findings, and conclusions or recommendations expressed in this material are those of the authors and do not necessarily reflect those of the funding organisations.
References
[1] K. I. Jennett, F. Coffele, and S. Lewinton, “Testing Integration of Naval Electrical Engineering Systems at the Power Networks Demonstration Centre.” Enging As A Weapon VII International Symposium, Brunel Square, Bristol, UK. 20-21 June, 2017.
[2] M. H. Syed et al., “The Role of Experimental Test Beds for the Systems Testing of Future Marine Electrical Power Systems.”
2nd International Conference on Modelling and Optimisation of Ship Energy Systems, 2019, no. May, pp. 1–8.
[4] J. Langston and M. Bosworth, “Model design document, energy magazine bidirectional system model: RTDS implementation, version 1.0. Technical report.,” 2016.
[5] A. M. Bollman, M. J. Armstrong, C. E. Jones, P. J. Norman, and S. J. Galloway, “Development of voltage standards for turbo-electric distributed propulsion aircraft power systems,” in 2015 International Conference on Electrical Systems for Aircraft, Railway, Ship Propulsion and Road Vehicles (ESARS), 2015, pp. 1–6.
[6] C. E. Jones et al., “Electrical and Thermal Effects of Fault Currents in Aircraft Electrical Power Systems With Composite Aerostructures,” IEEE Trans. Transp. Electrif., vol. 4, no. 3, pp. 660–670, 2018.
[7] M. Flynn, C. Jones, P. J. Norman, and G. M. Burt, “A Fault Management Oriented Early-Design Framework for Electrical Propulsion Aircraft,” IEEE Trans. Transp. Electrif., p. 1, 2019.
[8] W. Ren, M. Steurer, and S. Woodruff, “Progress and challenges in real time hardware-in-the loop simulations of integrated ship power systems,” IEEE Power Engineering Society General Meeting, 2005. pp. 534-537 Vol. 1, 2005.
[9] T. M. Kiehne, “Dynamic assessment of thermal management strategies aboard naval surface ships,” in 2011 IEEE Electric Ship Technologies Symposium, 2011, pp. 38–41.