City, University of London Institutional Repository
Citation
: Curcio, D., De Simone, A. and Gallo, A. (2017). Financial crisis and international
supervision: New evidence on the discretionary use of loan loss provisions at Euro Area commercial banks. The British Accounting Review, 49(2), pp. 181-193. doi:10.1016/j.bar.2016.09.001
This is the accepted version of the paper.
This version of the publication may differ from the final published
version.
Permanent repository link:
http://openaccess.city.ac.uk/17574/Link to published version
: http://dx.doi.org/10.1016/j.bar.2016.09.001
Copyright and reuse:
City Research Online aims to make research
outputs of City, University of London available to a wider audience.
Copyright and Moral Rights remain with the author(s) and/or copyright
holders. URLs from City Research Online may be freely distributed and
linked to.
City Research Online: http://openaccess.city.ac.uk/ publications@city.ac.uk
Elsevier Editorial System(tm) for The British Accounting Review
Manuscript Draft
Manuscript Number: BAR-D-15-00246
Title: Financial crisis and international supervision: new evidence on the discretionary use of loan loss provisions at Euro Area commercial banks
Article Type: SI: Issues in banking
Keywords: capital management; income smoothing; supervisory stress testing
Corresponding Author: Dr. Angela Gallo, Ph.D.
Corresponding Author's Institution: University of Salerno
First Author: Domenico Curcio, PhD
Order of Authors: Domenico Curcio, PhD; Antonio De Simone, PhD; Angela Gallo, Ph.D.
Abstract: We examine the discretionary use of loan loss provisions during the recent financial crisis, when Euro Area banks experienced not only a negatuve effect on the quality of their loans and a reduction in their profitability, but were also subject to a new form of stricter
Financial crisis and international supervision: new evidence on the
discretionary use of loan loss provisions at Euro Area commercial banks
Domenico Curcioa, , Antonio De Simonea and Angela Gallob
a Department of Economics, Management and Institutions, University of Naples "Federico II", Via Cinthia,
Monte Sant’Angelo, 80126 Napoli (NA), Italy. b
Department of Business Studies and Research, Università degli Studi di Salerno, Via Giovanni Paolo II, 132,
84084 Fisciano (SA), Italy.
Abstract
We examine the discretionary use of loan loss provisions during the recent financial crisis, when Euro Area banks experienced not only a negative effect on the quality of their loans and a reduction in their profitability, but were also subject to a new form of stricter supervision, namely the EBA 2010 and 2011 stress test exercises.
Overall, we find support for the only income smoothing hypothesis and we do not observe any difference in listed banks’ behavior, when compared to unlisted banks. Banks subject to EBA stress tests had higher incentives to smooth income only for the 2011 EBA exercise, when a larger and more detailed set of information was released. This may suggest an unwilled side effect that accounting setters and banking regulators and supervisors should account for.
Keywords: capital management; income smoothing; supervisory stress testing.
Jel classification: C23, G21, M41
Corresponding author.
1 2 3 4 5 6 7 8 9 10 11 12 13 14 15 16 17 18 19 20 21 22 23 24 25 26 27 28 29 30 31 32 33 34 35 36 37 38 39 40 41 42 43 44 45 46 47 48 49 50 51 52 53 54 55 56 57 58 59 60 61 62
Financial crisis and international supervision: new evidence on the discretionary
use of loan loss provisions at Euro Area commercial banks
Abstract
We examine the discretionary use of loan loss provisions during the recent financial crisis, when Euro Area banks experienced not only a negative effect on the quality of their loans and a reduction in their profitability, but were also subject to a new form of stricter supervision, namely the EBA 2010 and 2011 stress test exercises.
Overall, we find support for the only income smoothing hypothesis and we do not observe any difference in listed banks’ behavior, when compared to unlisted banks. Banks subject to EBA stress tests had higher incentives to smooth income only for the 2011 EBA exercise, when a larger and more detailed set of information was released. This may suggest an unwilled side effect that accounting setters and banking regulators and supervisors should account for.
Keywords: capital management; income smoothing; supervisory stress testing.
Jel classification: C23, G21, M41
1 2 3 4 5 6 7 8 9 10 11 12 13 14 15 16 17 18 19 20 21 22 23 24 25 26 27 28 29 30 31 32 33 34 35 36 37 38 39 40 41 42 43 44 45 46 47 48 49 50 51 52 53 54 55 56 57 58 59 60 61 62
1. Introduction
Together with prudential capital requirements, loan loss provisions (LLPs) are crucial to transmit macroeconomic conditions to real economy as they affect bank performance and incentives to issue new loans. How bank managers decide their provisioning policies has attracted many researchers in the banking field especially because they merge different information and behaviors. LLPs are usually classified as either specific or general. The former, also known as
non-discretionary provisions, depend on expected future losses and are added to specific reserves (Whalen, 1994; Beaver & Engle, 1996). General provisions, also called discretionary, increase generic reserves to protect the bank against not yet unidentified losses. General provisions are judgmental and can be used to pursue different management objectives. In particular, LLPs can be manipulated to meet minimum capital requirements and/or to improve the market’s perception by stabilizing their banks’ income (income smoothing).
Recent literature has emphasized the relationship between LLPs and bank capital
requirements with the credit cycle. Low specific provisions during expansion periods push banks to grant new loans while their incentives to supply new credits decrease during downturns, when banks are constrained to set aside a larger amount of provisions. Furthermore, it becomes harder to meet prudential capital requirements and banks become more likely to reduce their lending activity. The pro-cyclical nature of both capital requirements and provisioning rules calls for greater
collaboration between accounting setters and banking regulators and supervisors, especially after the 2007 crisis.
1 2 3 4 5 6 7 8 9 10 11 12 13 14 15 16 17 18 19 20 21 22 23 24 25 26 27 28 29 30 31 32 33 34 35 36 37 38 39 40 41 42 43 44 45 46 47 48 49 50 51 52 53 54 55 56 57 58 59 60 61 62
behaviors of listed banks and of banks subject to the EBA 2010 and 2011 stress tests. The consequences of the crisis on US bank managers’ provisioning policies have been recently investigated by El Sood (2012), whereas, to the best of our knowledge, the effects on European banks have not been investigated yet. Overall, our purpose is twofold: first, to provide new evidence to the conflicting results of previous literature, by focusing on provisioning policies during stressed market conditions; second, to investigate whether a completely new form of stricter supervision (i.e., the EBA stress tests) during the crisis period may also affect the discretionary use of LLPs. To date, this latter issue in particular has never been studied before. The crisis severely affected loan portfolio quality and earnings of Euro Area banks and might have reduced the incentives to manage income and regulatory capital via LLPs, due to the increase of specific/non-discretionary provisions as they are inversely correlated with bank loans quality. Nevertheless, because of the decline in their credit portfolio quality and higher incentives to shift risk (Fonseca & Gonzales, 2008), banks’ regulatory capital ratios decreased during the crisis. Moreover, a stricter supervision, as that
imposed by EBA amidst the crisis through the 2010 and 2011 stress testing exercises, required banks to be resilient to stressed scenarios and imposed more pressure on bank managers’ decisions.
Based on a panel data analysis, our empirical evidence shows that banks tended to smooth income but not to influence regulatory capital via LLPs. In particular, incentives to smooth income increased after the crisis, irrespective of the different nature of public and private.
As to the behavior of banks that underwent the EBA stress tests, we observe that the
1 2 3 4 5 6 7 8 9 10 11 12 13 14 15 16 17 18 19 20 21 22 23 24 25 26 27 28 29 30 31 32 33 34 35 36 37 38 39 40 41 42 43 44 45 46 47 48 49 50 51 52 53 54 55 56 57 58 59 60 61 62
and the extremely difficult financial and economic conditions in Greece during our investigation period. Overall, this research confirms the need for a better coordination of accounting setters and supervisory authorities’ actions. Our findings can contribute to set accounting and prudential regulations that can more effectively pursue their specific objectives.
This paper proceeds as follows. In section 2, we analyze the rationale for discretionary use of LLPs and develop our research hypotheses. Section 3 describes our data, sample selection and outlines methodological aspects of this study. Section 4 provides a discussion of our findings. Section 5 checks the robustness of our results and section 6 concludes.
2. Literature review and research hypotheses
This section presents main contributions on loan loss provisioning in the banking literature, for both listed and unlisted credit institutions, and on the effect of the release of EBA stress tests results. Based on this literature, we develop our research hypotheses concerning income smoothing and capital management and also make assumptions about the impact of stricter supervision on the discretionary use of LLPs.
2.1. Income smoothing
Under ordinary economic conditions, banks can manipulate LLPs to reduce their net profit
volatility, improve investors’, regulators’ and supervisors’ risk perception and keep their
compensation and the dividends flow to the shareholders stable over time. Prior studies
1 2 3 4 5 6 7 8 9 10 11 12 13 14 15 16 17 18 19 20 21 22 23 24 25 26 27 28 29 30 31 32 33 34 35 36 37 38 39 40 41 42 43 44 45 46 47 48 49 50 51 52 53 54 55 56 57 58 59 60 61 62
provisions if earnings before taxes and provisions raise. Evidence from Pérez, Salas-Fumas, and Saurina (2008) and Shrieves and Dahl (2003) supports income smoothing for Spanish and Japanese commercial banks, respectively. Evidence referred to Asian emerging markets does not univocally support the earnings smoothing hypothesis as well (Laeven & Majnoni, 2003; Craig, Davis, & Pascual, 2006; Packer & Zhu, 2012).
To reduce earnings volatility and financial markets’ risk perception, publicly traded banks
might have stronger incentives in smoothing their income, if compared to unlisted banks (Nichols,
Wahlen, & Wieland, 2009). Accordingly, Beatty, Ke and Petroni (2002) show that a higher number
of stakeholders makes listed banks more engaged in income smoothing. According to Anandarajan
et al. (2007), publicly traded banks use income to signal success and strength to their shareholders, since they raise funds in the stock market. However, Fonseca and Gonzales (2008) suggest that listed banks are less likely to smooth income because they are subject to a stricter supervision because of their larger size and greater impact in the case of a banking crisis.
To the best of our knowledge, banks’ income smoothing during adverse financial market
conditions has not been fully investigated yet. El Sood (2012) finds that during the crisis US banks
use provisions to smooth income upward. According to Packer and Zhu (2012) the global financial
crisis has significantly increased income smoothing practice only for Indian banks, but not for the
rest of the Asian banking systems that they take into account. Multiple factors might affect bank
managers’ provisioning decisions under stressed economic conditions. The crisis might limit the
scope for a discretionary use of banks’ provisions because of the increasing and massive
deterioration in the quality of their loans and the associated increase in the share of specific LLPs.
Nevertheless, the peculiar features of the turmoil originated by a toxic assets contagion in the
financial markets in the 2007 might have created incentives to shift risk and consequently smooth
income, for both private and listed banks. As a result, during the crisis banks might be more
1 2 3 4 5 6 7 8 9 10 11 12 13 14 15 16 17 18 19 20 21 22 23 24 25 26 27 28 29 30 31 32 33 34 35 36 37 38 39 40 41 42 43 44 45 46 47 48 49 50 51 52 53 54 55 56 57 58 59 60 61 62
publicly traded as they have higher incentives in reporting stable income numbers, especially during
extremely volatile periods (Hypothesis 2).
H1: The relationship between loan loss provisions and earnings before provisions and taxes is
more positive during the crisis.
H2: The relationship between loan loss provisions and earnings before provisions and taxes is
more positive for listed banks than private banks during the crisis.
2.2. Capital management
By manipulating LLPs bank managers can avoid the cost of violating prudential regulation
on bank capital adequacy. According to the Basel II Capital Accord, which was in force during the
investigation period, the Tier1 capital includes retained earnings, implying that banks characterized
by a low capital endowment might have more incentives to make lower LLPs. Nevertheless, if
banks’ loan loss reserves are lower than 1.25% of risk-weighted assets (RWAs), an increase in
provisions raises the Tier2 capital and, overall, the total regulatory capital ratio (BCBS, 2006). The
sign of the relation between provisions and regulatory capital will derive from which of these two
effects predominates and empirical evidence is not conclusive (Ahmed et al., 1999; Pérez et al.,
2008; Craig et al., 2006; Anandarajan et al., 2007; Bouvatier and Lepetit, 2008; Leventis, Dimitropoulos & Anandarajan, 2011).
We expect low-capital banks to be characterized by higher incentives to use LLPs to manage
their capital after the crisis broke out (Hypothesis 3), because both the worsening macroeconomic
scenario and the rising counterparty risk exposures have increased banks probability of default.
Furthermore, the associated costs of violating capital requirements increase in distressed economic
conditions because raising capital is more expensive and reducing the risk weighted assets could
force them to close profitable customer relationships and/or sell assets at unfavourable conditions.
1 2 3 4 5 6 7 8 9 10 11 12 13 14 15 16 17 18 19 20 21 22 23 24 25 26 27 28 29 30 31 32 33 34 35 36 37 38 39 40 41 42 43 44 45 46 47 48 49 50 51 52 53 54 55 56 57 58 59 60 61 62
more willing to meet capital requirements and are more likely to manage their capital ratios
(Hypothesis 4).
H3: The relationship between loan loss provisions and primary capital (Tier1 capital) is y
more positive during the crisis
H4: The relation between loan loss provisions and primary capital (Tier1 capital) is more
positive for listed banks than private banks during the crisis.
2.3. Supervisory stress testing and discretionary use of LLPs
The effectiveness of banking regulation and supervision in preventing managers from
excessive risk-taking behaviour might create incentives to use LLPs for income smoothing and
capital management purposes (Fonseca & Gonzales, 2008). In this regard, EBA 2010 and 2011
stress tests offer a privileged context to investigate these issues. By assuming EBA stress tests are
an example of supervisory intervention that can severely affect managerial discretion in making
provisions, we use them as an empirical experiment to detect whether stricter supervision during the
crisis provides a disciplining effect on managers’ decisions and makes bank provisioning policies
less prone to pursue discretionary objectives.
Additionally, from a disclosure perspective, we also might expect banks that underwent
EBA stress testing exercises to be more constrained in manipulating LLPs, due to the greater release
of bank-specific information that stress tests both require and make public. In fact, on the one hand,
sensitive data are needed by the national authorities responsible to feed the what-if scenarios
generation process and, on the other hand, results of stress tests are published on an aggregated
basis, as in 2010, or referred to each single bank, as in 2011.
Therefore, we expect EBA exercises to make banks less likely to use LLPs to smooth their
income (Hypothesis 5). As for the capital management hypothesis, we suggest that another effect
1 2 3 4 5 6 7 8 9 10 11 12 13 14 15 16 17 18 19 20 21 22 23 24 25 26 27 28 29 30 31 32 33 34 35 36 37 38 39 40 41 42 43 44 45 46 47 48 49 50 51 52 53 54 55 56 57 58 59 60 61 62
stressed macroeconomic scenarios, tested banks might have more pronounced incentives to
manipulate LLPs to avoid the costs associated with failing the supervisory assessment (Hypothesis
6).
H5: The relationship between loan loss provisions and earnings before taxes and provisions
is less positive for banks under supervisory stress test than for un-tested banks.
H6: The relationship between loan loss provisions and Tier1 capital is more positive for
banks under supervisory stress test than for un-tested banks.
A main assumption behind these hypotheses is that banks’ managers care about the results
of the EBA tests. Some recent research papers have investigated the informative content of the
stress testing exercises, particularly focusing on their impact on banks’ stock price. Beltratti (2011)
finds that, by making public details about each bank capital shortfall, the 2011 EBA stress test provided sensitive information to the market. Based on the analysis of market reaction on the stress
tests’ announcement dates, Cardinali and Nordmark (2011) show that investors cared little for the
2010 stress test, whereas they had a negative reaction to the release of the 2011 methodology, with
no effect on on un-tested credit institutions. By focusing on price changes upon the disclosure of the
2011 results, Petrella and Resti (2013) show that on the results date the market reacted strongly to
the disclosure of detailed information, thus corroborating the hypothesis that the stress test exercise
mitigates bank opaqueness. Goldstein and Sapra (2011) find that the higher disclosure of the 2011
exercise results led to different market reactions relative to the release of aggregate information
following the 2010 exercise because market participants had also information on the related drivers.
The different informative content of the two stress tests might also lead to different results in terms
of their impact on the discretionary use of LLPs. Particularly, due to the larger market reaction to
the results of the 2011 stress test, bank managers might have had more incentives to smooth income
to improve market perception of their banks’ risk. This would have been crucial to raise new capital
1 2 3 4 5 6 7 8 9 10 11 12 13 14 15 16 17 18 19 20 21 22 23 24 25 26 27 28 29 30 31 32 33 34 35 36 37 38 39 40 41 42 43 44 45 46 47 48 49 50 51 52 53 54 55 56 57 58 59 60 61 62
more positive relationship between loan loss provisions and earnings before taxes and provisions in
2011.
3. Empirical analysis
3.1 Sample selection
We collect Euro Area banks’ IAS-compliant balance-sheet data referred to the 2005 – 2011 period from Bankscope. To build our sample we adopt the following constraints. First, we focus on banks that are significantly involved in traditional lending activity, i.e. with customer loans higher than 50% of total assets over the sample period. To reduce size-related bias, we do not consider banks whose average asset value over the entire sample period is lower than the second quartile of the average asset distribution of the entire sample. Our initial sample is made up of banks that are from the 21 European countries included in the 2010 and 2011 EBA stress tests. To ensure
consistency in our analyses, we only keep banks with data available for more than five. Finally, to address potential issues with outliers, we eliminate the extreme bank/year observations (i.e., observations for which a variable presents values lower than the 1st percentile and higher than the 99th percentile).
The final sample is an unbalanced panel of annual data of 1,232 bank-year observations. and comprises a number of banks ranging from 114 in 2005 to 205 in 2007, 2008 and 2009. Among them, the number of listed banks goes from 35 in the first and the last year of the observation period to 42 in 2007, 2008 and 2009. In order to avoid potential biases related to listing or delisting
decisions, we delete banks whose stocks were delisted or began to trade during the sample period. Our sample includes 30 out of 91 credit institutions that were subject to the 2010 stress test exercise, of which 28 were tested in the 2011 stress test as well.
3.2. Methodology
1 2 3 4 5 6 7 8 9 10 11 12 13 14 15 16 17 18 19 20 21 22 23 24 25 26 27 28 29 30 31 32 33 34 35 36 37 38 39 40 41 42 43 44 45 46 47 48 49 50 51 52 53 54 55 56 57 58 59 60 61 62
The first objective of this research is to test whether the financial crisis affected banks’ discretionary use of LLPs with regards to the hypotheses of income smoothing practice and capital management. Our analysis is close to El Sood (2012), even if we focus on the potentially different behavior of both listed and stress tested banks’ behavior and adopt estimation techniques that better account for the dataset dynamic nature. To test our H1 and H3 hypotheses, we use the following model: t i t i t i t i t i t j t i t i t i TIER CRISIS a EBTP CRISIS a TIER a EBTP a GDPGR a LOAN a NPL a a LLP , , 7 , 6 , 5 , 4 , 3 , 2 , 1 0 , 1 1 (1)
LLPi,t , is the ratio of loan loss provisions to total assets for bank i at time t. The variables
employed as predictors have been largely used to test for the discretionary use of LLPs. Prior research captures the non-discretionary component of LLPs using variables reflecting both the level and the dynamics of loan portfolio losses (see, among others, Bouvatier & Lepetit 2008; Fonseca & Gonzàles 2008; Anandarajan et al. 2007; Ahmed et al. 1999). Particularly, we use the variable NPLi,t , the ratio of non-performing loans divided by total assets . This variable is positively related
to loan loss provisions. Our proxy for the discretionary component of LLPs is the variable LOANi,t ,
which is equal to customer loans divided by total assets. The variable GDPGRj,t corresponds to the
annual growth rate of the gross domestic product at constant prices for the country j at year t and is expected to capture the pro-cyclicality in LLPs due to macroeconomic conditions (Fonseca & Gonzàlez 2008; Anandarajan et al. 2007; Anandarajan et al. 2007; Bikker & Metzemakers 2005; Laeven & Majnoni 2003). Since banks are expected to reduce provisions to increase their income and/or capital during worsening macroeconomic conditions, we hypothesize a negative coefficient of the variable GDPGRj,t.
1 2 3 4 5 6 7 8 9 10 11 12 13 14 15 16 17 18 19 20 21 22 23 24 25 26 27 28 29 30 31 32 33 34 35 36 37 38 39 40 41 42 43 44 45 46 47 48 49 50 51 52 53 54 55 56 57 58 59 60 61 62
divided by total assets. Should the coefficient of EBTPi,tbe positive, low- (high-) income banks
would decrease (increase) provisions.
To test for the use of LLPs for capital management purpose, prior research focuses on the ratio of actual regulatory capital divided by the regulatory minimum capital (see Ahmed et al.1999; Beatty et al. 1995;, Leventis et al. 2011), or (as Bouvatier and Lepetit, 2008) on a variable based on the quartiles of the total capital ratio distribution. We opt for the ratio of Tier1 capital to risk weighted assets (TIER1i,t), for two main reasons. First, it does not suffer from the influence of
accounting relations on the link between bank capital and LLPs, that is due to the negative
correlation between provisions and Tier1 capital and to the positive correlation between provisions and Tier 2. Secondly, relative to Tier 2, the definition of Tier1 capital measure is more
homogeneous across the national supervisory standards. We argue that banks with less capital may have lower incentives to set provisions aside in order to increase their primary regulatory capital endowment via retained earnings. Hence, the capital management hypothesis is supported if the coefficient of TIER1i,t is positive.
Finally, we consider an indicator variable, CRISIS, equal to 1 for the period 2008-2011, and 0 otherwise. Thus, we can generate two interaction terms CRISIS●EBTPi,t and CRISIS●TIER1i,t. to
investigate differences in banks’ use of LLPs in the two periods. Based on the Hypotheses 1 and 3, these variables coefficients are expected to be both positive.
3.2.2. Testing for LLPs discretionary use by listed banks
Potential differences in listed banks’ behaviour relative to unlisted credit institutions are
estimated through the model presented in the following equation (2), where, relative to equation (1),
we add four interaction terms:
1 2 3 4 5 6 7 8 9 10 11 12 13 14 15 16 17 18 19 20 21 22 23 24 25 26 27 28 29 30 31 32 33 34 35 36 37 38 39 40 41 42 43 44 45 46 47 48 49 50 51 52 53 54 55 56 57 58 59 60 61 62
First, the two interaction terms LISTED●EBTPi,t and LISTED●TIER1i,t are generated by
interacting our key variables with an indicator variable, LISTED, equal to 1 for listed banks and 0 otherwise. These interaction terms allow us to examine whether, overall, listed credit institutions use LLPs to smooth income and manage capital at a larger extent than unlisted banks. If coefficients α8 and α10 of equation (2) were positive, that would be the case. Furthermore, to specifically test for
the Hypotheses 2 and 4, according to which, listed banks are even more willing to report stable income numbers and more likely to be engaged in capital management practice during the crisis, we generate the two two-way interaction variables, LISTED●EBTPi,t●CRISIS and
LISTED●TIER1i,t●CRISIS. Should their coefficients α9 and α11 be positive, Hypotheses 2 and 4
would be confirmed.
3.2.3. Testing for LLPs discretionary use by EBA stress tested banks
According to the Hypotheses 5 and 6, we expect banks that underwent the EBA’s stress tests to be less involved in the income smoothing practice but more engaged in manipulating capital. To test for these hypotheses, we estimate the following model:
t i t i t i t i t i t i t i t i t i t i t i t i t i t j t i t i t i DY TIER TESTED EBA a DY TIER TESTED EBA a DY EBTP TESTED EBA a DY EBTP TESTED EBA a DY TESTED EBA a DY TESTED EBA a CRISIS TIER LISTED a TIER LISTED a CRISIS EBTP LISTED a EBTP LISTED a TIER CRISIS a EBTP CRISIS a TIER a EBTP a GDPGR a LOAN a NPL a a LLP , , 17 , 16 , 15 , 14 13 12 , 11 , 10 , 9 , 8 , 7 , 6 , 5 , 4 , 3 , 2 , 1 0 , 2010 1 _ 2010 1 _ 2011 _ 2010 _ 2011 _ 2010 _ 1 1 1 1 (3)
Relative to equation (2), we first interact the sample binary variable EBA_TESTED, that equals 1 if bank i participated in at least one of the two EBA stress tests and 0 otherwise, with the two dummies DY2010 and DY2011, equal to 1 if the observation year is 2010 and 2011,
respectively, and 0 otherwise. A positive (negative) sign for their coefficients α12 and α13 in
1 2 3 4 5 6 7 8 9 10 11 12 13 14 15 16 17 18 19 20 21 22 23 24 25 26 27 28 29 30 31 32 33 34 35 36 37 38 39 40 41 42 43 44 45 46 47 48 49 50 51 52 53 54 55 56 57 58 59 60 61 62
period. Furthermore, we generate other two-way interaction variables, EBA_TESTED●EBTPi,t●DY2010, EBA_TESTED●EBTPi,t●DY2011,
EBA_TESTED●TIER1i,t●DY2010, and EBA_TESTED●TIER1i,t●DY2011, to investigate
differences between tested and untested banks for each of the years of the EBA stress tests.
Particularly, the Hypothesis 5, according to which tested banks are expected to be less involved in income smoothing, would be confirmed for 2010 and/or 2011 if coefficients α14 and/or α15 in
equation (3) were negative. The assumption of a more aggressive involvement in capital management practices, which is stated in Hypothesis 6, would be supported by the empirical evidence referred to 2010 and/or 2011 if coefficients α16 and/or α17 in equation (3) were positive.
Based on the variables formerly included in equation (2), we also control for the evidence on tested banks being driven by the public nature of most of them. The following Table 1 summarizes labels, name and description of the variables used to test our hypotheses.
[Table 1 here]
3.3. Descriptive statistics
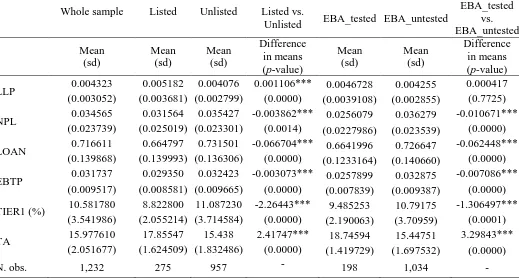
Main descriptive statistics referred to our sample banks are shown in Table 2. The average value of the variable LLP is slightly higher than 0.43%, confirming that provisions for loan losses are a relatively important bank accrual. On average, NPL is 3.46% and, as expected, experiences an increasing trend over the analysis time period. Customer loans are almost 72% of total assets, confirming the traditional nature of the business that our sample banks run and remains quite stable over time. EBTP is on average 3.17% and it shows a markedly decreasing trend over the six-year time horizon we take into account. The variable measuring banks’ endowment of primary
1 2 3 4 5 6 7 8 9 10 11 12 13 14 15 16 17 18 19 20 21 22 23 24 25 26 27 28 29 30 31 32 33 34 35 36 37 38 39 40 41 42 43 44 45 46 47 48 49 50 51 52 53 54 55 56 57 58 59 60 61 62
the quality of their regulatory capital, both in line with national and international authorities’ responses to the crisis, and also anticipates the new Basel III framework that the BCBS was setting just in those years.
We detect differences between listed and unlisted banks and stress-tested and untested banks and show that the respective means are statistically different for all the variables. Particularly, as expected, on average, publicly traded banks are larger than private ones and are less involved in lending activity. Even if they are characterized by a better credit quality, which may be largely explained by the greater diversification opportunities due to their larger size, listed banks tend to set a greater amount of loan loss provisions aside, entailing a more prudent approach to credit risk management. These results are probably due to the market disciplining effect. Publicly traded banks are less profitable than private banks. This can be the consequence of the higher customer loans share of total assets of the latter. In fact, if issued to sufficiently risky counterparties, customer loans can be much more profitable than other bank assets. This would also be consistent with the higher average value of TIER1 for unlisted banks: a larger amount of primary regulatory capital
endowment has to protect them against a greater risk exposure.
Our main variables show statistically different means even when tested banks are compared to untested banks. Particularly, the former are less profitable, less involved in the traditional lending activity, are characterized by both lower Tier1 capital ratios and a less non-performing loans. Not surprisingly, these results are similar to those highlighted before in comparing listed and unlisted banks and can be mainly explained by the larger average size of tested banks. Nevertheless, contrary to what found in the comparison between listed and unlisted banks, the difference in the mean values of LLP between tested and untested banks is not statistically significant.
1 2 3 4 5 6 7 8 9 10 11 12 13 14 15 16 17 18 19 20 21 22 23 24 25 26 27 28 29 30 31 32 33 34 35 36 37 38 39 40 41 42 43 44 45 46 47 48 49 50 51 52 53 54 55 56 57 58 59 60 61 62
Descriptive statistics reported in Table 3 are calculated by distinguishing between the years preceding the 2008 (pre-crisis years) and the period 2008 – 2011 (crisis years). As expected, the entire sample and the two groups of listed and tested banks set a greater amount of loan loss
provisions aside after the crisis broke out, with statistically significant differences in means. This is consistent with the statistically significant increase in the average value of NPL for, again, the whole sample, publicly traded and tested banks. Mainly due to the greater amount of provisions made after the eruption of the crisis, we find a statistically significant decline in EBTP for both the whole sample and the group of listed banks. EBTP decreased also for tested banks, but the mean value referred to the pre-crisis period is not statistically different from the value of the crisis period. The average LOAN systematically increased, though the difference in means between the two periods is statistically significant only when we consider the entire sample banks. Consistently with the increasing risk in banks’ credit portfolio, the average value of TIER1 went up for the entire sample, listed and tested banks, being in all the three cases above the minimum prudential requirement in force during the investigation period. The differences in means between the two periods is always statistically significant. The variable measuring bank size increased not only for the total sample, but also for listed and tested bank in the crisis period, though the difference in means is statistically significant only for listed banks.
[Table 3 here]
Table 4 provides correlations of our variables. NPL, LOAN, and EBTP have a significant and positive association with LLP for the entire sample, listed and tested banks. The correlations of GDPGR and TA with LLP are both negative and statistically significant. Finally, as concerns the correlation between TIER1 and LLP, it is negative and significant for the whole sample, positive for both listed and tested banks, but significant only for the latter. Overall, based on the low
1 2 3 4 5 6 7 8 9 10 11 12 13 14 15 16 17 18 19 20 21 22 23 24 25 26 27 28 29 30 31 32 33 34 35 36 37 38 39 40 41 42 43 44 45 46 47 48 49 50 51 52 53 54 55 56 57 58 59 60 61 62
[Table 4 here]
4. Results
Panel data analysis is a very efficient tool and allows us to consider the unobservable and constant heterogeneity, i.e. each bank specific characteristics. Based on the Hausman test, we adopt fixed effects to estimate equations (1), (2) and (3). Our results are presented in Table 5.
Evidence from equation (1) in Table 5 suggests that banks smooth their income via LLPs more intensively during the crisis (a4is positive and statistically significant). This result supports our H1 hypothesis and is consistent with the evidence reported in El Sood (2012) for a sample of US banks. We do not find any significant difference in our banks’ behavior in terms of capital management (hypothesis H3) during the period 2008 – 2011 (the coefficient of CRISIS●TIER1 is not statistically significant). These findings are confirmed in the specifications of equations (2) and (3).
None of the terms interacting the dummy LISTED with our key variables is statistically significant. Therefore, listed banks do not appear to behave differently from private banks during the crisis. The absence of differences in income smoothing practice is not in line with Anandarajan
et al. (2007), whose evidence is referred to Australian banks over the period 1991 – 2001.
Since prior literature has argued about the differences, in terms of informative content and market reaction, between the two EBA exercises, in equation (3) we test for our hypotheses in the 2010 and 2011 separately. First, we find that banks subject to stress tests make significantly less provisions in 2011 relative to untested institutions (EBA_TESTED●DY2011 is negative and statistically significant). Secondly, tested banks engaged more in income smoothing in 2011 (EBA_TESTED●EBTP●DY2011 is positive and statistically significant). The coefficients of the variables referred to the year 2010 (EBA_TESTED●DY2010 and
1 2 3 4 5 6 7 8 9 10 11 12 13 14 15 16 17 18 19 20 21 22 23 24 25 26 27 28 29 30 31 32 33 34 35 36 37 38 39 40 41 42 43 44 45 46 47 48 49 50 51 52 53 54 55 56 57 58 59 60 61 62
hypothesis for both 2010 and 2011 (EBA_TESTED●TIER1●DY2010 and
EBA_TESTED●TIER1●DY2011) are not statistically significant. Overall, based on these results, neither of the two Hypotheses 5 and 6 is supported. Particularly, the evidence of more income smoothing by tested banks in 2011 is in contrast with our Hypothesis 5, according to which the disciplining effect of the stress tests should lower incentives to manage income via LLPs. Nevertheless, it can be interpreted based on the impact that the different types of release of the stress tests results had on the market and on managers’ behavior. Contrary to what occurred for the publication of the results in 2010, market response to the publication of the 2011 stress test results was large and led managers to use LLPs to smooth income in order to ultimately improve market perception of their banks’ risk. Furthermore, the more aggressive income smoothing that we observe for the year 2011 might also be due to perceived bankruptcy concerns for some of the tested banks.
Overall, our results support the income smoothing hypothesis at the 1% confidence level. However, contrary to what is required for the capital management hypothesis to be confirmed, the coefficient of the Tier1 capital ratio is always negative and economically not relevant, being also marginally significant at the 10% confidence level only for equations 1 and 2.
As to the control variables used in our models, we find that the l GDPGR is negatively and significantly associated with the LLP at 1% confidence level, for all the three estimated equations. This suggests that banks make provisions during and not before economic recessions. The pro-cyclical nature of our banks’ behavior is consistent with previous empirical research. The
coefficient of NPL is positive and statistically significant for all the equations shown in Table 5 at the 1% confidence level, confirming the direct relation between LLPs and credit quality. Customer loans are negatively correlated with loan loss provisions but the coefficient of the variable LOAN is neither statistically nor economically significant.
1 2 3 4 5 6 7 8 9 10 11 12 13 14 15 16 17 18 19 20 21 22 23 24 25 26 27 28 29 30 31 32 33 34 35 36 37 38 39 40 41 42 43 44 45 46 47 48 49 50 51 52 53 54 55 56 57 58 59 60 61 62
5. Robustness checks
The robustness of our results is tested through the following checks. First, banks from Spain and Greece are removed from the sample, because of the especially distressed situation of these two countries’ banking sectors during the investigation period. Among the eight banks that failed the 2011 stress test, five were from Spain and two from Greece, and many other intermediaries in these two countries were very close to fail the test. Since these banks might have behaved on the basis of peculiar incentives, we decide to remove them from the sample to test if our results are biased by their inclusion. Furthermore, we eliminate Spanish banks also because of the specific regulatory constraints imposed on their provisioning policies by the Banco de España since 2000, i.e., the dynamic provisioning system. Based on dynamic provisioning requirements, Spanish banks are required to make provisions in periods of economic expansions so that they can be used during economic downturns. It is worth highlighting that this mechanism automatically implies income smoothing and aims to induce banks’ countercyclical behavior in their provisioning practice, by also generally reducing managerial discretion.
Table 6 shows the results obtained after dropping Spanish and Greek banks from the sample. The variable CRISIS●EBTP is marginally significant at the 10% confidence level, showing a decrease in its statistical significance if compared to the analysis of the whole sample (see Table 5). By dropping Spanish banks, therefore, we get rid of banks that can significantly contribute to the result of more income smoothing during the crisis, since they are forced by law to smooth their income over time. The capital management hypothesis is still not confirmed: the coefficient of the variable TIER1 is again negative and not economically significant, even if statistically significant. The empirical evidence referred to listed banks does not support the hypothesis of a different
1 2 3 4 5 6 7 8 9 10 11 12 13 14 15 16 17 18 19 20 21 22 23 24 25 26 27 28 29 30 31 32 33 34 35 36 37 38 39 40 41 42 43 44 45 46 47 48 49 50 51 52 53 54 55 56 57 58 59 60 61 62
statistically significant) and during the crisis (LISTED●EBTP●CRISIS and
LISTED●TIER1●CRISIS continue to be statistically not significant). Finally, the coefficient of EBA_TESTED●EBTP●DY2011 in equation (3) is statistically significant at the 10% confidence level, whereas it was at the 5% for the overall sample. Consistently with what highlighted before, dropping Spanish banks makes its coefficient less statistically significant. As expected, and already shown in Table 5, LLP is again positively and significantly correlated with the variables NPL and EBTP at the 1% confidence level, and negatively and significantly at the 1% confidence level with the annual real GDP growth rate.
[Table 6 here]
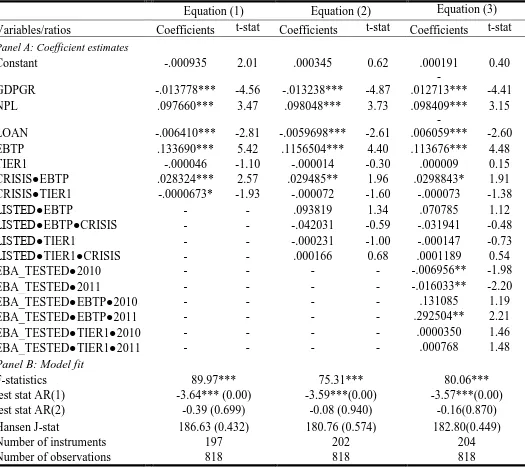
The second robustness check is based on the use of the two-step system GMM estimation technique for dynamic models (Blundell and Bond, 1998; Arellano and Bover, 1995). We adopt this technique to deal with a potential simultaneity issue affecting the determination of both some independent variables and LLP. In order to control for unobserved heterogeneity, simultaneity and dynamic endogeneity (if any), first-differences of the variables are used as instruments for the equations in levels. Results are presented in Table 71. We implement a finite sample correction following Windmeijer (2005), as suggested by Blundell and Bond (1998). Based on Hansens’ test and Arellano and Bond (1991), respectively, we do not have issues concerning instrument validity and serially uncorrelated error terms.
Overall, the two-step system GMM estimates show that our main results are confirmed at the usual confidence levels. All the control variables have the expected sign as in the GLS fixed effects analysis but LOAN is negatively and significantly related to LLP, suggesting that banks with larger credit portfolio make less provisions.
1
1 2 3 4 5 6 7 8 9 10 11 12 13 14 15 16 17 18 19 20 21 22 23 24 25 26 27 28 29 30 31 32 33 34 35 36 37 38 39 40 41 42 43 44 45 46 47 48 49 50 51 52 53 54 55 56 57 58 59 60 61 62
[Table 7 here]
6. Conclusions
We investigate the discretionary use of LLPs by Euro Area commercial banks over the
2005-2011 time period. In particular, we examine banks’ behavior in relation to: i) the distressed
economic and financial conditions experienced during the crisis and ii) the two stress test exercises
that the European Banking Authority run in 2010 and 2011. Studying banks managers’ decisions
under such extraordinary conditions can give useful insights for a deeper understanding of actual
provisioning practices.
Overall, Euro Area banks used provisions to smooth income, but not to manage their capital
for regulatory purpose, and were more aggressively involved in income smoothing after the
financial crisis broke out. This can reasonably be due to more pronounced incentives to enhance investors’ perception. Moreover, we analyze banks’ behavior by separately testing for the
discretionary use of LLPs for each of the two years of the stress tests (2010 and 2011) since prior literature pointed out significant differences between the two exercises in terms of their informative content and market response.
1 2 3 4 5 6 7 8 9 10 11 12 13 14 15 16 17 18 19 20 21 22 23 24 25 26 27 28 29 30 31 32 33 34 35 36 37 38 39 40 41 42 43 44 45 46 47 48 49 50 51 52 53 54 55 56 57 58 59 60 61 62
disclose stress tests results, by providing evidence of an unwilled side effect that regulators and supervisors, as well as accounting setters, should carefully take into account.
REFERENCES
Ahmed, A.S., Takeda, C., Thomas, S. (1999). Bank loan loss provisions: a reexamination of capital management, earnings management and signaling effects. Journal of Accounting and Economics, 28(1), 1-25.
Anandarajan, A., Hasan, I., McCarthy, C. (2007). Use of loan loss provisions for capital, earnings management and signaling by Australian banks. Accounting and Finance, 47(3), 357-379.
Arellano, M., Bover, O. (1995). Another look at the instrumental variables estimation of error-components models. Journal of Econometrics, 68, 29–51.
1 2 3 4 5 6 7 8 9 10 11 12 13 14 15 16 17 18 19 20 21 22 23 24 25 26 27 28 29 30 31 32 33 34 35 36 37 38 39 40 41 42 43 44 45 46 47 48 49 50 51 52 53 54 55 56 57 58 59 60 61 62
Basel Committee on Banking Supervision (BCBS), (2006). International Convergence of Capital Measurement and Capital Standards. A Revised Framework. Bank for International Settlements, Basel, Switzerland. Available on the internet at
http://www.bis.org/publ/bcbs107.htm Accessed 10.08.12
Beatty, A., Chamberlain S., Magliolo, J. (1995). Managing financial reports of commercial banks: The influence of taxes, regulatory capital, and earnings. Journal of Accounting Research, 33(2), 231-262.
Beatty, A. L., Ke B., Petroni K. R. (2002). Earnings Management to Avoid Earnings Declines across Publicly and Privately Held Banks. The Accounting Review, 77(3), 547-570.
Beaver, W.H. Engel, E. (1996). Discretionary behavior with respect to allowances for loan losses and the behavior of security prices. Journal of Accounting and Economics, 22, 177–206.
Beltratti, A., 2011. Do stress tests carry useful information? Evidence from Europe. Bocconi University.
Bhat, V. (1996). Banks and income smoothing: an empirical analysis. Applied Financial Economics, 6(6), 505-510.
Bikker, J.A., Metzemakers, P. (2005). Bank provisioning behavior and procyclicality. Journal of International Financial Markets, Institutions and Money, 15, 141–157.
1 2 3 4 5 6 7 8 9 10 11 12 13 14 15 16 17 18 19 20 21 22 23 24 25 26 27 28 29 30 31 32 33 34 35 36 37 38 39 40 41 42 43 44 45 46 47 48 49 50 51 52 53 54 55 56 57 58 59 60 61 62
Bouvatier, V., Lepetit, L. (2008). Banks’ procyclical behavior: Does provisioning matter? Journal of International Financial Markets, Institutions and Money, 18(5), 513-526.
Cardinali, A., Nordmark J. (2011). How informative are Bank Stress Tests? Bank Opacity in the European Union. Working Paper, Lund University.
Collins, J., Shackelford, D., Wahlen, J. (1995). Bank differences in the coordination of regulatory capital, earnings and taxes. Journal of Accounting Research, 33(2), 263-292.
Craig, R. S., Davis E. P., Pascual A. G. (2006). Sources of pro-cyclicality in east Asian financial systems, in Gerlach S. and Gruenwald P. (eds.), Procyclicality of Financial Systems in Asia, International Monetary Fund and Hong Kong Institute for Monetary Research, pp. 55–123.
El Sood, H.A. (2012). Loan loss provisioning and income smoothing in US banks pre and post the financial crisis. International Review of Financial Analysis, 25, 64-72.
Fonseca, A.R., Gonzàlez, F. (2008). Cross-country determinants of bank income smoothing by managing loan loss provisions. Journal of Banking and Finance, 32(2), 217-228.
Goldstein, I., Sapra, H. (2013). Should Banks’ Stress Test Results be Disclosed? An Analysis of the Costs and Benefits, Foundations and Trends in Finance, 8, 1-54.
1 2 3 4 5 6 7 8 9 10 11 12 13 14 15 16 17 18 19 20 21 22 23 24 25 26 27 28 29 30 31 32 33 34 35 36 37 38 39 40 41 42 43 44 45 46 47 48 49 50 51 52 53 54 55 56 57 58 59 60 61 62
Leventis, S., Dimitropoulos, P., Anandarajan, A. (2011). Loan loss provisions, earnings
management, and capital management under IFRS: The case of EU commercial banks. Journal of Financial Services Research, 40(1-2), 103-122.
Nichols, D., Wahlen, J., Wieland, M. (2009). Publicly-traded versus privately-held: implications for conditional conservatism in bank accounting. Review of Accounting Studies, 14, 88-122.
Packer F., Zhu H. (2012). Loan loss provisioning practices of Asian banks (Working Paper No. 375, Bank for International Settlements), available on the internet at
http://www.bis.org/publ/work375.pdf Accessed 13.03.12
Pérez, D., Salas-Fumas, V., Saurina, J. (2008). Earnings and capital management in alternative loan loss provision regulatory regimes. European Accounting Review, 17(3), 423-445.
Petrella, G., Resti, A. (2013). Supervisors as information producers: Do stress tests reduce bank opaqueness? Journal of Banking and Finance, 37(1)2, 5406–5420.
Roodman, D. (2009). How to do xtabond2: An introduction to ‘‘difference’’ and ‘‘system’’ GMM in Stata. Stata Journal 9, 86–136.
Whalen, J.M. (1994). The nature of information in commercial bank loan loss disclosures. The Accounting Review, 69, 455-478.
Tables
Table 1
Variables definitions.
Notation Variable name Description
Panel A: Dependent variable
LLP Loan loss provisions The ratio of loan loss provision to total assets
Panel B: Income smoothing and capital management variables
EBTP Earnings before taxes and provisions
The ratio of earnings before taxes and provisions to total assets
TIER1 Basel II Tier1 capital ratio Tier1 capital divided by risk weighted assets
Panel C: Control variables
GDPGR GDP growth rate The GDP growth rate on a year-to-year basis
LOAN Customer loans Customer loans divided by total assets NPL Non-performing loans Non-performing loans divided by total assets
TA Total asset Natural logarithm of total asset
Panel D: Dummy variables
DY Year dummies Six dummy variables which equal either one or zero for each year from 2006 to 2011, excluding the year 2005
CRISIS Crisis dummy An indicator variable that is 1 for years 2008 – 2011 and 0 otherwise
LISTED Listed banks dummy An indicator variable that is one for listed banks and 0 otherwise
EBA_TESTED Tested banks dummy An indicator variable that is 1 for banks that underwent EBA stress tests and 0 otherwise
Table 2
Descriptive statistics – Part 1.
Whole sample Listed Unlisted Listed vs.
Unlisted EBA_tested EBA_untested
EBA_tested vs. EBA_untested
Mean (sd)
Mean (sd)
Mean (sd)
Difference in means (p-value)
Mean (sd)
Mean (sd)
Difference in means (p-value)
LLP 0.004323 0.005182 0.004076 0.001106*** 0.0046728 0.004255 0.000417 (0.003052) (0.003681) (0.002799) (0.0000) (0.0039108) (0.002855) (0.7725)
NPL 0.034565 0.031564 0.035427 -0.003862*** 0.0256079 0.036279 -0.010671*** (0.023739) (0.025019) (0.023301) (0.0014) (0.0227986) (0.023539) (0.0000)
LOAN 0.716611 0.664797 0.731501 -0.066704*** 0.6641996 0.726647 -0.062448*** (0.139868) (0.139993) (0.136306) (0.0000) (0.1233164) (0.140660) (0.0000)
EBTP 0.031737 0.029350 0.032423 -0.003073*** 0.0257899 0.032875 -0.007086*** (0.009517) (0.008581) (0.009665) (0.0000) (0.007839) (0.009387) (0.0000)
TIER1 (%) 10.581780 8.822800 11.087230 -2.26443*** 9.485253 10.79175 -1.306497*** (3.541986) (2.055214) (3.714584) (0.0000) (2.190063) (3.70959) (0.0001)
TA 15.977610 17.85547 15.438 2.41747*** 18.74594 15.44751 3.29843*** (2.051677) (1.624509) (1.832486) (0.0000) (1.419729) (1.697532) (0.0000)
N. obs. 1,232 275 957 - 198 1,034
Table 3
Descriptive statistics – Part 2.
All banks Listed banks EBA_tested banks
Pre-crisis Crisis Difference
in means Pre-crisis Crisis
Difference in means
Pre-EBA
tests EBA tests years
Difference in means Mean
(sd)
Mean
(sd) (p-value)
Mean (sd)
Mean
(sd) (p-value)
Mean (sd)
Mean
(sd) (p-value)
LLP 0.002928 0.005310 -0.002382*** 0.003231 0.006625 -0.003393*** 0.003767 0.006534 -0.002766*** (0.002030) (0.003263) (0.0000) (0.002209) (0.003887) (0.0000) (0.003314) (0.004611) (0.0000)
NPL 0.023835 0.042168 -0.0183338*** 0.021682 0.038881 -0.017198*** 0.017836 0.041948 -0.024112*** (0.017828) (0.024469) (0.0000) (0.020511) (0.025591) (0.0000) (0.015576) (0.028945) (0.0000)
LOAN 0.705040 0.724811 -0.0197708*** 0.653313 0.673300 -0.019987 0.66272 0.671598 -0.008879 (0.142284) (0.137640) (0.0088) (0.140752) (0.139262) (0.1270) (0.129411) (0.119825) (0.7017)
EBTP 0.034409 0.029843 0.004565*** 0.031196 0.027982 0.003213*** 0.025449 0.023982 0.001468 (0.010352) (0.008382) (0.0000) (0.009254) (0.007797) (0.0023) (0.007589) (0.006195) (0.1533)
TIER1 (%) 9.719296 11.19305 -1.473754*** 8.024701 9.413797 -1.389096*** 8.879154 10.78607 -1.906916*** (3.389159) (3.522965) (0.0000) (1.702401) (2.09860) (0.0000) (1.994129) (2.122556) (0.0000)
TA 15.91552 16.02162 -0.1061 17.6016 18.04345 -0.44185** 18.7485 18.91125 -0.16275
(2.002233) (2.086272) (0.3752) (1.629461) (1.600107) (0.0164) (1.448987) (1.441306) (0.3361)
N. obs. 511 721 117 158 130 56
The table presents descriptive statistics of both the pre-crisis (2005 – 2008) and the crisis (2009 – 2011) periods for both all sample banks (columns 2 – 3) and listed banks (columns 5 – 6). It also shows descriptive statistics referred to both the years before the EBA stress tests and the two-year period 2010 – 2011 for tested banks (columns 8 – 9). The p-values of the two-sample Wilcoxon rank-sum tests are reported. ∗∗∗, ∗∗ and ∗ express significance at 1, 5 and 10%.
Table 4
Sample correlations.
Variables LLP GDPGR NPL LOAN EBTP TIER1 TA
Panel A: all banks
LLP 1
GDPGR -0.3955*** 1
NPL 0.5247*** -0.2999*** 1
LOAN 0.3268*** -0.1154*** 0.3431*** 1
EBTP 0.1577*** 0.0325 0.2473*** 0.3291*** 1
TIER1 -0.0628** -0.1300*** 0.2136*** -0.0418 0.0992*** 1
TA -0.0585** 0.0880*** -0.3019*** -0.5135*** -0.4835*** -0.3439*** 1
Panel B: listed banks
LLP 1
GDPGR -0.5586*** 1
NPL 0.6069*** -0.3689*** 1
LOAN 0.4095*** -0.1629*** 0.3375*** 1
EBTP 0.2392*** -0.0255 0.3079*** 0.4195*** 1
TIER1 0.1993*** -0.2253*** 0.2147*** -0.055 0.1157* 1
TA -0.1661*** -0.0046 -0.2301*** -0.5168*** -0.4862*** -0.1232** 1
Panel C: EBA tested banks
LLP 1
GDPGR -0.6081*** 1
NPL 0.6966*** -0.4414*** 1
LOAN 0.2656*** -0.114 0.1815** 1
EBTP 0.3716*** -0.038 0.2030*** 0.2978*** 1
TIER1 0.0628 -0.1638** 0.1143 0.0068 -0.1179 1
TA -0.1652** 0.0075 -0.125* -0.7152*** -0.2095*** -0.1028 1 The table reports Pearson pair-wise correlation coefficients for whole sample banks (Panel A), listed banks (Panel B) and tested banks (Panel C).
Table 5
GLS fixed effect (FE) regression results of loan loss provisions.
Equation (1) Equation (2) Equation (3)
Variables/ratios Predicted sign Coefficient t-stat Coefficient t-stat Coefficient t-stat
Panel A: Coefficient estimates
Constant -0.000122 -0.10 0.000419 0.33 0.000585 -6.73
GDPGR - -0.017876*** -6.67 -0.017111*** -6.77 -0.017143*** 8.38
NPL + 0.079370*** 9.54 0.077992*** 9.51 0.075723*** -0.52
LOAN ± -0.000777 -0.49 -0.000878 -0.56 -0.000817 5.10
EBTP + 0.097247*** 5.13 0.101575*** 5.40 0.097310*** -1.64
TIER1 + -0.000088* -1.83 -0.000083* -1.67 -0.000082 2.26
CRISIS●EBTP + 0.030796*** 2.91 0.023978** 2.18 0.025138** -0.43
CRISIS●TIER1 + -0.000016 -0.55 -0.000011 -0.33 -0.000014 -0.72
LISTED●EBTP + - - -0.037457 -0.74 -0.034894 -0.84
LISTED●EBTP●CRISIS + - - -0.017067 -0.56 -0.025147 -1.43
LISTED●TIER1 + - - -0.000239 -1.26 -0.000259 1.83
LISTED●TIER1●CRISIS + - - 0.000196 1.67 0.000208* -0.69
EBA_TESTED●DY2010 - - - - -0.001360 -1.91
EBA_TESTED●DY2011 - - - - -0.007660** 1.03
EBA_TESTED●EBTP●DY2010 ± - - - - 0.062941 2.26
EBA_TESTED●EBTP●DY2011 ± - - - - 0.203738** 0.62
EBA_TESTED●TIER1●DY2010 ± - - - - 0.000063 1.08
EBA_TESTED●TIER1●DY2011 ± - - - - 0.000291 0.46
Panel B: Model fit
F-statistics 84.57*** 59.96*** 51.21***
Within R2 0,4869 0.5004 0.5082
Between R2 0,2489 0.1105 0.1092
Overall R2 0,3411 0.2294 0.2336
Number of observations 1,232 1,232 1,232
The table reports the results of the GLS fixed effect (FE) estimates of equations (1), (2) and (3). In each regression the dependent variable is LLP.
Table 6
GLS fixed effect (FE) regression results of loan loss provisions (excluding Spanish and Greek banks)
Equation (1) Equation (2) Equation (3)
Variables/ratios Predicted sign Coefficient t-stat Coefficient t-stat Coefficient t-stat
Panel A: Coefficient estimates
Constant -0.001380 -1.08 -0.000908 -0.70 -0.000665 -0.51
GDPGR - -0.015466*** -6.55 -0.015174*** -6.61 -0.015774*** -6.65
NPL + 0.087986*** 10.01 0.086954*** 10.18 0.085979*** 10.08
LOAN ± -0.000237 -0.14 -0.000427 -0.25 -0.000396 -0.23
EBTP + 0.099101*** 5.63 0.102007*** 5.27 0.097508*** 5.00
TIER1 + -0.000092* -1.97 -0.000108** -2.12 -0.000108** -2.13
CRISIS●EBTP + 0.019706* 1.82 0.019569* 1.76 0.020153* 1.81
CRISIS●TIER1 + 0.000002 0.07 -0.000001 -0.02 -0.000007 -0.22
LISTED●EBTP + - - -0.057119 -1.34 -0.057584 -1.30
LISTED●EBTP●CRISIS + - - -0.024340 -0.76 -0.025743 -0.86
LISTED●TIER1 + - - 0.000018 0.17 -0.000013 -0.13
LISTED●TIER1●CRISIS + - - 0.000130 1.26 0.000130 1.35
EBA_TESTED●DY2010 - - - - 0.003916 0.88
EBA_TESTED●DY2011 - - - - -0.003944* -1.95
EBA_TESTED●EBTP●DY2010 ± - - - - -0.117659 -0.84
EBA_TESTED●EBTP●DY2011 ± - - - - 0.188724* 1.86
EBA_TESTED●TIER1●DY2010 ± - - - - -0.000031 -0.21
EBA_TESTED●TIER1●DY2011 ± - - - - 0.000079 0.45
Panel B: Model fit
F-statistics 64.29*** 43.78*** 32.91***
Within R2 0.4972 0.5045 0.5118
Between R2 0.3695 0.3275 0.3173
Overall R2 0.4015 0.3736 0.3710
Number of observations 998 998 998
The table reports the results of the GLS fixed effect (FE) estimates of equations (1), (2) and (3). In each regression the dependent variable is LLP.
Table 7
Two-step system GMM regression results for loan loss provisions.
Equation (1) Equation (2) Equation (3) Variables/ratios Coefficients t-stat Coefficients t-stat Coefficients t-stat
Panel A: Coefficient estimates
Constant -.000935 2.01 .000345 0.62 .000191 0.40 GDPGR -.013778*** -4.56 -.013238*** -4.87
-.012713*** -4.41 NPL .097660*** 3.47 .098048*** 3.73 .098409*** 3.15 LOAN -.006410*** -2.81 -.0059698*** -2.61
-.006059*** -2.60 EBTP .133690*** 5.42 .1156504*** 4.40 .113676*** 4.48 TIER1 -.000046 -1.10 -.000014 -0.30 .000009 0.15 CRISIS●EBTP .028324*** 2.57 .029485** 1.96 .0298843* 1.91 CRISIS●TIER1 -.0000673* -1.93 -.000072 -1.60 -.000073 -1.38
LISTED●EBTP - - .093819 1.34 .070785 1.12
LISTED●EBTP●CRISIS - - -.042031 -0.59 -.031941 -0.48
LISTED●TIER1 - - -.000231 -1.00 -.000147 -0.73
LISTED●TIER1●CRISIS - - .000166 0.68 .0001189 0.54
EBA_TESTED●2010 - - - - -.006956** -1.98
EBA_TESTED●2011 - - - - -.016033** -2.20
EBA_TESTED●EBTP●2010 - - - - .131085 1.19
EBA_TESTED●EBTP●2011 - - - - .292504** 2.21
EBA_TESTED●TIER1●2010 - - - - .0000350 1.46
EBA_TESTED●TIER1●2011 - - - - .000768 1.48
Panel B: Model fit
F-statistics 89.97*** 75.31*** 80.06***
test stat AR(1) -3.64*** (0.00) -3.59***(0.00) -3.57***(0.00) test stat AR(2) -0.39 (0.699) -0.08 (0.940) -0.16(0.870) Hansen J-stat 186.63 (0.432) 180.76 (0.574) 182.80(0.449)
Number of instruments 197 202 204
Number of observations 818 818 818
The table shows the two-step system GMM estimation of equations (1), (2) and (3). In each regression the dependent variable is LLP. 28EBA_TESTED is an indicator variable that takes the value 1 if bank