Applied Physics B manuscript No. (will be inserted by the editor)
Intensity stabilisation of optical pulse sequences for coherent control of
laser-driven qubits
Joseph Thom1,2 ?, Ben Yuen1,3 ??, Guido Wilpers1, Erling Riis2, Alastair G. Sinclair1
1 National Physical Laboratory, Teddington, Middlesex, TW11 0LW, UK 2 SUPA, Dept. of Physics, University of Strathclyde, Glasgow, G4 0NG, UK 3 Dept. of Physics, Imperial College, London, SW7 2BB, UK
Received: date / Revised version: date
Abstract We demonstrate a system for intensity sta-bilisation of optical pulse sequences used in laser-driven quantum control of trapped ions. Intensity instability is minimised by active stabilisation of the power (over a dy-namic range of>104) and position of the focused beam at the ion. The fractional Allan deviations in power were found to be < 2.2⇥10 4 for averaging times from 1 s to 16384 s. Over similar times, the absolute Allan de-viation of the beam position is < 0.1 µm for a 45 µm beam diameter. Using these residual power and position instabilities, we estimate the associated contributions to infidelity in example qubit logic gates to be below 10 6 per gate.
? Present address: M Squared Lasers, 1 Kelvin Campus,
Glasgow, G20 0SP, UK
?? Present address:Dept. of Physics, University of Oxford,
Clarendon Laboratory, Parks Road, Oxford, OX1 3PU
1 Introduction
Scalable quantum computation requires not only logi-cal qubits, but also many physilogi-cal qubits and gates for the purpose of error-correction. The number of physical qubits per logical qubit depends strongly on the accu-racy of controlling the latter [1]; this number diverges as the error probability per logic gate (EPG) increases to a limiting threshold. Device capabilities, error models and associated assumptions determine the exact thresh-old for the EPG, which can range from 10 2to 10 6 [2, 3]. The consequence of tolerating a high EPG threshold is a requirement for a much larger number of physical qubits. To achieve fault-tolerance without an excessive overhead of physical qubits per logical qubit, the general consensus is that the EPG (or infidelity) must be<10 4 [2, 4].
Click here to view linked References
For two decades, much research has been conducted into the use of trapped atomic ions for quantum infor-mation processing [5]. A number of landmark ion trap experiments have demonstrated laser-driven two-qubit gates, with infidelities reducing by over two orders of magnitude during this period [6–10]. Trapped ions are at the forefront of high-fidelity quantum gates [4, 11], where one of the present challenges is routine achievement of the EPG below a 10 4 threshold [12, 13]. Therefore, all e↵ects which contribute⇠10 4 or more to the overall gate error will need to be minimised further.
In coherent control schemes for trapped ions, several noise sources and imperfections are known to introduce errors to qubit operations. These encompass instabili-ties in the trapping potential, motional heating of the ions, o↵-resonant excitations and ac-Stark shifts, state preparation and measurement errors, as well as insta-bilities in the phase and frequency of the coherent driv-ing field. Dependdriv-ing on the choice of species and qubit, magnetic field fluctuations and spontaneous scattering may be additional limitations. Considering laser-driven qubit transitions, instability in the Rabi frequency which characterises the ion-laser interaction [14] will likewise contribute to the overall error. Consequently, the insta-bility of laser intensity experienced by the ions is crit-ical to laser-driven qubits; this is true for both optcrit-ical transitions as well as hyperfine transitions driven by a stimulated Raman process. In the case of single-qubit gates using hyperfine transitions, lower errors have been
achieved by driving the transition directly with a mi-crowave source [15, 16]. Nevertheless, there remains con-siderable interest in laser-driven two-qubit gates based on such transitions. The work described here focuses ex-clusively on methods to minimise intensity instability in optical pulse sequences for coherent control of trapped ions.
Laser intensity fluctuations are considered as a con-tribution to overall quantum gate error in recent works using hyperfine qubits in9Be+[4] and43Ca+ [11]. Both works report laser power stabilisation as part of the ap-paratus, with the latter achieving⇠10 3power instabil-ity, which contributed 1⇥10 4to the gate error budget. Similar considerations are made in the report of a two-element logic gate of9Be+and25Mg+[17], as well as in earlier work with9Be+[18, 19]. In work with40Ca+ opti-cal qubits [10], average laser intensity noise of⇠4⇥10 3 was quantified through Ramsey experiments [20]. Fur-thermore, active stabilisation of laser intensity has been mentioned in the context of the88Sr+optical qubit tran-sition at 674 nm [21, 22].
In this work we present a laser system with a high degree of intensity agility, while still achieving stabil-ity in power and beam pointing over the short and long term (⇠1 s and⇠1 day respectively). This system was developed for pulsed-probe, coherent control of trapped ions. The parameters of the laser beam are sensed by photodiodes. This approach is preferable to using the response of trapped ions, since it provides for superior 1
signal-to-noise. With the pulse power and beam posi-tions stabilised independently, the respective Allan de-viations were measured to quantify short- and long-term instabilities. We demonstrate an out-of-loop power insta-bility an order of magnitude lower than reported else-where [4, 11]. The optical method used in this work is not subject to the systematic drifts (e.g. micromotion) which may be present when relying on the ion response as the sole discriminant for quantifying intensity insta-bility. Nevertheless, in the system’s intended application to trapped ions, it will still be necessary to initialise the exact intensity set-point via calibration of the Rabi fre-quency using the ion response. Upon correction of sys-tematic drifts in this response (at intervals dependent on the individual apparatus), the long-term intensity stabil-ity will enable restoration of the initial Rabi frequency; otherwise, a recalibration will be required.
Additionally, the system can operate over a range of four orders of magnitude in intensity. Higher intensities enable fast qubit rotations, whereas the lowest intensi-ties are used in Rabi and Ramsey spectroscopy to enable high resolution and measurement accuracy. The system builds on our earlier techniques for agility in pulse shape, phase and frequency detuning [23]. While the principle of the system is demonstrated at a wavelength of 674 nm for the optical qubit transition in 88Sr+, it is straight-forwardly applicable to laser-driven transitions in other atomic species.
The experimental data presented here was used to estimate the contribution of laser intensity instability (through Rabi frequency fluctuations) to the infidelity in two examples of laser-driven quantum gates. Our es-timates show that this specific source of infidelity can be rendered insignificant with respect to the generally-accepted EPG threshold of 10 4[2, 4]. It is advantageous to minimise all error sources well below this threshold, since the error of a computation grows rapidly with num-ber of gate operations [10] and the total error determines the magnitude of resources required for error correction [1].
2 Pulse power calibration and stabilisation
Here we present the principle of a pulse-intensity sta-bilisation scheme, which is designed for high-fidelity co-herent control of the 5s 2S
1/2 - 4d 2D5/2 quadrupole transition at 674 nm in 88Sr+. In such an experiment, using the ion response as a discriminant is problematic at short times due to the quantum projection noise limit, and at long times due to drifts in other parameters which influence the Rabi frequency. Therefore it is essential to employ a method independent of ions, to stabilise the intensity and to quantify the instability achieved. The system described here uses a cascaded series of avalanche photodiodes (APDs) to measure indirectly the power of laser pulses incident on the position of a trapped ion, over a power range of four orders of magnitude. We 1
demonstrate long-term stabilisation over the full range of available intensities.
2.1 Power stabilisation system - experimental setup
A 674 nm titanium-sapphire laser (M Squared Lasers SolsTiS) is attenuated to 110 mW. This output is cou-pled into a polarisation-maintaining (PM) fibre, which delivers the light to a pair of acousto-optic modulators (AOMs) in series (see Fig. 1). AOM1 is used in a double-pass configuration and is driven by the amplified signal from a direct digital synthesis (DDS) source (Toptica Photonics VFG150); this precisely controls the tempo-ral shape, phase, and frequency detuning of the opti-cal pulses, as well as setting the initial power of each pulse over a large dynamic range. An analogue signal generator, in line with a variable attenuator (Minicir-cuits ZX73-2500-S+) and an amplifier, drives AOM2 in single pass configuration. This permits fine control of the applied RF power, thus enabling precise laser power stabilisation. In the ‘o↵’ state, each AOM has the RF extinguished by an 80 dB switch (Minicircuits ZASWA-2-50DR+).
A second PM fibre delivers light to the ion, as well as to a series of detectors for optical response calibra-tion and pulse power stabilisacalibra-tion (see Fig. 1). Light from the fibre is collimated by a multi-element achro-matic lens (L1, f = 29 mm); then, a Glan-Taylor po-lariser produces a vertical linear polarisation of high pu-rity (105:1 extinction ratio). An achromatic doublet lens
(L2, f = 200 mm) focuses the beam to a spot diame-ter 2w0= 45 µm at the position of the ion. This beam is split into two separate paths using a non-polarising 50:50 beamsplitter (Thorlabs BSW10). While the re-flected beam is directed to the ion trap, the transmit-ted beam (of power Pin-loop) is directed towards a cas-caded arrangement of APDs (Hamamatsu C10508-01). Samples of signals from APD1, APD2 or APD3 during optical pulses are used to generate a stabilising feedback signal; these APDs are referred to as the ‘in-loop’ detec-tors. APD1 measures the transmitted beam through the wedged optic (0.942Pin-loop), APD2 measures the first reflection (3.79⇥10 2 Pin-loop) and APD3 measures the second reflection (1.25⇥10 3 Pin-loop).
When used for coherent control of trapped ions, the reflection from the beamsplitter (power P) is directed through the ion trap and onward to the position stabili-sation system. For the purposes of measuring the efficacy of the power stabilisation system, this beam is directed to a second detection setup to provide an independent, ‘out-of-loop’ measurement of the pulse powers. In the case where samples of APD1, APD2, or APD3 are used to generate feedback, APD0 (also Hamamatsu C10508-01) monitors the beam in position A, B or C respectively. As the setup is similar to that used for the in-loop detec-tors, the optical powers incident on the in- and out-of-loop detectors are approximately equal. Therefore, for a pulse of a given power P at the ion in the range 300 nW P 5.2 mW, at least one of APD1, APD2 1
DDS CVFGI5:k
AOMI - Double pass Variable
attenuator 8: dB
switches Analogue RF
AOM3 - Single pass
APD:
Analogue output Digital output
USB Define pulse
pattern
Multiplexer Calculate feedback from in-loop APD
Record pulse powers Low-pass filter
f:= 3:: kHz
Analogue input
Fibre from Ti:Sapph laser Out-of-loop
In-loop Lab Computer
RF and Control
C A B Ion trap
GT Pin-loop P
BS
APD3 APDI APD3 M
LI L3
Fig. 1 Schematic of hardware used to stabilise the pulse powers. Measurements on APDs 1-3 are used to calculate the
feedback. APD0 measures the power of the transmitted beam (position A), the first reflected beam (position B) or second
reflected beam (position C) arising from a second wedged optic. In each position, APD0 measures approximately the same
power as the corresponding in-loop APD. In coherent control experiments, the mirror highlighted in red (M) is removed and
the beam with powerP is incident on the ion. GT; Glan-Taylor polariser, BS; non-polarising 50:50 beam splitter. Lens L1
collimates light from the fibre and lens L2 focuses the beam to a waist at the ion trap center.
or APD3 and APD0, has a signal-to-noise ratio >100 and is not saturated. These extremes of power cover the range of Rabi frequencies required for coherent control as well as for spectroscopy at the highest resolution. High powers are principally for coherent control of the ion’s motional states, but are also used for state prepa-ration via resolved sideband cooling. Although the latter is less sensitive to intensity fluctuations, stable operation is advantageous for minimising state preparation errors
[11]. Mid-range powers are required for carrier transi-tion spectroscopy and electronic state control. The low-est powers are for the longlow-est pulse durations necessary to realise high spectroscopic resolution and measurement accuracy. In both Rabi and Ramsey spectroscopy, pulses of longer duration result in a spectrally narrower enve-lope, thus minimising errors associated with o↵-resonant excitation of nearby transitions. Additionally, long du-ration pulses of low intensity minimise the ac-Stark shift 1
of the qubit transition caused by the interaction of the laser with o↵-resonant transitions.
The Hamamatsu C10508-01 APDs were chosen for their high bandwidth (10 MHz) to measure short (⇠10µs) pulses, as well as for their radiometric stability. When operated at the lowest gain setting, we find the measured performance of this APD is comparable to Hamamatsu S-1337 PIN photodiodes which are commonly used for radiometric applications [24]. As the APDs are used for accurate scaling of Rabi frequencies (via optical power), it is required that the linearity of the detectors them-selves is well known. This was assessed using the method of Theocharous [25, 26], with a minimum linearity fac-tor of 0.998 measured across the dynamic range of the detector. The spatial uniformity of the APDs was also measured [27], with maximum variations in quantum ef-ficiency of 2 % across the full active area (1 mm diam-eter) of the detector, when measured on 20 µm2 pix-els. Minimising the sensitivity of the detected signal to beam drift is a compromise between averaging over effi -ciency variations and minimising signal loss at the edge of the beam. A beam diameter of 100 µm on the detec-tor surface was chosen. A 100 µm spatial drift of this beam across the surface during a measurement would cause relative fluctuations in the measured signal with a standard deviation of 10 4. An optical bandpass fil-ter (Semrock FF02-675/67-25) at the input of each APD eliminates ambient light, and any residual 1064 nm and
532 nm emanating from the titanium-sapphire laser, to well below the noise floor of the detector.
The entire pulse sequence, as measured on each APD, is sampled at 400 kHz using a high speed analogue in-put card (NI PXI-6254, 16 bit resolution). To prevent noise above the sampling frequency being down-sampled and projected onto the error signal, the APD signals are electronically filtered. Passive low-pass RC filters have an insufficiently steep roll-o↵, so each APD chan-nel contains an active fourth-order Bessel filter (Maxim MAX275ACPP+) with a 3 dB cut-o↵frequency of 200 kHz, thus enabling detection of pulses down to 10µs. We note that in the case of bichromatic laser fields for entangle-ment [10, 28], the power incident on the photodiodes os-cillates at 10 times the filter cut-o↵frequency; hence the mean power of the amplitude-modulated light field will be recorded in the sampling process. To avoid in-stabilities arising in that case, the pulse duration should be matched precisely to an integer number of the bichro-matic beat period, which is feasible with the DDS source. Independent correction signals that stabilise the pulse powers are generated by an analogue output card (NI PXI-6733) and are applied to the variable attenuator via a multiplexer switch. The TTL signals used to con-trol this switch, as well as ones used to concon-trol the RF switches, are generated by a high speed digital I/O card (NI-PXIe-6537). Opto-couplers in each TTL line provide electronic isolation between the instrumentation and the digital I/O card. Instrumentation amplifiers provide 1
lation from ground noise on the analogue output card through common-mode rejection.
2.2 Power calibration
The optical power P of each pulse may be set in the range 300 nWP 5.2 mW. For a given detector, the absolute Rabi frequency ⌦, achieved with power P at an APD stabilisation setpoint V, can be measured di-rectly with the ion. Relying on the detector’s linearity, an arbitrary Rabi frequency ⌦arb can be set accurately and precisely via a scaled setpoint Varb for power Parb (within the range of the detector), without the need to measure ⌦arb directly. The AOM system’s response is calibrated to permit simple and rapid initialisation of the power to within 2 % of the desired power Parb, so that the feedback locks on to the setpointVarbin a min-imum number of measurement cycles. The use of three cascaded APDs increases the range of applied RF pow-ers, and subsequent optical powpow-ers, for which the signal-to-noise is sufficient to give accurate calibration.
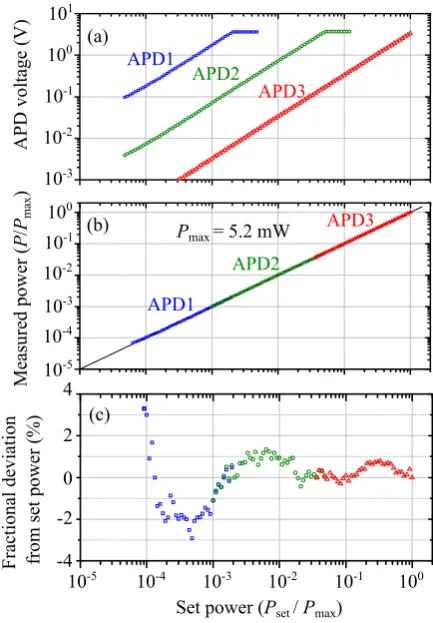
We verify the calibration routine by programming a linear ramp in the set optical power at the ion (Pset), as a fraction of the maximum possible value (Pmax), and mea-suring the arising signals on APD1, APD2 and APD3 (see Fig. 2(a)). While Pmax is measured by an optical power meter, Pset is a programmed value implemented via the calibration [23]. In Fig. 2(b), the data from the APD with the best signal-to-noise ratio at each value of Pset is normalised and combined to give the total
lin-101
APD2
APD vol
ta
ge
(V)
APD3
APD1
APD2 APD3 APD1
Pmax = 5.2 mW 100
10-1
10-2
10-3 100 10-1 10-2 10-3 10-4 10-5
100 10-1 10-3 10-2 10-4
10-5 -4 -2 0 2 4
Fra
ct
iona
l de
vi
at
ion
from
se
t powe
r (%
)
Me
asure
d powe
r (
P
/
Pmax
)
Set power (Pset / Pmax) (a)
(b)
(c)
Fig. 2 (a) Measured voltage on APDs1-3 as a function of
Pset/Pmax. A single optical pulse of 1 ms duration was used to record each data point; consecutive pulses in the series
were recorded at a rate of 113 Hz. In (b) the same data is
normalised and combined to give the total linearised response
of the system. The black solid line is the ideal linear response
of the system. Finally, (c) shows the fractional deviation from
this ideal response. Errors in the data are less than the
sys-tematic deviations in (c), and are estimated from the spread
of adjacent data points in (c) to be±0.5 %.
earised response of the system, which overlaps well with the ideal response of unity gradient and zero intercept. Figure 2(c) shows the fractional deviation of the data from the ideal set power, with an error of<2 % observed forPset/Pmax>10 4. The systematic deviations visible 1
[image:7.595.316.533.90.402.2]in Fig. 2(c) could be minimised; however, the power ini-tialisation is already sufficiently accurate for the stabil-isation scheme to eliminate the o↵set. In the context of coherent rotations of atomic qubits, the exact set-point of power is determined by a direct measurement of the ion-laser coupling strength (i.e. the Rabi frequency).
2.3 Power stabilisation system - concept and results
Qubit gate operations are performed by a sequence of pulses with various durations, powers and frequency de-tunings. For accurate readout of the qubit’s final state, this sequence is repeated many times. The feedback prin-ciple relies on the measured powers of pulses in each se-quence to inform corrections to the AOM settings, in order to achieve the desired powers for each pulse in the subsequent sequence. The linearised response of the AOM (Fig. 2(b)) ensures rapid locking to the desired set-points. The stabilisation system reported here reduces power variations in pulse sequences up to Fourier fre-quencies of⇠50 Hz. Intensity fluctuations on a timescale that is short compared to the pulse sequence duration (typically < 5 ms) are not compensated for. A mea-surement of the passive power stability of the titanium-sapphire laser shows three dominant noise components at discrete Fourier frequencies in the range 50 Hz - 100 kHz. Each component has a fractional power noise of <8⇥ 10 4. Following the analysis presented in section 4, no feedback in this frequency range is required in order to meet the target infidelity. However, if an alternative
laser source exhibits high-frequency power noise, then it would be simplest to correct for this noise before the light enters the pulse shaping AOMs and intensity stabil-isation system presented here (i.e. where the laser beam is continuous, before input to the delivery fibre in the bottom right-hand side of Fig. 1).
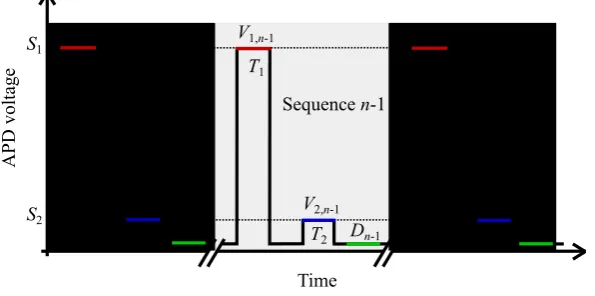
The principle of the pulse-power feedback loop for a defined pulse sequence (see Fig. 3) is as follows. In the jth repeated sequence, the ith pulse has a duration Ti (typically 5 ms Ti 5µs), and a powerPiat the ion (where 300 nWPi5.2 mW). This sequence is com-municated to the DDS via USB 2.0 and is triggered at a frequency of 113 Hz, which is representative of measure-ment cycles with trapped ions and is asynchronous with harmonics of the 50 Hz mains frequency. The samples acquired during theithoptical pulse in thejthsequence are averaged to give a measured voltage valueVi,j. Sim-ilarly, samples acquired in a 100 µs window after the optical pulses are averaged to give a dark level Dj for each sequence. To stabilise the power of theithpulse to a user-defined set-pointSi, a correction signal Ci,n, ap-plied to the variable attenuator during the ith pulse in thenth sequence, is calculated according to
Ci,n=Vo↵ Gi n 1
X
j=n N
⇣(Vi,j Dj) Si
N
⌘
. (1)
Here,Vo↵ is a fixed o↵set from zero volts that determines the initial attenuation setting,Giis a positive gain factor set independently for each pulse in the sequence, andN 1
Time
T1
T2
T1 T1
T2 T2
Sequence n-2 Sequence n-1 Sequence n
APD vol
ta
ge
V1,n-2
V2,n-2
V1,n-1
V2,n-1
V1,n
V2,n
Dn-2 Dn-1 Dn
S1
S2
Fig. 3 Schematic showing three consecutive pulse sequences (j=n 2, n 1, n), each containing two pulses (i= 1, 2)
of duration T1 and T2, which are sampled at a rate of 400 kHz by one of the in-loop APDs. Within one sequence, samples highlighted in red and blue are averaged to give the valuesV1,jandV2,j, which are stabilised to set-pointsS1andS2respectively. Similarly, samples highlighted in green are averaged to give the dark readingDjfor each sequence.
is the number of pulses that are averaged over to calcu-late the feedback. Stabilising to one pulse only does not replicate the same degree of instability in pulses of dif-fering powers; this is due to drifts in the AOM’s optical response. Hence the correction signals are multiplexed in time to enable independent control of dissimilar pulses.
We assessed the performance of the pulse power sta-bilisation system using a sequence of two pulses, firstly with APD3 as the detector from which the feedback is calculated. The pulse durations were T1=T2= 100 µs, separated in time by 100µs, and were stabilised to set-points S1 = 3.3 V andS2 = 0.12 V. The former value is close to the saturation voltage of the APD, and the latter is the value where the signal-to-noise drops be-low 100. Therefore in this example, S1 andS2 span the useful operating range of the APD. From the system re-sponse calibration and linearisation (see Fig. 2), these
set points relate to powers at the ion ofP1 = 5.17 mW andP2= 196µW. Averaging overN= 2 pulses and set-ting the gain for each pulse toGi = 6/Si optimises the feedback for power stability. Furthermore, by choosing Vo↵ = 8 V, the variable attenuator is in a regime where its response is approximately linear. AOM2 is configured to operate a few percent below its maximum di↵raction efficiency to provide sufficient range for stabilisation. In a similar fashion, lower power ranges were evaluated with the feedback via APD2 or APD1.
A limitation to the present implementation of the system is that if any of the APDs are subject to an opti-cal power of more than approximately twice the satura-tion power of 9µW, measurements of subsequent optical pulses in the sequence are distorted. After saturation, the APD voltage is negative and recovers to its accu-rate steady state in a double exponential decay (time 1
[image:9.595.147.445.96.244.2]constants 85 µs and 9 ms) with amplitudes dependent on saturating pulse power. Therefore, sufficient recov-ery time is required in instances where an earlier higher power pulse saturates an APD which is relied upon by a subsequent lower power pulse for accurate stabilisation. To eliminate this constraint, optical modulators could be used to ensure detector illumination by non-saturating pulses only.
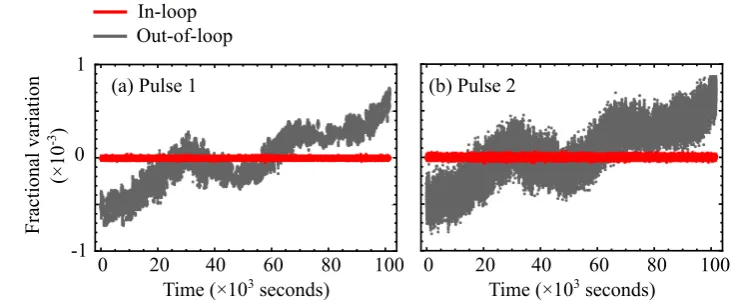
Figure 4(a) shows a long-term measurement of the fractional variation in pulse power (averaged over 1 sec-ond intervals) for pulse 1 with the stabilisation system engaged. Data from both the in-loop (red, APD3) and out-of-loop (grey, APD0-C) detectors are presented. Sim-ilarly, Fig. 4(b) shows the time series for pulse 2. In both cases there is some relative drift (⇠1⇥10 3over⇠105s) between the in- and out-of-loop signals over the duration of the measurement. We observe correlations between measured laboratory humidity and the data, suggesting that this causes variations in the reflectivity of the beam-splitter optical coating. This e↵ect could be reduced by using a beamsplitter coating created by ion-beam sput-tering, rather than by physical vapour deposition as per the optics used in this experiment. For all the data pre-sented in this work, the ambient laboratory tempera-ture was stable to within ±0.1 K. This corresponds to changes in surface reflectivity of 4⇥10 6 for the op-tical materials used (fused silica and N-BK7, thermo-optic coefficients dn/dT < 10 5K 1) [29, 30], render-ing such e↵ects negligible. The intrinsic electronic drift
of the Bessel filter and analogue input card was mea-sured to be negligible compared to drift level shown in Fig. 4. Drifts in the dark current of each APD are ac-counted for by the measurement ofDnin every sequence. Small alignment drifts of the beam across each APD sur-face of non-uniform quantum efficiency are expected to contribute relative signal fluctuations of 10 4. The APD module contains a microcontroller to compensate temperature-induced fluctuations in gain, and an experi-mental comparison with an unbiased Hamamatsu S-1337 PIN photodiode shows agreement to4⇥10 4.
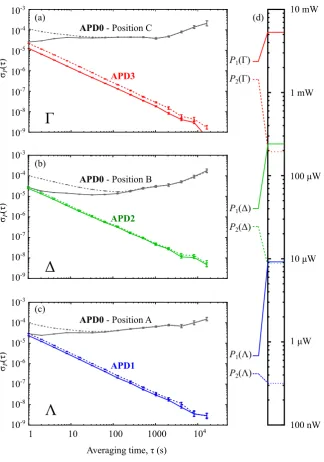
In order to quantify the instability of the system on varying time-scales, we use the data presented in Fig. 4 to calculate the 2-sample fractional Allan deviation [31], as shown in Fig. 5(a). The Allan deviations P as a func-tion of averaging time ⌧ for the in-loop measurements are shown as solid and dashed red lines for pulse 1 and 2 respectively. Similarly, out-of-loop measurements are shown in grey. The experimental run during which this data was acquired is denoted . To show e↵ective sta-bilisation over the full dynamic range of the system, two further experimental runs, similar to , were performed. In experiment (⇤), APD2(APD1) and APD0 in posi-tion B(A) were used as the in- and out-of-loop detectors respectively. The corresponding Allan deviations for and⇤are given in Fig. 5(b,c). In Fig. 5(d), the power of each pulse at the ion is shown on a logarithmic scale. As the ranges of the measurements overlap, it is clear that the pulse power stabilisation system can be e↵ectively 1
0 20 40 60 80 100 Time (×103 seconds)
0 20 40 60 80 100 0
-1 1
Time (×103 seconds)
Fra
ct
iona
l va
ri
at
ion
(×
10
-3 )
(a) Pulse 1 (b) Pulse 2 In-loop
Out-of-loop
Fig. 4 (a) and (b) show the fractional variation in pulse power (relative to the mean) over 1 second intervals, as measured
on the in-loop (red - APD3) and out-of-loop (grey - APD0 in position C) detectors, for pulse 1 and 2 respectively. The lower
signal-to-noise ratio when measuring pulse 2 is evident in the greater noise amplitude in (b). Here the pulse powers at the ion
areP1 = 5.17 mW andP2 = 196µW.
utilised over the full dynamic range of the system, and the out-of-loop fractional Allan deviation is<2.2⇥10 4 for all averaging times from 1 to 16384 seconds for all three experiments. It is informative to compare these re-sults to the scenario whereby the single-ion response is used as the stabilisation discriminant; i.e. measuring ex-citation probability for a⇡/2 pulse. Based on the quan-tum projection noise limit, and neglecting all other sys-tematic e↵ects, a 2 ms interrogation cycle results in a fractional instability of power at 10 4only after
⇠2 hrs of averaging. While a linear improvement could be re-alised using a (2n+ 1)⇡/2 pulse, it remains orders of magnitude slower than our approach. In section 4, the implications of the measured levels of instability are dis-cussed in the context of high-fidelity quantum gate op-erations.
3 Beam pointing stabilisation
The aforementioned pulse power stabilisation scheme can operate concurrently with an independent feedback sys-tem for stabilising the focused laser beam position to the ion trap center. This is based on a quadrant photodiode (QPD) onto which the beam waist at the trap center is imaged. The apparatus and principles of the feedback loop, as well as results which characterise the long-term instability of the system, are presented in this section.
3.1 Beam position stabilisation system - experimental
setup
The beam that coherently controls the trapped ion is transmitted through the vacuum chamber and incident on a beamsplitter (see Fig. 6). Each subsequent beam is imaged onto an independent QPD (ThorLabs PDQ80A). Each QPD produces two di↵erence signals
[image:11.595.108.474.90.244.2]Averaging time, τ (s) 10-9
10-8 10-7 10-6 10-5 10-4 10-3
σP
(
τ
)
(c) 10-9 10-8 10-7 10-6 10-5 10-4 10-3
σP
(
τ
)
(b) 10-9 10-8 10-7 10-6 10-5 10-4 10-3
σP
(
τ
)
10
1 100 1000 104
(a)
100 nW 1 μW 10 μW 100 μW 1 mW 10 mW
APD0 - Position C
APD0 - Position B
APD0 - Position A
Δ
Γ
Λ
P1(Γ)
P2(Γ)
P1(Δ)
P2(Δ)
P1(Λ)
P2(Λ) APD1
APD2 APD3
(d)
Fig. 5 (a-c) show the Allan deviation of in-loop (colored) and out-of-loop (grey) measurements for pulse 1 (solid) and pulse
2 (dashed) in experiments , and⇤respectively. The power at the ion for each pulse is shown on a logarithmic power scale
in (d). The range of each experiment overlaps, showing that the stabilisation can be e↵ectively utilised over the full range of
the system.
ing to the horizontal (xdi↵) and vertical (ydi↵) displace-ments in the laboratory frame. These are measured by the analogue input card and, by means of external cali-bration factors↵xand↵y, are used to infer the position of the beam focus in the plane of the ion. QPD1
oper-ates as the in-loop detector from which a discriminant is derived, whereas QPD2 serves as an out-of-loop monitor.
Beam pointing is controlled by a piezo-actuated mir-ror (New Focus Picomotor 8885), with an angular reso-lution of 1.5µrad, corresponding to a step size of 180 nm
[image:12.595.134.459.86.549.2]Ion trap
Picomotor mirror mount controller
xdiff= Qq2 S q4D - Qq1 S q3D ydiff= Qq1 S q2D - Qq3 S q4D
Analogue input
Measure position from calibrationα
x=αxxdiff y=αyydiff
Calculate difference from setpoint
Δx=x-x0 Δy=y-y0
Generate feedback with gain factor g xsteps=gxΔx ysteps=gyΔy
q1 q2 q3 q4
y
x
Lab Computer
QPD2 QPD1
USB
ydiff2
xdiff2
ydiff1
xdiff1
GT BS BS
Pin-loop
L2
L1 L3 L4
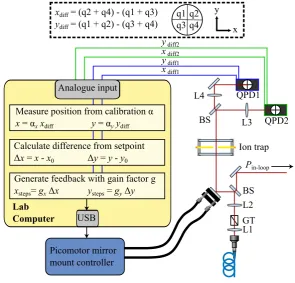
Fig. 6 Schematic of hardware used in a feedback loop to stabilise position of the beam waist. Lenses focus the beam to a
waist 2w0 = 45 µm at the trap center, and image this waist onto the QPDs. Measurements of the di↵erence signalsxdi↵ andydi↵ on QPD1 are used to generate the feedback signal for the Picomotor mirror mount. QPD2 performs an out-of-loop measurement of the beam position. GT; Glan-Taylor polariser, BS; 50:50 beam splitter, L1; multi-elementf = 29 mm, L2;
achromatic doubletf = 200 mm, L3 and L4; achromatic doubletf = 100 mm.
at the ion. When combined with a translation stage to set the longitudinal position of the focusing lens, this enables precise positioning of the beam waist inside the vacuum chamber. Repeatable beam positioning is achieved with QPD1 as a spatial reference, thus circumventing hysteresis of the Picomotor. Since the laser beam origi-nates from a single-mode fibre, contributions to the QPD signals from instabilities in the transverse mode profile of the beam are considered negligible. We note that a com-mercial system [32] promises pointing stability suited to this application (i.e. servo loop accuracy quoted as
<1µm,<1µrad). However, servo loop accuracy alone is insufficient for the purposes of this work, since an out-of-loop Allan deviation measurement is nevertheless re-quired to validate the performance of beam pointing sta-bilisation [33]. This measurement is detailed in section 3.2.
3.2 Beam position stabilisation system - concept and
results
For stabilisation, the di↵erence between the co-ordinates of the measured beam position (x, y) and a user-defined 1
[image:13.595.145.441.90.373.2]set-point (x0, y0) form a discriminant (see yellow shaded box, Fig. 6). A feedback correction is derived in terms of number of Picomotor stepsxsteps andysteps, via user-defined gain settingsgxandgy. Using proportional feed-back only, the system stabilises the measured position to the chosen setpoint within the limits of the Picomotor angular resolution.
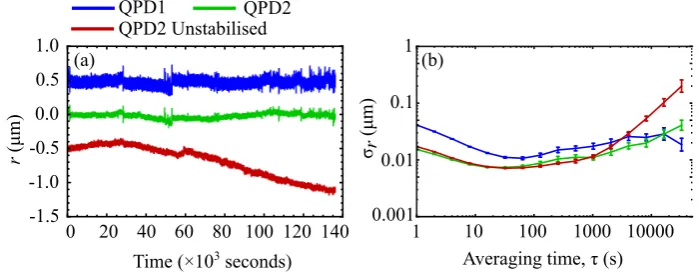
Signals arising from a position-stabilised beam in-cident on QPD1 and QPD2 were recorded for 35 hours over 1 second intervals; optimised feedback was achieved with gx = gy = 0.6. The resulting time series for the in- and out-of-loop measurements for r=px2+y2, as well as the corresponding absolute Allan deviations, are shown in Fig. 7; this shows that r<0.1 µm for all av-eraging times. Some disagreement between the in- and out-of-loop measurements is evident, possibly due to dif-ferential drift of the opto-mechanical components in the separate optical paths after the beamsplitter. However, for a typical spot size of 2w0 = 45 µm as used in our experiment, the peak-to-peak drift as measured on both QPDs is<1 % of the beam diameter.
For comparison, data showing passive stability of the opto-mechanical system is also presented in Fig. 7(a). This demonstrates that in practice, it will suffice to en-gage the position stabilisation feedback for a few seconds duration at intervals of approximately 1 hour (see Fig. 7(b)). In our laboratory the beam path is well-shielded from air currents arising from air conditioning, which can distort beam pointing, but in other laboratory
en-vironments this may not be the case [34]. The method presented here can of course be used at much shorter intervals (e.g. ⇠1 s) to monitor and compensate beam drift in less benign environments. It is straightforward to interleave such a procedure between the acquisition of complete data sets for coherent control routines. The system does not compensate for positional drifts of the ion trap electrode structure with respect to the optical components used for stabilisation. However in our appa-ratus, di↵erential movement between the ion trap chip [35] and the compact vacuum chamber [36] is eliminated as they are bonded directly together; the chamber and a compact opto-mechanical setup are mounted directly onto a single breadboard. With no detectable drift of the fluorescence images of laser-cooled ions, we expect trap-to-beam di↵erential drifts to be no greater than those shown in Fig. 7(a).
4 Estimates of intensity-induced contributions to trapped-ion quantum gate infidelity
The principal aim of this system is to achieve an inten-sity instability which is low enough that this parameter alone contributes 10 4 to the overall infidelity of a quantum gate. To determine the viability of meeting this criterion, the measured instabilities in laser power and beam pointing were used to estimate the associated con-tribution to infidelity for two laser-driven quantum gate operations, namely the Pauli X and Mølmer-Sørensen entangling gates.
0 20 40 60 80 100 120 140
Time (×103seconds)
0.0 0.5
-0.5 1.0
-1.0
r
(
μ
m)
-1.5
QPD2 QPD1
QPD2 Unstabilised
1 10 100 1000 10000
Averaging time,τ(s)
0.001 0.01 0.1 1
σr
(
μ
m)
(a) (b)
Fig. 7 (a) Deviation of the beam position from its original value as detected on the in-loop (blue, QPD1) and out-of-loop
(green, QPD2) detectors with the feedback system engaged. Beam position data recorded with the unstabilised, free-running
system is shown for comparison (red). Data sets are o↵set vertically for clarity. (b) Corresponding Allan deviation of the data
shown in (a), showing a close agreement between the two measurements over all averaging times.
We consider ions with internal ground and excited states |gi and |ei respectively, which are coupled to a (near-) resonant optical pulse with Rabi frequency ⌦. A Pauli X-gate acts on a single ion in an initial state | ii = a|gi+bei |ei to produce a target state | ti = bei
|gi+a|ei. The fidelity of the operation is Fx = |h t|U(t)| ii|2, where
U(t) =
0 B B @
cos(⌦t/2) iei sin(⌦t/2) iei sin(⌦t/2) cos(⌦t/2)
1 C C
A (2)
represents the interaction of the optical pulse of phase with an ion for durationt. Expanding and simplifying Fxgives
Fx=1 2[a
4+ 4a2b2+b4 (a4+b4) cos(⌦t)
+2a2b2cos(2 )(1 + cos(⌦t))], (3)
which is unity when the desired Rabi frequency ⌦0 = ⇡/t. In the event of a small error ⌦ = ⌦ ⌦0, a Taylor expansion of Fx(⌦) shows that the minimum fi-delity Fx,min occurs for | ii = |gi, |ei and [sin✓|gi+
ei(n+1/2)⇡cos✓
|ei]. In this case, the maximum infidelity due to Rabi frequency error, (1 Fx,min)⌦, is
(1 Fx,min)⌦ ⇡(⇡/2)2( ⌦/⌦)2. (4)
When a two-ion string is initialised in the ground state |ggi and subject to the Mølmer-Sørensen entan-gling gate [37], the maximally entangled state| maxi= (1/p2)[|ggi i|eei] is produced with fidelity FM S =
h max|⇢| maxi= (⇢gg,gg+⇢ee,ee)/2 + Im⇢ee,gg [10, 38,
39]. | maxi is created when the optical pulse duration T = 2⇡/✏, where ✏ is the gate detuning [10]. Under this condition, and noting earlier theoretical investiga-tion [38], we calculate the gate fidelity for ions cooled to the motional ground state to be
FM S= 1 2+
1 2sin
✓2⇡⌦2⌘2 ✏2
◆
, (5)
where⌘is the Lamb-Dicke parameter (a measure of the extent of the ion’s ground-state wavefunction),
⌘=k
✓ ¯h
2m!
◆1/2
, (6)
[image:15.595.119.469.93.231.2]with k being the laser wavevector, and m and ! the ion’s mass and motional frequency respectively. For a small fractional error ⌦/⌦, the associated contribution to infidelity (derived by a Taylor expansion of equation 5 aboutFM S(⌦=⌦0) = 1), is given by
(1 FM S)⌦⇡(⇡/2)2( ⌦/⌦)2, (7)
which is consistent with [4, 10].
In the two examples just described, the infidelities (1 FM S)⌦ and (1 Fx,min)⌦have the same dependence
on Rabi frequency error. However, the measured physical parameters are instabilities in beam power and position. For an optical qubit, ⌦ / pP and equation 4 can be recast in P to give the contribution to infidelity from a fractional error in pulse power P/P as
(1 Fx,min)P ⇡(⇡/4)2( P/P)2, (8)
with (1 FM S)P having the same dependence.
Concerning the contribution to infidelity from small fluctuations r in beam position, we consider first the single-qubit gate in an experimentally realistic scenario where the focused beam is imperfectly centered on the ion. It is assumed that the ion sits at an o↵set r1 from the center of a Gaussian beam (r1⌧w0), and that the pulse power and duration are optimised for maximum fidelity. Noting that⌦has a Gaussian dependence onr, equation 4 can be rewritten in terms ofr, to give
(1 Fx,min)r⇡⇡2(r1 r/w02)2. (9)
For the beam diameter 2w0 = 45µm used in this appa-ratus, the beam can be positioned easily such that the ion sits well within 2µm of beam centre. This is achieved by performing pulsed-probe spectroscopy as the beam is raster-scanned across the ion.
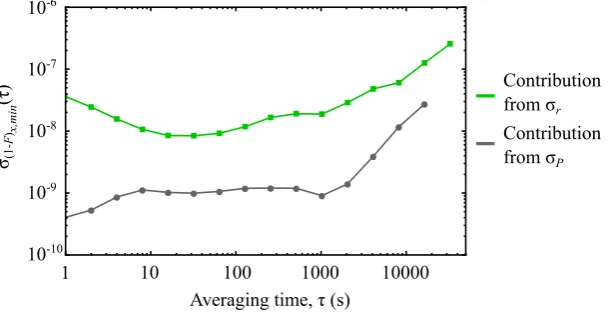
Based on equations 8 and 9, Fig. 8 shows the pro-jected Allan deviation in infidelity (1 Fx,min) arising
from the measured instabilities in power and position of the laser beam alone. The contribution from power variations is calculated by setting the values of P from data setP2( ) (which has the highest average value of those shown in Fig. 5) as P/P in equation 8. Simi-larly the contribution from beam position fluctuations are calculated by setting the out-of-loop values of r in Fig. 7(b) as rin equation 9 at an o↵setr1= 2µm in a beam of 2w0= 45µm. Figure 8 shows that the projected deviation in (1 Fx,min) is orders of magnitude below the 10 4threshold (as discussed in the introduction) for all experimental averaging times.
For the Mølmer-Sørensen two-qubit gate, the depen-dence of (1 FM S) on⌦can only be considered identical to that for (1 Fx,min) (as per equations 4 and 7), when both ions are illuminated equally;i.e. ⌦1 =⌦2, where the subscript denotes the individual ions. In that case, the contributions to infidelity would be identical to those in Fig. 8. Experimentally, setting ⌦1 =⌦2 will require engaging the power stabilisation and measuring the Rabi frequencies on both ions at di↵erent beam positions. 1
1 10 100 1000 10000 Averaging time, τ (s)
10-10 10-9 10-8 10-7 10-6
σ
(1-F
)x,mi
n
(
τ
)
Contribution from σP
Contribution from σr
Fig. 8 Projected Allan deviation of the contributions to single-qubit infidelity, (1 Fx,min), due to beam power (grey) and
position (green) instabilities. Calculations assume a laser-driven optical qubit transition and use measurements of P and r.
The contribution from r is plotted for a beam of 2w0 = 45 µm with an ion o↵set by r1 = 2 µm from beam center. The contribution from each data set, and the in-quadrature sum of both, is much less than a fault-tolerant threshold of 10 4 for all averaging times. For laser-driven hyperfine qubits, the projected infidelities would be four times greater than the data sets
presented here.
In the case where there is a small mismatch and⌦16= ⌦2, one must consider the e↵ective Rabi frequency for the interaction⌦, wheree ⌦e/⌦1⌦2[37, 38]. For a small di↵erence in ion illumination 2 ⌦12, such that⌦1=⌦0+ ⌦12and⌦2=⌦0 ⌦12, then⌦e /(⌦20 ⌦122 ), where ⌦0 is the optimum value for ⌦1 and ⌦2 to create the maximally-entangled state. Thus the associated error in the rotation angle on the Bloch sphere is proportional to ⌦2
12. In turn, it can be shown that the contribution to the Mølmer-Sørensen infidelity, due to ⌦12 alone, is [40]
(1 FM S)imbalance⇡(⇡/4)2( ⌦12/⌦0)4 (10)
To estimate the magnitude of (1 FM S)imbalance, we as-sume an inter-ion separation of 4µm, with the centre of the pair o↵set byr1= 2µm in a beam of 2w0 = 45µm.
The largest imbalance will occur when the ion string axis is aligned radially in the beam. In such a scenario, 2 ⌦12/⌦0= 3 %, which results in (1 FM S)imbalance= 3⇥ 10 8, which is a similar magnitude to the infidelity con-tribution arising from beam position instability. By way of comparison, earlier work with ions in thermal states reported numerical simulations which predicted that an imbalance of 4 % would contribute an infidelity of 10 4 [39]. These estimates suggest that our stabilisation sys-tem would reduce intensity-induced contributions to in-fidelity in the Mølmer-Sørensen gate to well below the level of 10 4.
[image:17.595.145.450.93.250.2]5 Summary & conclusions
We have demonstrated an optical system for stabilising the intensity of a laser beam used in a pulsed-probe con-figuration for the coherent control of trapped ions. The system operates via two independent feedback loops; one for optical power and the other for laser beam position. Due to a cascaded arrangement of three avalanche photo-diodes, the power at the ion can be measured indirectly over the range 300 nW P 5.2 mW, with a signal-to-noise ratio >100. The system response is calibrated over this power range, which permits accurate setting of optical power at the ion for each pulse in a sequence. The exact position of the beam waist at the ion was stabilised by means of a quadrant photodiode and an actuated mirror. System performance was quantified by out-of-loop measurements of both power and beam posi-tion. Instability of optical power over the full range had a 2-sample fractional Allan deviation of P <2.2⇥10 4, for averaging times 1 s⌧16384 s. In the case of the beam position, the Allan deviation yielded an absolute value of r<0.1µm (for a beam with 2w0= 45µm), for similar averaging times. This system was developed for the 674 nm optical qubit transition in88Sr+, however it is applicable to analogous species such as40Ca+, as well as to laser-driven hyperfine qubits in, e.g.,9Be+,43Ca+ and171Yb+.
There is a small risk in projecting the measured out-of-loop performance to the Rabi frequency experienced
by ions. While it seems reasonable to assume that the measured out-of-loop power and position fluctuations should cause commensurate intensity fluctuations at the ion position, this is not necessarily so. It is essential to guard against drifts in beamsplitter reflectivity, as well as drifts and vibrations of the ion trap with respect to the surrounding optical system. We investigated the sources likely to contribute to such errors arising from beam power; a suitably robust opto-mechanical system will prevent errors in beam pointing arising from vibra-tions. Intensity instability measurements using the ion response would su↵er on a short term from the quantum projection noise limit, and on a longer term by other systematic drifts changing the ion response. Thus the out-of-loop measurement approach to test the long-term intensity instability is the most efficient way to establish an upper limit for that parameter.
The implications of these measurements on infideli-ties in quantum gate operations have been estimated by considering a Pauli X single qubit rotation and a two-qubit Mølmer-Sørensen gate. The minimum fidelity of the former and the fidelity of creating a 2-ion maximally entangled state with the latter have the same sensitivity to Rabi frequency instability. Concentrating on the opti-cal qubit transitions, we opti-calculated that the instabilities in power and beam position are expected to yield con-tributions to infidelities of<3⇥10 8 and <3
⇥10 7 respectively, well below the generally accepted threshold of 10 4 for fault-tolerant quantum information 1
ing. In the case of the Mølmer-Sørensen gate, a small (⇠3 %) imbalance in the Rabi frequencies experienced by each ion is expected to contribute to the infidelity at a similar level to that of the beam position insta-bility. Two-qubit gates based on laser-driven hyperfine transitions require a pair of laser beams interfering at the position of the trapped ions to produce a travel-ling standing wave parallel to the linear trap axis. Since the beams are spatially separated, each will require inde-pendent stabilisation; an indeinde-pendent, parallel system of APDs, quadrant photodiodes, electronics and feedback actuators will be necessary for each beam. Furthermore, the e↵ective Rabi frequency for the stimulated Raman transition scales as the product of the pair of individ-ual Rabi frequencies. While the analysis above has been performed for laser-driven optical qubit transitions, it is straightforward to show that hyperfine transitions driven by a stimulated Raman transition are four times more sensitive in equations 4, 7, 8, and 9. Taking this into con-sideration, the instability achieved here would result in an infidelity contribution of<1.2⇥10 6 in a hyperfine two-qubit gate.
Standard commercial laser systems have typical power instabilities no better than 1 %, which is insufficient for achieving an overall gate infidelity of 10 4, so a sta-bilisation scheme is essential. The power and position instabilities reported here may seem negligible or indeed excessively small for present applications. However, re-ducing all sources of infidelity well below a threshold of
10 4is an important goal, because the magnitude of re-sources required for error correction will depend on the total infidelity [2]. In the long term, it is advantageous to achieve infidelities much lower than the 10 4 threshold criterion, and in doing so minimise the overhead required for error correction.
The present system has a minimum pulse duration of 10µs, which is sufficient for the duration of the highest fidelity gates (30 - 100µs) [4, 11]. Shorter pulses for fast gates [41] will require a sampling rate and a low-pass fil-ter frequency greafil-ter than those in our apparatus. An al-ternative photodiode may be required to optimise signal-to-noise; however, equation 8 and Fig. 8 show that P could increase by a factor of⇠10 without a significant compromise to the overall infidelity (either (1 Fx,min) or (1 FM S)). Application to picosecond laser pulses for ultrafast qubit control [42] is beyond the present system.
Finally, the level of intensity instability demonstrated here was achieved over extended periods of duration. This is essential for the most complex investigations con-ducted now and in the future, and points towards a continuously operating laser system which is accurate and precise in intensity. The system presented here will be used together with a frequency stabilisation system based on a low-drift, high-finesse cavity (Stable Laser Systems) for coherent control of 88Sr+ in a microfabri-cated trap of similar concept to our earlier work [35, 36, 43].
Acknowledgements
We thank E. Theocharous (NPL) for assistance in de-tector characterisation. We thank the following individ-uals for informative discussions: D. Szwer (NPL), D. Lu-cas and C. Ballance (Oxford), and C. Roos (Innsbruck). This work was funded by the UK National Measurement Office and project EXL01 QESOCAS of the European Metrology Research Programme (EMRP) [Grant Agree-ment No. 912/2009/EC]. The EMRP is jointly funded by the EMRP participating countries within EURAMET and the European Union. JT was supported by the EP-SRC Industrial Doctorate Centre in Optics and Photon-ics. BY was supported by an EPSRC Knowledge Trans-fer Secondment from Imperial College London.
References
1. A. M. Steane, “Overhead and noise threshold of
fault-tolerant quantum error correction,” Phys. Rev. A 68,
p. 042322, Oct 2003.
2. E. Knill, “Quantum computing with realistically noisy
devices,”Nature434(7029), pp. 39–44, 2005.
3. R. Raussendorf, J. Harrington, and K. Goyal,
“Topolog-ical fault-tolerance in cluster state quantum
computa-tion,”New Journal of Physics9(6), p. 199, 2007.
4. J. P. Gaebler, T. R. Tan, Y. Lin, Y. Wan, R. Bowler,
A. C. Keith, S. Glancy, K. Coakley, E. Knill, D. Leibfried,
and D. J. Wineland, “High-fidelity universal gate set for
9Be+
ion qubits,” Phys. Rev. Lett.117, p. 060505, Aug
2016.
5. R. Blatt and D. Wineland, “Entangled states of trapped
atomic ions,”Nature453(7198), pp. 1008–1015, 2008.
6. Q. A. Turchette, C. S. Wood, B. E. King, C. J.
My-att, D. Leibfried, W. M. Itano, C. Monroe, and D. J.
Wineland, “Deterministic entanglement of two trapped
ions,”Phys. Rev. Lett.81(17), pp. 3631–3634, 1998.
7. C. A. Sackett, D. Kielpinski, B. E. King, C. Langer,
V. Meyer, C. J. Myatt, M. Rowe, Q. A. Turchette, W. M.
Itano, D. J. Wineland, and C. Monroe,
“Experimen-tal entanglement of four particles,” Nature 404(6775),
pp. 256–259, 2000.
8. M. A. Rowe, D. Kielpinski, V. Meyer, C. A. Sackett,
W. M. Itano, C. Monroe, and D. J. Wineland,
“Exper-imental violation of a Bell’s inequality with efficient
de-tection,”Nature409(6822), pp. 791–794, 2001.
9. D. Leibfried, B. DeMarco, V. Meyer, D. Lucas, M.
Bar-rett, J. Britton, W. M. Itano, B. Jelenkovic, C. Langer,
R. T., and D. J. Wineland, “Experimental demonstration
of a robust, high-fidelity geometric two ion-qubit phase
gate,”Nature422(6930), pp. 412–415, 2003.
10. J. Benhelm, G. Kirchmair, C. F. Roos, and R. Blatt,
“To-wards fault-tolerant quantum computing with trapped
ions,”Nature Phys.4, pp. 463–466, 2008.
11. C. J. Ballance, T. P. Harty, N. M. Linke, M. A. Sepiol,
and D. M. Lucas, “High-fidelity quantum logic gates
us-ing trapped-ion hyperfine qubits,”Phys. Rev. Lett.117,
p. 060504, Aug 2016. Also see Supplemental Material at
http://link.aps.org/supplemental/10.1103/PhysRevLett.117.060504.
12. E. Knill, “Physics: quantum computing,” Nature
463(7280), pp. 441–443, 2010.
13. T. D. Ladd, F. Jelezko, R. Laflamme, Y. Nakamura,
C. Monroe, and J. L. O’Brien, “Quantum computers,” 1
Nature464, pp. 45–53, 2010.
14. D. Leibfried, R. Blatt, C. Monroe, and D. Wineland,
“Quantum dynamics of single trapped ions,”Rev. Mod.
Phys.75(1), pp. 281–324, 2003.
15. K. R. Brown, A. C. Wilson, Y. Colombe, C. Ospelkaus,
A. M. Meier, E. Knill, D. Leibfried, and D. J. Wineland,
“Single-qubit-gate error below 10 4 in a trapped ion,” Phys. Rev. A84, p. 030303, Sep 2011.
16. T. P. Harty, D. T. C. Allcock, C. J. Ballance, L. Guidoni,
H. A. Janacek, N. M. Linke, D. N. Stacey, and D. M.
Lu-cas, “High-fidelity preparation, gates, memory, and
read-out of a trapped-ion quantum bit,”Phys. Rev. Lett.113,
p. 220501, Nov 2014.
17. T. R. Tan, J. P. Gaebler, Y. Lin, Y. Wan, R. Bowler,
D. Leibfried, and D. J. Wineland, “Multi-element
logic gates for trapped-ion qubits,” Nature 528(7582),
pp. 380–383, 2015.
18. T. R. Tan, J. P. Gaebler, R. Bowler, Y. Lin, J. D. Jost,
D. Leibfried, and D. J. Wineland, “Demonstration of a
dressed-state phase gate for trapped ions,” Phys. Rev.
Lett.110, p. 263002, Jun 2013.
19. A. C. Wilson, Y. Colombe, K. R. Brown, E. Knill,
D. Leibfried, and D. J. Wineland, “Tunable spspin
in-teractions and entanglement of ions in separate potential
wells,”Nature512(7512), pp. 57–60, 2014.
20. P. Schindler, D. Nigg, T. Monz, J. T. Barreiro, E.
Mar-tinez, S. X. Wang, S. Quint, M. F. Brandl, V.
Neben-dahl, C. F. Roos,et al., “A quantum information
proces-sor with trapped ions,”New J. Phys.15(12), p. 123012,
2013.
21. N. Akerman, N. Navon, S. Kotler, Y. Glickman, and
R. Ozeri, “Universal gate-set for trapped-ion qubits
us-ing a narrow linewidth diode laser,”New J. Phys.17(11),
p. 113060, 2015.
22. Z. Meir, O. Schwartz, E. Shahmoon, D. Oron, and R.
Oz-eri, “Cooperative Lamb shift in a mesoscopic atomic
ar-ray,”Phys. Rev. Lett.113, p. 193002, Nov 2014.
23. J. Thom, G. Wilpers, E. Riis, and A. G. Sinclair,
“Ac-curate and agile digital control of optical phase,
ampli-tude and frequency for coherent atomic manipulation of
atomic systems,”Opt. Express21, pp. 18712–18723, Aug
2013.
24. E. Theocharous and E. M. Wareham, “Ultra-high
per-formance photodetection systems for radiometric
appli-cations,”Meas. Sci. Technol.15(6), p. 1216, 2004.
25. E. Theocharous, J. Ishii, and N. P. Fox, “Absolute
linear-ity measurements on HgCdTe detectors in the infrared
region,”Appl. Opt.43, pp. 4182–4188, Jul 2004.
26. E. Theocharous, “Absolute linearity measurements on a
PbS detector in the infrared,”Appl. Opt.45, pp. 2381–
2386, Apr 2006.
27. E. Theocharous, M. A. Itzler, J. Cheung, and C. J.
Chunnilall, “Characterization of the linearity of response
and spatial uniformity of response of two InGaAsP/InP
Geiger-mode avalanche photodiodes,” IEEE J. Quant.
Electron.46, pp. 1561–1567, Nov 2010.
28. C. F. Roos, “Ion trap quantum gates with
amplitude-modulated laser beams,”New J. Phys.10(1), p. 013002,
2008.
29. D. B. Leviton and B. J. Frey, “Temperature-dependent
absolute refractive index measurements of synthetic
fused silica,”Proc. SPIE6273, pp. 62732K–62732K–11,
2006.
30. B. J. Frey, D. B. Leviton, T. J. Madison, Q. Gong, and
M. Tecza, “Cryogenic temperature-dependent refractive
index measurements of N-BK7, BaLKN3, SF15, and
E-SF03,”Proc. SPIE6692, pp. 669205–669205–12, 2007.
31. D. Allan, “Statistics of atomic frequency standards,”
Proc. of the IEEE54, pp. 221–230, Feb 1966.
32. TEM Messtechnik GmbH
http://www.tem-messtechnik.de/EN/aligna.htm.
33. R. Walder, D. H. Paik, M. S. Bull, C. Sauer, and
T. T. Perkins, “Ultrastable measurement platform:
sub-nm drift over hours in 3d at room temperature,” Opt.
Express23, pp. 16554–16564, Jun 2015.
34. E. Mount, C. Kabytayev, S. Crain, R. Harper, S.-Y.
Baek, G. Vrijsen, S. T. Flammia, K. R. Brown, P. Maunz,
and J. Kim, “Error compensation of single-qubit gates
in a surface-electrode ion trap using composite pulses,”
Phys. Rev. A92, p. 060301, Dec 2015.
35. G. Wilpers, P. See, P. Gill, and A. G. Sinclair, “A
mono-lithic array of three-dimensional ion traps fabricated with
conventional semiconductor technology,” Nature
Nan-otech.7, pp. 572–576, 2012.
36. G. Wilpers, P. See, P. Gill, and A. G. Sinclair, “A
com-pact UHV package for microfabricated ion-trap arrays
with direct electronic air-side access,” Appl. Phys. B
111(1), pp. 21–28, 2013.
37. K. Mølmer and A. Sørensen, “Multiparticle
entangle-ment of hot trapped ions,”Phys. Rev. Lett.82, pp. 1835–
1838, Mar 1999.
38. A. Sørensen and K. Mølmer, “Entanglement and
quan-tum computation with ions in thermal motion,” Phys.
Rev. A62, p. 022311, Jul 2000.
39. G. Kirchmair, J. Benhelm, F. Zhringer, R. Gerritsma,
C. F. Roos, and R. Blatt, “Deterministic entanglement of
ions in thermal states of motion,”New Journal of Physics
11(2), p. 023002, 2009.
40. C. F. Roos, private communication.
41. M. Palmero, S. Mart´ınez-Garaot, D. Leibfried, D. J.
Wineland, and J. G. Muga, “Fast phase gates with
trapped ions,”Phys. Rev. A95, p. 022328, Feb 2017.
42. J. Mizrahi, B. Neyenhuis, K. G. Johnson, W. C.
Camp-bell, C. Senko, D. Hayes, and C. Monroe, “Quantum
con-trol of qubits and atomic motion using ultrafast laser
pulses,”Applied Physics B114(1), pp. 45–61, 2014.
43. P. See, G. Wilpers, P. Gill, and A. G. Sinclair,
“Fabrica-tion of a monolithic array of three dimensional Si-based
ion traps,”J. Microelectromech. Syst.22, pp. 1180–1189,
2013.