Performance of high growth firms in Scotland
12 Moving on from the ‘Vital 6%’, ERC, 2014
13 See for example High Growth Firms and Productivity - Evidence from the United Kingdom (Nesta 2013) 14 Scotland’s national Performance Framework
15 Eurostat − OECD Manual on Business Demography Statistics 16 High Growth Enterprises 2013-2016, ONS 2017
17 For example, 2016 data refers to enterprises that have grown by at least 20% over the preceding three years i.e. 2013-2016
18 ONS note that turnover data should be used with caution as they are derived mainly from administrative sources which they are unable to validate.
Jennifer Turnbull and Kenny Richmond, Scottish Enterprise
Abstract
High growth firms contribute disproportionately to economic growth. This paper summarises new data for Scotland, and compares performance to other UK regions in high growth performance. The analysis considers the proportion of the business base that achieves high growth, characteristics of high growth firms in terms of size and productivity, and the pattern of high growth across local authority areas. The analysis shows that high growth firms in Scotland contribute less to economic and productivity growth than those in other parts of the UK.
1. Introduction
A range of research and analysis shows that high growth firms (HGFs) contribute disproportionately to economic growth. For example, in the UK over the 2010-13 period, HGFs accounted for about 1% of all job creating firms but 18% of the jobs created by job creating firms12. HGFs are also more likely to be exporters,
to innovate and to have higher levels of productivity than lower growth firms13. This suggests that HGFs are
more likely to create higher quality, higher paying jobs.
The number of HGFs is an indicator in Scotland’s National Performance Framework14, and developing a
better understanding of HGFs in Scotland will contribute to our evidence base on their contribution to economic and productivity performance.
This paper considers the latest data on high growth firms in Scotland, and uses the OECD definition: all enterprises with 10 or more employees and annual average growth (employment or turnover) of more than 20% per annum over three years (equal to 72.8% growth)15.
The analysis is based on a HGF dataset published by the Office for National Statistics (ONS)16, which
provides data on the number of HGFs by UK Government Region and local authority areas from 2013 to 201617, providing four years of trend data. Data is provided on high growth in terms of employment growth (Employment HGFs), turnover growth (Turnover HGFs) and employment & turnover growth combined (Employment & Turnover HGFs)18.
2.
High growth firms in Scotland
Table 1 shows the number of HGFs in Scotland over the period 2013 to 2016 and the number experiencing growth in employment, in turnover and in employment and turnover. Firms in Scotland (and in all other UK regions) were far more likely to achieve high growth through increases in turnover than in employment, with few firms reaching high growth via increases in both employment and turnover.
Table 1: Number and characteristics of HGFs in Scotland, 2013 - 2016
2013 2014 2015 2016
Turnover HGFs 1,285 1,385 1,865 1,945
Employment HGFs 800 980 830 910
Employment & Turnover HGFs 340 415 405 435
Source: ONS
Table 2: HGFs in Scotland as a percentage of UK by characteristic, 2013 -2016
2013 (%) 2014 (%) 2015 (%) 2016 (%)
Employment HGFs 6.4 6.9 6.8 6.7
Turnover HGFs 6.4 7.1 7.3 6.7
Employment & turnover HGFs 6.0 6.6 6.5 5.9
Source: ONS
The HGF rate is defined as the proportion of all 10+ employee firms that achieve high growth19, and it can be
used to compare Scotland’s HGF performance with other parts of the UK.
In terms of employment growth, Scotland’s HGF Employment rate it was 5.7% in 2016, the weakest
performance of all UK regions (Chart 1). Scotland has been in the bottom quartile each year since 2013. To match the Employment HGF rate of the UK average (6.4%), Scotland would need an additional 113 HGFs, and a further 87 to reach the Employment HGF rate of the top quartile of UK regions (6.2%)20.
Chart 1: Employment High Growth Firm rate (%) by UK Region, 2016
Source: ONS
19 The count of surviving enterprises with 10+ employees represents the starting point for the calculation of high growth units. Counts represent those units who were present in xx-3 with 10 or more employees and who survived to year xx. High Growth enterprises are then calculated from this population by measuring the change in employees between xx-3 and year xx. ONS (2017)
[image:2.595.47.547.435.711.2]Chart 2: Turnover High Growth Firm Rate (%) by UK region, 2016
Source: ONS
In terms of turnover growth, Scotland’s HGF turnover growth rate was 12.1% in 2016, again placing it last of all UK regions (Chart 2). Scotland was also in the bottom quartile in 2013, ranked in 11th place, although performance improved relative to other regions in 2014 (ranked in 6th place) and 2015 (ranked in 5th place). It is not clear from the data alone why Scotland’s relative performance has changed significantly over the period . To close the gap with the UK average rate, Scotland would need an additional 225 Turnover HGFs, and a further 200 to reach the rate of the top quartile of UK regions.
Chart 3: Employment & Turnover High Growth Firm Rate (%), 2016
Chart 4: Scottish Local Authority Employment HGF rate, 2016 (%)
Source: ONS
Chart 5: Scottish Local Authority Turnover HGF rate, 2016 (%)
Chart 6: Scottish Local Authority Employment & Turnover HGF Rate (%), 2016
Source: ONS
In terms of employment and turnover growth, Scotland’s HGF rate was 2.7% in 2016, ranking it (again) as the weakest of all UK regions (Chart 3) and Scotland was in the bottom quartile of UK regions in 2013, 2014 and 2015. To match the UK average rate, Scotland would need an additional 120 Employment & Turnover HGFs, and a further 121 to match the rate of the top quartile of UK regions.
HGFs of at least one definition can be found in each local authority area in Scotland. The largest number were in the cities of Glasgow, Edinburgh and Aberdeen (Appendix 1). Considering HGF rates (Charts 4 to 6), Midlothian had the highest Employment HGF and Turnover HGF rate in 2016, and West Dunbartonshire had the lowest. Overall, rural local authority areas tended to have lower HGF rates.
3.
Characteristics of HGFS
Average HGF Size
High growth firms tend to be larger than the general population of firms with 10+ employees21. The pattern
of firm size and by HGF type is broadly the same across each of the UK regions: the largest firms are Employment HGFs and Employment & Turnover HGFs. All three types of HGF are on average larger than HGF employment and HGF employment and turnover firms.
Scotland’s HGFs are smaller in terms of employment than the UK average, and smaller than most other UK regions (Charts 7 to 9)
Table 3: Average HGF firm size (number employed) Scotland and UK, 2016
Number of Employees
Scotland UK
Employment HGF 117 143
Employment & Turnover HGF 116 140
Turnover HGF 68 92
All 10+ emp 65 72
Source: ONS
Chart 7: Average number of employees per Employment HGF by UK region, 2016
Source: ONS
Chart 8: Average number of employees per high Turnover HGF by UK region, 2016
Chart 9: Average number of employees per Employment & Turnover HGF by UK region, 2016
Source: ONS
[image:7.595.50.552.405.629.2]HGF Productivity
Table 4: Index of Productivity of HGFs by UK region, 2016 (United Kingdom = 100)
Index of Productivity, UK=100
UK Region Turnover HGF Employment HGF Employment and Turnover HGF
United Kingdom 100 100 100
London 236 133 137
South East 77 138 159
East 56 59 58
Scotland 54 81 77
West Midlands 54 104 109
North East 53 57 59
South West 51 80 61
North West 49 78 70
Northern Ireland 48 93 100
Wales 41 98 103
East Midlands 40 68 78
Yorks & Humber 38 66 56
Source: ONS
Productivity is measured as turnover per employee. Although the turnover figures should be used with caution, the data suggest Scotland performed relatively strongly for productivity for Turnover HGFs (4th out of 12 UK regions). For Employment HGF and Employment & Turnover HGFs, Scotland was ranked 6th and 7th respectively. London and the South East of England had highest HGF productivity levels for all types of HGF (Table 4).
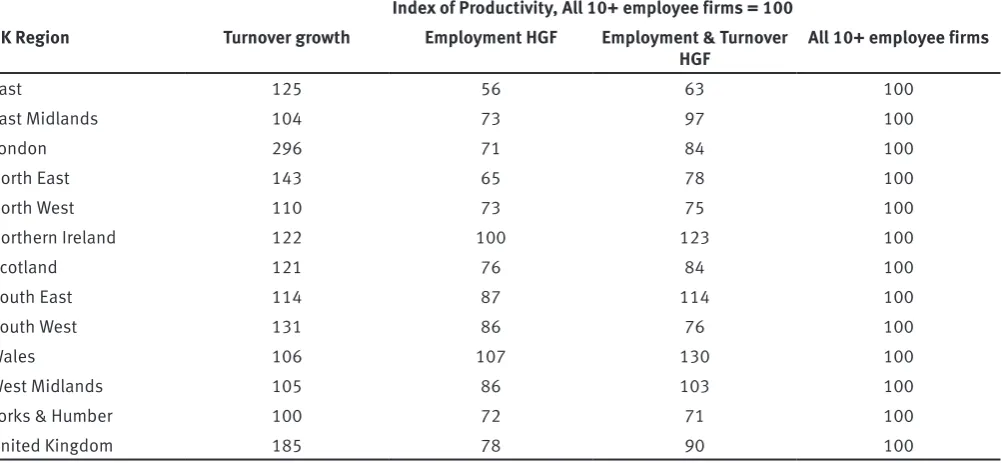
Table 5: Index of average HGF productivity levels relative to all 10+ employees firms (UK = 100) by UK region, 2016
Index of Productivity, All 10+ employee firms = 100
UK Region Turnover growth Employment HGF Employment & Turnover
HGF All 10+ employee firms
East 125 56 63 100
East Midlands 104 73 97 100
London 296 71 84 100
North East 143 65 78 100
North West 110 73 75 100
Northern Ireland 122 100 123 100
Scotland 121 76 84 100
South East 114 87 114 100
South West 131 86 76 100
Wales 106 107 130 100
West Midlands 105 86 103 100
Yorks & Humber 100 72 71 100
United Kingdom 185 78 90 100
Source: ONS
Sector of HGFs
Sector data on HGFs is only available for the UK as a whole, and only for Employment HGFs22. It is thought
likely that Scotland’s HGF sectoral mix will be broadly similar to the UK’s. The largest three sectors for Employment HGFs in 2016 in the UK were wholesale/retail, accommodation & food services and business administration & support services, which together accounted for almost 40% of all HGFs (Chart 10). This sectoral profile may in part explain why Employment HGFs have on average lower productivity, as jobs in the three largest sectors are generally lower paid, in particular wholesale/retail and accommodation & food services where average wages/salaries are 67% and 42% respectively of the overall average for the private sector economy23.
22 Count of ‘high growth’ enterprises for the period 2010 to 2016 by district, counties, unitary authorities and standard industrial
classification, ONS (2017)
Chart 10: Number of Employment HGFs in the UK by sector, 2016
Source: ONS
4.
Conclusions
Key findings from this analysis of HGF data are that:
■ Scotland’s HGF rate lags most and in some cases all UK regions, and this has been the case for most years over 2013-16;
■ Scotland’s HGFs tend to be smaller than those in most other UK regions, and have lower levels of productivity.
This suggests that HGFs in Scotland play a far less significant role in boosting economic and productivity growth than those in other UK regions. To illustrate the impacts of this ‘performance gap’, were Scotland’s Turnover HGF rate to match the UK average with average employment in each HGF being the same as the UK’s, this would result in 20,700 more people employed in high productivity firms24 in Scotland.
From the ONS data alone it is not possible to explain why Scotland’s HGF rates lags all other UK regions. Other data and research does, however, show that Scotland performs less well than many other UK regions on key drivers of business growth. For example, Scotland’s businesses tend to be less innovative than those in other UK regions25, are less likely to invest in R&D26 and are less likely to be exporters27. Also, Scotland has a lower business density than nearly all other UK regions, and this may reduce competitive pressures and business growth dynamism28.
Further research that could help our understanding of HGF dynamics would be an analysis of performance by sector across the UK regions, and whether there is a sectoral dimension to Scotland’s lower HGF rates
24 Scottish Enterprise calculation
25 UK Innovation Survey, UK Government (2018) 26 Scottish Government BERD Tables
27 Annual Business Survey Exporters and Importers, ONS (2017) and DIT national survey of registered businesses’ exporting behaviours, attitudes and needs 2017, DIT (2018)
(for example, the recent downturn in the oil and gas sector as a result of low oil prices is very likely to have affected the growth of a large number of oil and gas companies and suppliers – as the ONS data shows). Also, a more in-depth analysis of HGF rates in Scotland’s cities and how this compares to cities in other UK regions may highlight whether there is any geographical dimension to Scotland’s relatively weak HGF performance.
June 2018
Author details
Kenny Richmond Scottish Enterprise
Kenny.Richmond@scotent.co.uk Jennifer Turnbull
Scottish Enterprise
Appendix 1
Number of HGFs by Scottish local authority area, 201629
Employment HGFs Turnover HGFs Employment & Turnover HGFs
Glasgow City 145 315 20
Edinburgh City 115 270 20
Aberdeen City 60 115 5
Aberdeenshire 50 95 10
Highland 50 90 5
Fife 45 95 10
North Lanarkshire 45 90 20
South Lanarkshire 45 110 5
West Lothian 35 55 5
Dundee City 30 50 5
Renfrewshire 30 55 5
Midlothian 25 40 60
Perth & Kinross 25 55 0
Dumfries & Galloway 20 50 5
Angus 15 35 25
Argyll & Bute 15 35 75
East Ayrshire 15 25 20
East Lothian 15 30 5
North Ayrshire 15 35 10
South Ayrshire 15 35 5
Stirling 15 40 5
Clackmannanshire 10 15 25
East Dunbartonshire 10 20 0
East Renfrewshire 10 20 10
Falkirk 10 40 15
Inverclyde 10 20 5
Moray 10 25 0
Scottish Borders 10 30 5
Eilean Siar 5 15 25
Shetland Islands 5 15 5
West Dunbartonshire 5 10 0
Orkney Islands 0 10 15
Scotland 910 1,945 435