Design and Analysis of Collision Reduction
Algorithms for LED-Based Indoor Positioning
With Simulation and Experimental Validation
OLAOLUWA R. POPOOLA , (Student Member, IEEE), AND SINAN SINANOVIĆ School of Engineering and Built Environment, Glasgow Caledonian University, Glasgow G4 0BA, U.K.
Corresponding author: Olaoluwa R. Popoola ([email protected])
This work was supported by the School of Engineering and Built Environment, Glasgow Caledonian University through a University sponsored research studentship.
ABSTRACT In this paper, we develop a low complexity indoor positioning system (IPS) and design a lightweight, low-cost, and wearable receiver for it. The accuracy of proximity-based LED IPS has been improved using overlap between LED beams but LED packets in the overlap region are subject to collisions. In this paper, we design collision handling algorithms for the IPS that considers building and lighting infrastructures. Mathematical analyses of the proposed algorithms are done and models for the probability of collisions are developed. The models, which are verified using simulations, are used to calculate the time required for position update called positioning time. Analysis of the positioning time is done for single and multiple receivers systems and validated with experimental measurements. Results show positioning error as low as 56 cm with a positioning time of about 300 ms for slotted unsynchronized systems and 500 ms for unslotted unsynchronized systems which makes the developed system pragmatic and appropriate for human positioning.
INDEX TERMS Collision reduction, indoor, light emitting diodes, localization, microcontroller, overlap, positioning, unsynchronized, wearable.
I. INTRODUCTION
Global navigation satellite system (GNSS) has witnessed tremendous success in positioning as it is currently easily integrable with various mobile phones, cars, and other sim-ilar devices. In these devices, the GNSS works by receiv-ing positional signals from four satellites. In an outdoor environment, these signals are readily available and provide satisfactory accuracy [1]–[3]. However, in indoor or enclosed environments, the positional signals suffer from attenuation by walls and scattering from indoor objects [4]. Conse-quently, the resulting positional signal received by the global positioning signal (GPS) chip is not good enough to provide accurate information indoors. The deficiency of positional signals in indoor environments led to ongoing research work both in the academia and industry to develop indoor posi-tioning systems (IPS). Literature survey shows that most techniques used in indoor positioning are based on inertial sensors, signal parameter variation or signal mapping [5]–[8]. Indoor positioning based on inertial sensors use accelerom-eters and gyroscopes to measure the acceleration and angular
velocity of the sensor. The changes in both quantities are used to derive the deviation in position as an object moves from one position to another. This approach works on the assumption that the start point is known and the movement profile measured by the inertial sensor is used to predict the endpoint or the position of an object. In order to know start points, inertial sensors based positioning is used with signal mapping or signal parameter variation [7].
Indoor positioning systems based on signal parameter vari-ation sets up a communicvari-ation link between one or more transmitters and one or more receivers. The indoor position is subsequently determined by the variation of one or more of the communication signal parameters. Communication signal parameter refers to any parameter of a communication signal which changes in value as the signal travels. Various communication signal parameters that have been investigated for indoor positioning purposes include the received signal strength (RSS) [8], the angle of arrival (AoA) [9], time of arrival (ToA), time difference of arrival (TDoA) [10], and phase difference of arrival (PDoA). The communication link
10754
2169-35362018 IEEE. Translations and content mining are permitted for academic research only.
can be based on radio frequency (RF), ultrasound [11], mag-netic sensors [12] or light [13], [14]. RF-based communica-tion links have been investigated for indoor posicommunica-tioning using Bluetooth protocols [15], RFID, Zigbee [16], WiFi and ultra wide band (UWB) [7]. Ultrasound technology sets up a com-munication link between a high-frequency sound transmitter and receiver while magnetic sensors use magnetic/inductive effects [11]. Light-based communication links or optical wireless communications (OWC) is made possible by the use of optical signals to set up a wireless link between an optical transmitter and receiver [17].
In signal mapping based IPS, signals from a reference point are broadcast and the received signal profile at dif-ferent points are mapped [5], [6]. This map serves as a fingerprint and this method is popularly known as position-ing by fposition-ingerprintposition-ing. In order to determine the location of an object or person, the signal profile is checked against the fingerprint and the location where there is the highest similarity is predicted as the estimate. A less complicated signal mapping method is proximity positioning. In proximity positioning, the content of the signal is used to infer positions directly [18].
Investigations on the applicability of light in positioning by signal variation in terms of RSS, ToA, AoA, TDoA and PDoA led to the development of various IPS which show appreciable levels of accuracy but the systems developed are either too expensive or inapplicable to practical scenar-ios [17]. Positioning by fingerprinting requires a pre-phase for capturing map features and fingerprinting based posi-tioning systems have to be redesigned when the environ-mental changes [19]. Unlike the aforementioned systems, proximity-based IPS are hardware friendly, inexpensive to implement and less dependent on environment changes. However, the accuracy of proximity-based IPS is poor since the error in positioning is proportional to the size of a room or the coverage area of the LED used called the LED footprint [18].
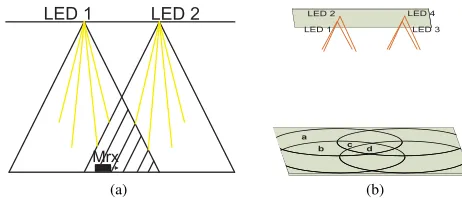
[image:2.576.296.527.74.173.2]To address the shortcoming of proximity-based IPS, a novel indoor positioning method called the multiple LED estimation model (MLEM) is introduced in [17]. MLEM uses overlaps of LED footprints to increase the accu-racy of positioning irrespective of the room size or the LED footprint. Fig. 1a shows an indoor location where overlap is used to increase the number of regions detectable by a mobile receiver (Mrx) from two to three. By increasing the number of LEDs, the accuracy of proximity-based position-ing is shown to increase significantly in [17] and [20]. Based on the simple proximity-based architecture, prototypes of MLEM IPS are portable, wearable and built using off-the-shelf components [17]. However, in regions of overlapping LED beams, LED data carrying packets are subject to col-lisions. When collisions occur, data packets are destroyed. Application of existing RF-based collision handling schemes such as code division multiple access (CDMA) to this OWC-based system requires specialized hardware and the resulting IPS are expensive, bulky and unwearable which
FIGURE 1. Various overlap conditions obtainable from the system under consideration. (a) Illustration of overlap region where LED data packets are subject to collision. (b) Example of different overlap regions.
defeats the purpose of proximity-based IPS. The Aloha pro-tocol which is a simple RF based collision handling propro-tocol is also not applicable because the ALOHA protocol works by the use of a received ’ACK’ acknowledgement packet by a transmitting system [21]. This differs from our system in two ways; first, the receiver photodetector (PD) system only receives optical signals and is not designed to transmit any optical signal. Secondly, the LED transmits optical signals in a simplex communication such that they only transmit and do not receive. Therefore there is a need to develop a positioning algorithm which handles collision in overlapping region of LED beams without trading off the advantages of MLEM as an improved proximity-based IPS.
This paper examines collision handling in MLEM-IPS by considering four lighting system designs which are synchro-nized system, semi-synchrosynchro-nized system, slotted unsynchro-nized system and unslotted unsynchrounsynchro-nized system. This is achieved by analysis confirmed with simulations and partly with experiments. Whereas the synchronized system is akin to time division multiplexing (TDM), this paper introduces novel collision handling schemes in semi-synchronized, slotted unsynchronized and unslotted unsynchronized OWC-based systems in regions of overlap. This is carried out by deriving the probability of collision for various numbers of overlaps in all four types of lighting system designs. The positioning time, defined as the time taken for the receiver to locate itself, is then computed using the models of probability of collision developed. The computed time is used as a per-formance metric to compare collision handling perper-formance of the four designs. To further improve the accuracy of positioning, the collision algorithm is extended to a MLEM multiple receiver IPS.
II. SYSTEM MODEL DESCRIPTION
The system sets up an optical link between a LED transmitter and a Mrx in an overlap region as illustrated in Fig. 1a. The Mrx is a PD with a small microcontroller attached to a person or an object whose position is to be determined. Fig. 1b shows the system environment which is an arbitrary indoor location of dimension 5m×5m×3m for four over-lapping circular light beams.
The Mrx determines its position based on the LED data received with line of sight (LOS) serving as the primary communication link for this investigation. The optical power received by the Mrx from a single LED without overlap,
Prx, is given in [22] and [23] as:
Prx =
Ptx
m+1
2πd2Acos
m(φ)T
s(ϕ)g(ϕ) cos(ϕ), 0≤ϕ≤ϕc
0, ϕ > ϕc
(1)
whereAis the physical area of the PD,dis the LOS distance between the transmitter and the receiver, φ is the angle of irradiance with respect to the transmitter perpendicular axis,
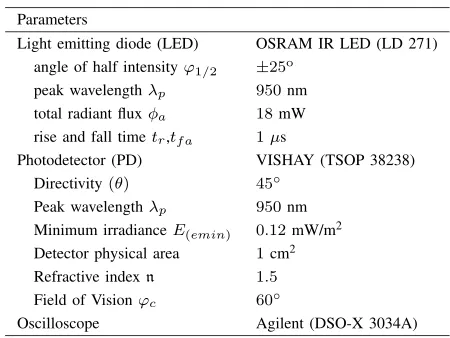
ϕ is the angle of incidence and Ptx is the optical power transmitted from a LED with parameters given in Table 1.
Ts(ϕ) is the gain of an optical filter,ϕcis the field of vision of the receiver,g(ϕ) is the gain of the optical concentrator given as a proportion of the refractive indexnas:
g(ϕ)=
n2
sin2ϕc
, 0≤ϕ ≤ϕc
0, ϕ > ϕc
(2)
mis the order of the Lambertian source and is:
m= ln(1/2)
ln(cos(81/2))
(3)
where81/2is the half angle.
[image:3.576.304.529.89.258.2]Based on the equations, the simulation parameters shown in Table 1 and assuming unity gain for the optical filter, the received optical power profile reveals four possible over-lap regions as illustrated in Fig. 1b. Therefore, the receiver in such scenario is subject to different possible overlap regions depending on the number of sources from which the optical power is detectable. In region a, based on the footprint of the LEDs, the Mrx receives data from only one source. The footprint of the LEDs defines the region on a horizontal plane where the optical power from a particular LED is detectable. If a receiver is in this region, a, the receiver assumes the coordinate of the LED which covers the region. In regionb, the receiver detects light from two sources and the receiver assumes the midpoint of the coordinates of both LEDs which covers that region. Light is detected from three sources in region cand four in region d and midpoints of the three and four LEDs are used to assume the position of the receiver. These regions are used in the various MLEM implementation designs described in SectionIII.
TABLE 1.Parameters of components and devices used for experiment and simulations in this work.
III. SINGLE RECEIVER MLEM IMPLEMENTATION DESIGNS
In this section, the different practical designs for the imple-mentation of an MLEM IPS are investigated. This section focusses on investigation with single receivers in order to establish the theoretical relationships for the packet duration multiplexing (PDM) collision avoidance algorithm. In the next section, these relationships are extended to multiple receiver MLEM systems which are used to further increase the accuracy of positioning. The structure for deployment of LED lights could assume three forms. First, LED lights could be set up with a timed controller such that a time division multiplexing (TDM) scheme is set up between the transmitters. This is considered as a synchronized system. A semi-synchronized system is considered second and finally, random access unsynchronized systems are considered.
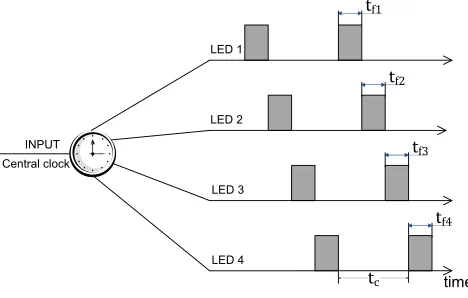
FIGURE 2. Central controller for the synchronized system.
each LED to transmit only one packet per allocated time, the receiver in a non-overlapping region requires the first packet from the LED in that region, and the second packet from the same LED. For instance, in regiona, since data from other LEDs are off in this region, the receiver would receive
LED1 data,blank,blank,blank,LED1 data where blank
represents no data received. In regionc, the receiver receives a sequence likeLED1data,LED2data,LED3 data,blank, LED1 datasince optical signals from LED 4 do not cover this region. This received data is subsequently used to predict position by the receiver.
The probability of collision in all regions (a,b,c,d) is 0 because the packets are separated in time. The positioning time is the sum of time for transmission of all packets in the system plus time of re-transmission of the first packet. Iftf is the time it takes a transmitter to send a data packet such that tfi is the time it takes the LED i transmitter to send its data packet, for the 4-LED system under consid-eration, if LED 1 sends its data first, the positioning time
tp4 = 2tf1+tf2+tf3+tf4. Consequently, the positioning time for this synchronized system forN LEDs,tpN is given by:
tpN =tf1+
N
X
i=1
tfi (4)
Although this system gives the lowest positioning time, it may be difficult to implement practically as it requires a redesign of existing building infrastructure and/or the rewiring of lighting facilities to include a central con-troller. The drawbacks of this system lead to a modified version called the semi-synchronized system described in SectionIII-B.
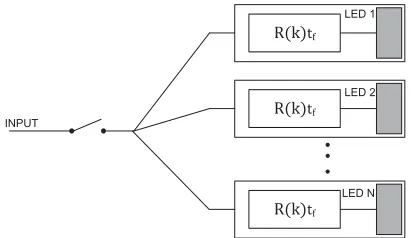
B. SEMI-SYNCHRONIZED SYSTEM
The semi-synchronized system is a more practical form of the synchronized system. In this system, the central con-troller used in the synchronized system is made abstract by transferring operations to software. This system operates with the assumption that all the lights in an enclosure are turned on or off by a single switch as is often the case in modern
FIGURE 3. Semi-synchronized system using gang switch.
lighting designs. Collision prevention between packets is achieved by including a delay between LED transmitters as illustrated in Fig.3.
In Fig.3,td represents a chosen delay time andtc repre-sents the cycle time which is also the time interval between transmissions of two successive packets from a single LED. The delays are used to implement an offset between data packets from one LED and that from another LED. The offset between the packet transmission times from a single LED also acts to prevent the collision by allocating enough time for other LEDs to transmit their packets. For simplicity in analysis and implementation, all LEDs are assumed to be of the same packet size such thattf is the same for all LEDs. Based on this assumption, for a system ofN LEDs, the min-imum cycle time required for the implementation of a semi-synchronized system is:
tc_min=Ntf. (5)
The minimum value of delay timetd_min to avoid repeated collisions istf. For this system, the probability of collision of data packets is 0 and the positioning time is the sum of the implemented delaytd and the cycle timetc. Therefore, the minimum positioning time in an enclosed area of N
LEDs is given by:
tpN_min=(N +1)tf. (6)
The semi-synchronized system offers a easier-to-implement version of the MLEM system with no possibility of col-lision. However, the assumption that every LED luminaire in an enclosed space is controlled by a single switch may not hold true for all lighting designs. In addition, the semi-synchronized system requires that a specified delay is pro-grammed into each LED luminaire. This could be achieved by adding delay label tags to LED transmitters. This approach, however, is not applicable to all practical cases. Conse-quently, cases for individual unsynchronized light switches are investigated in the next section.
C. UNSYNCHRONIZED SYSTEMS
[image:4.576.305.526.71.205.2]FIGURE 4. Slotted unsynchronized system with random delays.
non-synchronization in two possible forms. First is a slotted unsynchronized system which addresses the need for delay label tags to LED transmitters in the semi-synchronized sys-tem and next we consider an unslotted and unsynchronized design. The slotted unsynchronized system considers a sys-tem with a central switch but without any form of corre-lation between LED delays among transmitter LEDs while the unslotted unsynchronized system considers a system with non-central switch and no correlation between delays. To reduce collision in these systems, the LED data carrying packets are sent once in a cycle time. The cycle time is the sum of time taken for a LED to transmit its packet and the time the LED is required to stay off.
1) SLOTTED UNSYNCHRONIZED SYSTEM
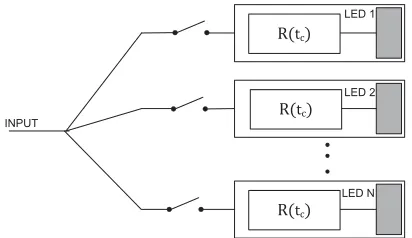
In this system, unsynchronized LEDs transmit data in slots chosen randomly. To put data in slots, all LEDs are assumed to be in the same room, identical and operate on a delay function which is dependent on a random value as illustrated in Fig. 4. The random value is generated by the integer function R(k) which randomly selects an integer between the set of numbers [1,2, . . . ,k] andk is dependent on the transmission duty cycleDgiven by:
D= tf
tf +toff
=tf
tc
=1
k (7)
where toff is the minimum time between two successive packet transmissions from the same LED. The values of tf andtoff are selected so that the fraction tf
+toff
[image:5.576.303.531.66.130.2]tf produces an integer valuekwhich represents the inverse of the duty cycle. The integer random functionRallows LED packets to be transmitted at randomly chosen slots as illustrated in Fig.5. Consequently, there is a probability of collision for the slotted unsynchronized system and the probability of colli-sion is dependent on how many LEDs are in a particular region. Therefore, unlike the systems in Section III-Aand SectionIII-B, this system has a different probability of colli-sion of packets for the Mrx in regiona, regionb, regioncor in region d. In region a, there is only one LED participating in data transmission, therefore, the probability of collision is 0. In region b, there are two LEDs participating in data transmission. If one of the LEDs, say LED 1, transmits at a
FIGURE 5. Illustration of slots and cycles for packet transmission.
duty cycleDsuch that its data packet is in one ofkpossible slots and LED 1 uses only one of the slots in a transmission cycle, then for no collision, the other LED say LED 2, has (k−1) possible slots for transmission as illustrated in Fig.5. If PncsN represents the probability of no collision of N slotted LEDs and PcsN represents the probability of collision ofN LEDs in a slotted unsysnchronized system, the probability of collision,PcsN is given as 1−PncsN. In the region b, the probability of no collision for two slotted LEDs is expressed as:
Pncs2=
k−1
k . (8)
Therefore, the probability of collision for packets in this region, or in any overlap region with only two LEDs is given as:
Pcs2= 1
k. (9)
For regioncwith three LEDs, givenk slots where the first LED transmits data in one of thek slots, to avoid collision, the second LED has to transmit its data in one of (k−1) slots and the third LED has (k−2) slots left for data transmission. The probability of no collision in this region is given by
Pncs3 = (k−1)(k2k−2). The probability of collision is therefore given as:
Pcs3=1−
(k−1)(k−2)
k2 . (10)
In an overlap region of four LEDs (region d), by similar argument, the probability of collision is given as:
Pcs4=1−
(k−1)(k−2)(k−3)
k3 . (11)
In general, the probability of collision in an overlap region withN LEDs transmitting data overkpossible slots is given as:
PcsN =1−
(k−1)!
kN−1(k−N)! =1−
N−1 Y
i=1
k−i
k (12)
and the probability of no collision is:
PncsN =
(k−1)!
kN−1(k−N)! =
N−1 Y
i=1
k−i
k . (13)
system can be written as:
PncsN = N−1
Y
i=1
tc−itf tc
(14)
and the probability of collision is:
PcsN =1− N−1
Y
i=1
tc−itf
tc .
(15)
Due to the non-zero probability of collision for this sys-tem, the positioning time depends on whether a collision occurs or not. Therefore, the average positioning time (APT) is computed as a metric for the positioning time. Conse-quently, the APTtpsgiven by:
tps=tpncsPncsN+tpcsPcsN (16)
is used for simulations wheretpncsis the APT without colli-sion andtpcsis the APT with collision. The positioning time when no collision occurs is the time taken to receive all pack-ets in the enclosed area. Since all packpack-ets are placed in slots for every transmission cycle, and detection is done by Mrx receiving one of the data packets twice, the second packet from any LED could be in any slot ranging from the first slot to thek-th slot in the second cycle. Consequentlytpncsranges betweenktf +tf and 2ktf. For this work, we assume the APT when no collision occurs as the mean of the two extremes. Thereforetpncscan be written as:
tpncs=
(3k+1)tf
2 =
3tc+tf
2 . (17)
When collision occurs, the positioning time is computed based on the number of transmission cycles that guarantees that packets from all LEDs in the region are received. If for a particular duty cycleD, the probability of collision occurring in a transmission cycle is given by PcsN, the probability that collision occurs in allnc-cycles is thereforePncsNc . The probability that collision does not occur in at least one of the cycles is given by 1−Pnc
csN. The required number of cycles that guaranteesssuccess rate for a no-collision cycle is therefore given by:
nc=
log(1−s) log(PcsN)
, 0<s<1. (18)
To guarantee a high success rate, sis taken to be 0.9999 which gives the number of cycles that ensures a 99.99% chance that a no-collision cycle occurs. Consequently, the positioning time when a collision occurs is given as
tpcs=nctpncs. By substituting the values oftpncs,PncsN,tpcs and,PcsN, the APT can be written as:
tps=
3t
c+tf 2
N−1 Y
i=1
tc−itf
tc
(1−nc)+nc
!
. (19)
[image:6.576.315.521.64.183.2]The slotted unsynchronized implementation of the MLEM system represents a more realistic technique because it eliminates the specific delays programmed to LEDs. There-fore any LED can be programmed independently. Unlike the
FIGURE 6. Structure for the unslotted unsynchronized system showing no form of coordination among LEDs.
previous systems, this system is subject to collisions. How-ever, by appropriately selecting the cycle timetc, the proba-bility of collision can be appreciably reduced as simulations in SectionVIshow.
2) UNSLOTTED UNSYNCHRONIZED SYSTEM
In this section, the investigation of the MLEM design for lighting solutions where each luminaire is controlled by a separate switch is considered. Separate controls for light sources make use of slotting difficult so systems with no cen-tral control are considered here as unslotted unsynchronized systems. By modifying (7), the transmission duty cycle of this system can be written as:
D= 1
ˆ
k (20)
wherekˆ is the inverse of duty cycle and not necessarily an integer. In this system, the lack of any form of central control means data is not transmitted in slots but can be sent at any random time. Fig.6shows the unslotted unsynchronized system whereR(tc) is used to place packets from different LED sources in different time intervals to avoid collisions. Considering Fig. 1b, in regiona, since only one LED trans-mits in that region like in the case for slotted synchronized systems, the probability of collision is zero. In the regionb, with two LEDs transmitting packets of the same size, over a low duty cycleD, according to [17], if one of the LEDs (say LED 1) transmits its data packet of durationtf at a particular point in the period of transmissiontc=tf+toff the other LED in this region (say LED 2) has atc−2tf interval to transmit its data. IfPncuN represents the probability of no collision of N unslotted LEDs and PcuN represents the probability of collision of N LEDs in an unslotted unsysnchronized system, the probability of no collision in this region is given byPncu2 =
tc−2tf
tc . By appropriate substitution from (20),
Pncu2can be written as:
Pncu2= ˆ
k−2 ˆ
k (21)
In a region of overlap between three LEDs, to avoid colli-sion, packets from all three LEDs and packets from any two LEDs must not be transmitted at the same time. For packets from all three LED, no collision occurs if data packet from LED 1 is at a point in the cycle that occupies an intervaltf, data packet from LED 2 can only be within any oftc−2tf points in the cycle and packets from LED 3 can only be within tc −3tf points in the cycle. The probability of no collision between packets from all three LEDs is therefore
Pall3 =
tc−2tf
tc
tc−3tf
tc . The probability of no collision between data packets from any two LEDs (say LED 1 and LED 2) is the probability of no collision when data packets from LED 1 and LED 2 are not in the same interval where the three LEDs collide. That is LED 2 data packet is in an intervaltc−2tf and LED 1 data packet is in an intervaltc−tf out of LED 2’s packettc−2tf interval. The probability of no collision among any two LEDs is given asPany2 =
tc−tf
tc−2tf
tc−2tf
tc . The prob-ability of no collision in this region is therefore given as
Pncu3=Pall3Pany2 =
tc−tf
tc
tc−2tf
tc
tc−3tf
tc simplifying according to (7), the probability of no collision in region of three LEDs can be written in terms ofkˆas:
Pncu3=
(kˆ−1)(kˆ−2)(kˆ−3) ˆ
k3 . (22)
By a similar analysis, the probability of no collision in regiond, is given by:
Pncu4=
(kˆ−1)(kˆ−2)2(kˆ−3)(kˆ−4) ˆ
k5
(23)
Generally, the probability of no collision for the unslotted unsynchronized system in N overlap region can be written as:
PncuN =
(kˆ−1)!(kˆ−2)! ˆ
k(2N−3)(kˆ−N−1)!(kˆ−N +1)! (24) and the probability of collision between packets is given by
PcuN =1−PncuN can be written as:
PcuN =1−
(kˆ−1)!(kˆ−2)! ˆ
k(2N−3)(kˆ−N−1)!(kˆ−N +1)!. (25) In terms of cycle time, the probability of no collision for the unslotted unsynchronized system inNoverlap region is:
PncuN =
tf2N−3(tc−tf)!(tc−2tf)! tc2N−3(tc−Ntf −tf)!(tc−Ntf +tf)!
(26)
and the probability of collision is given by:
PcuN =1−
tf2N−3(tc−tf)!(tc−2tf)! tc2N−3(tc−Ntf −tf)!(tc−Ntf +tf)!
. (27)
The APT for this system given as:
tpu=tpncuPncuN +tpcuPcuN (28)
[image:7.576.298.540.64.146.2]depends on the APT when no collision occurs, tpncu, and that when a collision occurstpcu. When no collision occurs,
FIGURE 7. Illustration of LED arrangements for investigating the APT of mobile single and multiple receivers.
the positioning time is similar to that of the slotted unsyn-chronized system since the detection method is similar. The positioning time when no collision occurs can be written by using (17) as tpncu = (3tc
+tf)
2 . When collision occurs, by a similar argument as in SectionIII-C.1, the positioning time can be written astpcu = logPc(1−s)tpncu = nctpncu. Substituting the values oftpcu,tpncu,PncuNandPcuNinto (28) gives the APT for the unslotted unsynchronized system as:
tpu= 3tc+tf
2 "
(1−nc)(tc−tf)!(tc−2tf)!tf2N−3 (tc−Ntf −tf)!(tc−Ntf +tf)!tc2N−3
+nc
#
.
(29)
D. APT FOR A MOBILE SINGLE RECEIVER
In SectionIII, stationary receivers in specific overlap regions are considered. However, a person wearing the receiver in the room, moves across various overlap region. The APT of the receiver in this scenario is computed in this section as the APT of a mobile single receiver. To simplify analysis, we use a transmitter orientation where the LED transmitters are assumed to be identical such that the radius of the optical foot-print from each LED is the same. In addition, the LED trans-mitters uniformly distributed and arranged in such a way that the center of each LED is on the circumference of another LED footprint. Using the room dimensions 5 m×5 m×3m from Section II, this setup for two, three and four LED transmitters is illustrated in Fig.7.
Considering a scenario for a two transmitter system, the APT is dependent on the positioning time at a no-overlap region and the positioning time at a two LED overlap region. This positioning time is based on the geometrical probability that a receiver is in a certain overlap region. By using the transmitter arrangements in Fig.7, iftmnrepresents the APT in an overlap region withmreceivers andntransmitters such thatm=1 for a single receiver and 1≤n≤N, whenN =2, the APT can be written as:
t12=tp11
A12
A2t
+tp12
A22
A2t
(30)
TABLE 2. Ratio of areas of various overlap regions to the total area covered byNLED transmitters.
overlapping LEDs in a system ofN transmitters andANt is the total area covered by the system withNtransmitters which can be expressed as:
ANt = N
X
n=1
AnN (31)
The values of these areas can be computed by considering the geometry of the overlap system. Considering the overlap system in Fig.7, the ratio of areas of overlap regions to the total area of a system is represented in Table2(see derivation in Appendix A).
For three transmitters the APT of a mobile single receiver is expressed as:
t13 =tp11
A13
A3t
+tp12
A23
A3t
+tp13
A33
A3t
(32)
wheret13is the APT of a system with one receiver and three transmitters,tpmn,AnN andANt are as earlier defined. As the number of transmitters increase, the expression of the APT for a mobile single receiver system withN transmitters can be written as:
t1N =tp11
A1N A3t
+tp12
A2N A3t
+. . .+tp1N AnN ANt
(33)
which is expressed in closed form as:
t1N = N
X
n=1
tp1n AnN ANt
(34)
IV. MULTIPLE RECEIVERS
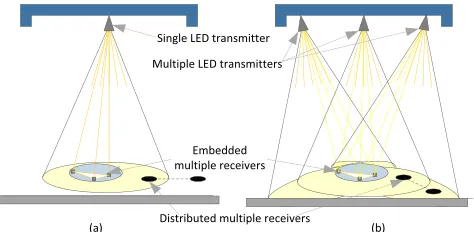
A multiple receiver based IPS uses more than one receiver in the localization of an object. The system can either be designed to receive data from a single LED transmit-ter or multiple LED transmittransmit-ters as illustrated in Fig. 8
[image:8.576.53.261.90.152.2][24]–[26]. The receivers can be embedded together on a single surface as presented in [24] and [26] or distributed over multiple surfaces [27]. Embedded multiple receiver IPS are usually used when the positioning is dependent on a signal parameter such as RSS, AoA or ToA. It involves the use of comparative signal properties. The use of multiple optical receivers with comparable angle of signal arrival or time of signal arrival has been used to improve the positioning accuracy of a LED-based IPS [24]. These methods add to the complexity of such positioning systems and make them less applicable to real life scenarios given practical constraints such as receiver size and power consumption. The embedded receivers have the advantage of maintained geometry such
FIGURE 8. Illustration of embedded and distributed multiple receivers for (a) single LED transmitter and (b) multiple LED transmitters.
that when there is a shift in the position of one of the receivers, all receivers are equally affected. This is necessary so as to ensure that the mathematical algorithms used for positioning do not break down. The drawback of this system is that a minimum separation in distance is required between the individual receivers and this means an increase in overall receiver size. This system is, therefore, unsuitable to wear and current designs are restricted to bench-tops.
In distributed multiple receivers, each receiver can assume any position, tilt or orientation independently of another. This flexibility in distributed multiple receivers design is because positioning is done by the received signal content as seen in proximity-based indoor positioning. Unlike embedded multi-ple receivers, distributed receivers give high flexibility of use in positioning and make the device wearable.
Multiple receivers have been proven to improve wire-less communication quality and data-rates by the use of the MIMO architecture [28]. In positioning, multiple receivers also increase positioning accuracy by receiving data from additional reference receiver (see SectionIV-A). The use of multiple receivers in proximity-based positioning systems, in addition to increasing accuracy, adopts a simple protocol and hardware architecture as described in [29]. This simple architecture transmits data in packets at low bit rates and long distances that are expected in indoor environments. In sub-sequent sections, we study the effect of distributed multiple receivers on positioning error and positioning time in non-overlapping and multiple non-overlapping regions as illustrated in Fig.8(a) and Fig.8(b) respectively.
A. MOTIVATION BEHIND HAVING AN ADDITIONAL RECEIVER
positions are identifiable. First is when both receivers are in the region of the first LED, second is when one receiver is in the region of only the first LED and the other receiver is in the region of the overlap between both LEDs, third is when both receivers are in the region of overlap between the two LEDs, fourth is when one receiver is in the region of overlap and the other is in the region of the second receiver only and the fifth position occurs when both receivers are in the region of the second LED. By increasing the number of identifiable regions from 3 to 5 by having an additional receiver, the two-receiver system reduces the positioning error. The simulation compares a single receiver in a two, three and four LED transmitter system with two receivers in the same system. Two Monte-Carlo simulations are carried out to illustrate the advantage of multiple receivers in terms of positioning error. First is a plot of minimum positioning error as the separation between LEDs is increased from 0 m to 1500 mm. If one of the receivers gets positioning data (x1,y1) from a LED at location (x1,y1) and the other receiver gets data (x2,y2) from a LED at location (x2,y2), then the estimated position of the receiver for thejth iteration (xj,yj) is computed usingxj = x1+2x2, andyj = y1+2y2. Given the original position of the receiver is (xr,yr), then for a beam radiusr, the positioning error is computed as
e(r)= 1
Ni Ni X
j=1 q
(xr −xj)2+(yr−yj)2 (35)
where the number of iterations for the simulation is
Ni = 100000. The error vector eis the vector ofe(r) for r=[1,2, . . . ,5000] mm. The minimum positioning errorem is given as:
em=min(e) (36)
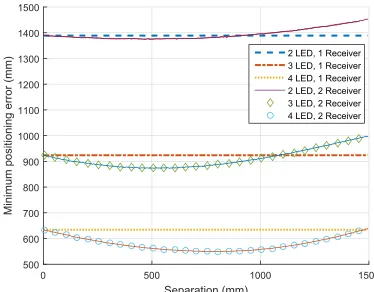
A plot of minimum positioning error as separation between the receivers is increased from 1 to 1500 mm is presented in Fig.9. Second, is the plot of positioning error using (35) and presented in Fig. 10 at a separation between the two receivers of 500 mm which is an approximate value of the human breadth [30]. The cumulative probability of position-ing errors is illustrated in Fig.11.
Based on Fig.9, Fig.10and Fig.11, the properties of a two receiver system can be written as follows:
a. At 0 separation between receivers, the two-receiver sys-tem behaves just like a single receiver syssys-tem.
b. The U-curves in both plots show that optimal values of separation and beam radius, which is the radius of the circular footprint formed by an LED on a horizontal plane, can be selected for reduction in positioning errors for a two-receiver system.
[image:9.576.322.509.64.210.2]c. At constant separation of 500 mm between the receivers, a two receiver system shows reduction of error in a two transmitter system by 1.1%, in three transmitter system the reduction is 5.5% and in a four transmitter system, it is 11.5%. Therefore, increasing the number of
[image:9.576.320.509.262.409.2]FIGURE 9. The effect of separation distance between receivers on positioning error in a two receiver positioning system using the setup in Fig.7.
FIGURE 10. Positioning improvement by use of two receivers for a system with 2, 3 and 4 LEDs as described in Fig.7.
FIGURE 11. Cumulative distribution function (CDF) showing the cumulative probability spread of positioning error for the setup described in Fig.7.
LED transmitters from 2 to 4 increases the reduction in positioning error for the two receiver system.
[image:9.576.322.506.455.601.2]Having demonstrated how multiple receivers reduce posi-tioning error, in the rest of this work, we quantify the effect of positioning time for the hardware-friendly PDM collision handling algorithm. By increasing the number of transmit-ters and receivers in order to improve positioning accuracy, the positioning time is estimated and actual results are pre-sented in SectionVI.
V. MULTIPLE RECEIVER POSITIONING TIME
Depending on the number of transmitters considered, a receiver can either be in a region of one LED light, a region of two, three, or four overlaps. To determine the positioning time of a multiple receiver system, given the positioning time of a receiver in any overlap region, the multiple receiver positioning time is equal to the positioning time of any of the receivers in the region of the highest number of overlap among other receivers. Considering a scenario of two trans-mitters and two receivers, if both receivers are in a region of one LED (with no overlap), the positioning time is the time when a single receiver is in this region. However, if one of the receivers is in a position of two overlaps, the positioning time is that of a single receiver in a region of two overlaps. To determine the positioning time for multiple receivers in this system two analytic processes are considered. First is the positioning time of a stationary multiple receiver system and then, the positioning time of a mobile multiple receiver system.
A. APT FOR STATIONARY MULTIPLE RECEIVER SYSTEM
The APT for a stationary multiple receiver system is depen-dent on the probability that a receiver in a N transmitter system is in either a one LED, two overlap, three overlap or up toN overlaps. To determine the APT, an expression for the probability that a receiver’s positioning time is defined byn
overlaps in aNtransmitter system is first developed and then this expression is used to compute the APT.
1) PROBABILITY THAT A RECEIVER’S POSITIONING TIME IS DEFINED BY SPECIFIC OVERLAP REGION
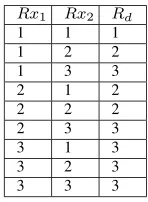
Considering a system with two transmitters and two receivers, any of these receivers can only be in either one LED or two LED overlap region. Table3lists the possible receiver posi-tions. In each scenario, the receiver Rd that determines the positioning time is the receiver in a region of the highest number of overlaps. To ensure all receivers can be in all region of overlaps, the maximum separation between two receivers is kept below 500 mm as presented in SectionIV-A. Table4
and Table5shows the values ofRdfor a two receiver system with three and four transmitters respectively.
[image:10.576.380.454.90.144.2]By the values of Rd is Table3, the probability that the APT is determined by the positioning time of receivers in one LED region is one out of four possibilities and the prob-ability that the APT is determined by the APT of receivers in the two overlap region is three out of four possibilities. IfPrN(n) is the probability that the APT in arreceiver system
[image:10.576.380.454.172.273.2]TABLE 3.Possible receiver location for 2 receiversRx1,Rx2and two transmitters.
TABLE 4.Possible receiver location for 2 receiversRx1,Rx2and three transmitters.
TABLE 5.Possible receiver location for 2 receiversRx1,Rx2and four transmitters.
withN transmitters is determined bynnumber of overlaps, from Table3, we can writeP22(1)=0.25 andP22(2)=0.75. For a three transmitter system, from Table4, we can write
P23(1) = 19,P23(2) = 39 andP23(3) = 59. From Table5, the probabilities that the APT is determined by 1,2,3 or 4 overlaps areP24(1) = 0.0625,P24(2) = 0.1875 ,P24(3) = 0.3125 andP24(4) =0.4375 respectively. By observing this series, a general expression for these probabilities can be written as:
P2N(n)= 2n−1
N2 (37)
Forrreceivers, the probabilityPrN(n) can be written as:
PrN(n)=
nr−(n−1)r
Nr (38)
(see proof in Appendix B)
2) APT EXPRESSION FOR STATIONARY MULTIPLE RECEIVER IPS
[image:10.576.380.456.301.471.2]expressions derived in SectionV-A.1. Considering a region of two transmitters and two receivers, the positioning time can either be determined by the positioning time in a region of two overlaps or the positioning time in a region of one LED. Therefore the APT for stationary multiple receiver can be written as:
ts22=tp11P22(1)+tp12P22(2). (39)
For a system with two receivers and three transmitters, the APT is written as:
ts23tp11P23(1)+tp12P23(2)+tp13P23(3) (40)
where tsrN is the APT for ar stationary multiple receiver system withN transmitters. A general expression for a two multiple receiver system withN transmitters could therefore be expressed as:
ts2N= N
X
n=1
P2N(n)tp1n (41)
Extending (41) tormultiple receivers, the APT can be written as:
tsrN = N
X
n=1
PrN(n)tp1n (42)
By substituting (38) into (42), the APTtsrN forrstationary multiple receivers in a system ofN overlapping transmitters can be written as:
tsrN = 1
Nr N
X
n=1
(nr−(n−1)r)tp1n (43)
B. APT FOR A MOBILE MULTIPLE RECEIVER SYSTEM Two probabilities that determine the APT for a mobile mul-tiple receiver system are the probability that the receiver is in a specific region of overlap and the probability that the positioning time is defined by a certain number of overlaps. The probability that the positioning time is defined by a certain number of overlaps is derived in Section V-A.1 of this work and the probabilities that a receiver is in a specific region is the ratio of the area of that region to the total area covered by the LED transmitters in the system. Considering the system in Fig.7, the areas covered by all possible number of overlap regions have been estimated in Table 2. Let the probability that a mobile multiple receiver system is in a region ofnoverlaps in a system ofNLED transmittersPaN(n) be expressed asAnN
ANt. Considering a two LED overlap system with two receivers, if the probability that the receivers are in a region of one LED is represented asPa2(1) and the probability that the receivers are in a region of two LED overlap isPa2(2). From the values of AnN
ANt in Section III-D, Pa2(1) =
A12
A2t,
Pa2(2) = AA222t. The probability that the positioning time is defined by a region of one LED is defined in SectionV-A.1
as P22(1) and P22(2) is the probability that the positioning time of a region is defined by two LEDs.
For this system, both receivers can either be in a region of one LED only and the positioning time is based on the time in this region or any of the receivers are in a region of two LED overlap and the positioning time is based on the two overlap region. It is not possible that both receivers are in a one LED only and the positioning time is determined by the two overlap region neither is it possible that any or both of the receivers are in a region of two LED overlap and the positioning time is determined by the one LED only region. Consequently, the probability that both receivers are in a region of one LED can be written as Pa2(1)P22(1)
Pa2(1)P22(1)+Pa2(2)P22(2) and the probability that the receiver is in a two LED overlap region isPa2(1)PP22(1)+a2(2)PP22(2)a2(2)P22(2). The APT for a mobile multi-ple receiver system in a two receiver, two transmitter system
tm22can, therefore, be written as:
tm22=
Pa2(1)P22(1)
Pa2(1)P22(1)+Pa2(2)P22(2)
tp11
+ Pa2(2)P22(2)
Pa2(1)P22(1)+Pa2(2)P22(2)
tp12. (44)
For two receivers and three transmitters, by a similar argu-ment, the APT can be written as:
tm23=
Pa3(1)P23(1)tp11+Pa3(2)P23(2)tp12
Pa3(1)P23(1)+Pa3(2)P23(2)+Pa3(3)P23(3)
+ Pa3(3)P23(3)tp13
Pa3(1)P23(1)+Pa3(2)P23(2)+Pa3(3)P23(3). (45)
In general, forN transmitters andrreceivers, the APT for a mobile multiple receiver system can be written as:
tmrN =
PN
n=1PaN(n)PrN(n)tp1n
PN
i=1PaN(i)PrN(i)
(46)
VI. RESULTS AND DISCUSSIONS
In this section, results for the probability of collision are verified by simulations and the results for the positioning times for the different designs are presented.
A. PROBABILITY OF COLLISION
The communication toolbox in the MATLABr software package is used to present the probability of collision 2, 3 and 4 overlap regions. The simulated probability of collision, calculated as the ratio of collided packets to the total number of packets sent, is presented for varying cycle timetcbetween 0 and 400 ms. The process is repeated for all scenarios con-sidered in SectionIIIof this work. For the synchronized and the semi-synchronized systems, the probability of collision is always zero and therefore not shown.
FIGURE 12. Simulation and mathematical model of probability of collisionPcsNin (12) forN=2,N=3 andN=4 overlap slotted unsynchronized system representing regionb,candd of Fig. 1b vs cycle timetc.
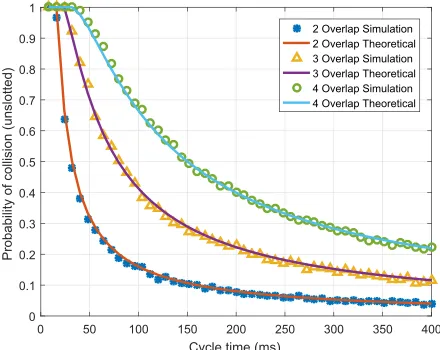
FIGURE 13. Simulation and mathematical model of probability of collisionPcuNin (24) forN=2,N=3 andN=4 overlap unslotted unsynchronized model representing regionb,candd
of Fig. 1b vs cycle timetc.
collision for a particular cycle time increases with increase in the number of LEDs in the overlap region. The rate of decrease of the probability of collision as the cycle time increases is also faster for lower number of LEDs in a region. The unslotted unsynchronized system simulation results are presented in Fig. 13 for region b, region c, and region d. Suffice it to say no overlap occurs at region a
so it is not considered here. Fig. 13 shows that unslotted unsynchronized systems generally have similar decay curve to that of the slotted unsynchronized system and in addition, like the slotted system, the probability of collision decrease with increase in the cycle time.
[image:12.576.303.531.63.240.2]The unslotted system, however, shows a probability of collision that approximately doubles the value in a slotted unsynchronized system if all other parameters are equal. For both systems (slotted unsynchronized and unslotted
FIGURE 14. Average position time variation with cycle timetcfor slotted unsynchronized system (sus)tpsfrom (19) compared with the
synchronized system (ss)tpNfor 2, 3, and 4 overlaps.
unsynchronized), the minimum value for the cycle time is the product of the packet time and number of LED transmitters considered. If this value is not greater than the number of LEDs in the region, Fig.13 shows that the probability of collision is maintained at 1. This implies there will not be any successful data transmission and therefore no positioning.
B. POSITIONING TIME
In this section, the APTs for the systems considered in this work are simulated and the results are presented. For con-sistency, the APT is plotted against the cycle time for all the designs considered in this paper. The positioning times for both the synchronized system and the semi-synchronized system, represented by (4) and (6), are equal for equal packet sizes. The positioning times for these systems are also inde-pendent of the cycle time as they only depend on the number of LEDs in the region and the packet time.
Since packet time is dependent on the protocol used for transmission, to observe general patterns, packet time is assumed to be 8 ms in this paper. The APT plot for the slotted unsynchronized system with varying number of overlaps is shown in Fig.14. The curves in Fig.14show a fast fall in positioning time then a slow rise as cycle time increases. The curves imply that at low cycle times, the APT is high due to packets lost in collision as the probability of collision is high in the low cycle time interval. At high cycle time, the APT is high due primarily to slow rate of arrival of packets. Between the two extremes are points of reduced and optimal APT. Based on Fig.14, the system can be designed to operate at an APT of approximately 650 ms with as much as four LEDs in the overlap region.
[image:12.576.46.266.306.481.2]FIGURE 15. Average position time variation with cycle timetcfor unslotted unsynchronized system (uus)tpufrom (29) compared with the synchronized system (ss)tpNfor 2, 3, and 4 overlaps and experimental (exp) 2 overlap system.
1300 ms in a region of 4 overlaps. For practical applications, if positioning is required every second, Fig. 14shows that cycle time could be kept between 70 and about 400 ms for the slotted unsynchronized system and from Fig.15, the cycle time could be kept between 120 and about 400 ms for the unslotted unsynchronized system APT to be kept below 2 s. These ranges show that positioning can be received every two seconds and therefore the IPS can be used to monitor stationary objects. This wide range of cycle time for satis-factory positioning also allows for flexibility in design and also the incorporation of effects such as light dimming while positioning.
1) EXPERIMENTAL VALIDATION
In order to validate the APT, the unslotted unsynchronized system using 2 LED transmitters and one receiver is imple-mented in hardware using ATMEG 328 microcontrollers. The experimental setup consists of a PC that is used to program the microcontroller for each transmitter at increasing cycle times as shown in Fig.16. Both transmitters and the receiver are powered from the power supply unit through the electronic unit which consists of the ATMEG 328 microcontrollers and a transistor-based driver circuitry. The packets transmitted from the LEDs arrive at the receiver and are decoded by the receiver microcontroller. The time taken to receive two correctly decoded packets from both transmitters is measured as the positioning time. This is repeated five times and the APT is computed as the average of the five values. This APT is plotted as the two overlap unslotted unsynchronized system experiment in Fig.15.
[image:13.576.299.536.66.228.2]The curves in Fig.15show the experimental results have the same pattern as the analytical APT for 2 overlap unslotted unsynchronized system. However, the experimental system has lower APT for cycle time values greater than 70 ms. This is because the analytical results guarantees a 99.99% success
FIGURE 16. Experimental setup. A: transmitter 1, B: transmitter 1 electronic unit, C: transmitter 2 electronic unit, D: transmitter 2, E: power supply unit, F: digital oscilloscope, G: receiver, H: receiver electronic unit, I: PC showing monitor for programming and serial port monitoring, J: Inset of wearable receiver prototype.
rate so this represents a worst case timing scenario when the probability of collision is low. A match between experimental measurements and the analytical system is observed at a cycle time of 70 ms and the curve shows that as the cycle time increases towards 400 ms, the deviation between the experimental results and the simulation result reduces. Based on the experimental results, the unslotted unsynchronized system for two LEDs gives an APT of 100 ms when the cycle time is selected to be 80 ms.
C. MOBILE SINGLE RECEIVER SYSTEM
Here the analytical results of the positioning times for a moving receiver are presented for a synchronized system, unsynchronized system, slotted unsynchronized system, and unslotted unsynchronized system. The APT is derived by increasing cycle time from (19) and (29) and by substituting the values of other variables in (34).
FIGURE 17. Average position timet1Nin (34) vs cycle timetcfor a mobile single receiver where ss:synchronized system, sss:semi-synchronized system, sus:slotted unsss:semi-synchronized system and uus:unslotted unsynchronized system.
FIGURE 18. Average position timetsrNin (43) vs cycle timetcfor stationary multiple receivers in slotted unsynchronized multiple transmitter overlap region wheretsrNrepresents the APT forrreceivers andNtransmitters.
D. STATIONARY MULTIPLE RECEIVER SYSTEM
In this section, the results of performance of stationary mul-tiple receiver systems are presented. Slotted synchronized system and unslotted synchronized systems are considered and presented in Fig.18and Fig.19respectively.
[image:14.576.36.276.311.498.2]For a slotted unsynchronized system, Fig.18shows that the APT is influenced more by the number of transmitters than the number of receivers. For two transmitters, as the number of receivers are increased, the APT increases by about 10 ms. However, for two receivers the APT increases by about 100 ms for 100 ms cycle time as the number of transmitters are increased from 2 to 4. As the cycle time increases, the effect of an increase in transmitters or receiver reduces. This is seen as the lines of the curves converge as cycle time approaches 400 ms.
FIGURE 19. Average position timetsrNin (43) vs cycle timetcfor stationary multiple receivers in unslotted unsynchronized multiple transmitter overlap region wheretsrNrepresents the APT forrreceivers andNtransmitters.ts22e: Experimental result.
The APT plots for unslotted unsynchronized systems pre-sented in Fig.19also show that the number of transmitters is the major determinant of the APT in similar manner to the slotted synchronized system. The APT curves fall then rises and the range of cycle time between a fall and a rise is seen to increase as the number of transmitters increases. Therefore, the range of minimum cycle times for two trans-mitters is smallest, and the range is larger for four transtrans-mitters and increases as the number of transmitters increase. The minimum APT for a two transmitter system is about 200 ms and this occurs at a cycle time between 50 and 75 ms. For a three transmitter system, it is about 500 ms and this occurs at a cycle time about the range 125 - 175 ms. The minimum APT for the four transmitter system is about 900 ms and this occurs at a cycle time within the range 150 and 375 ms.
Experiments to test the performance of a two-receiver sys-tem using the same setup as described in SectionVI-B.1with the single receiver changed to a multiple receiver system with two receivers. The APT measured with the device is presented in Fig.19. Unlike the single receiver system, the APT for the two receiver system shows error bars which indicate the aver-age of the plots at each point, the maximum and the minimum APT. This is because the flexibility of the two receiver system allows positioning when data is received from one receiver and packet collision occurs at the other receiver. In this case, the system behaves as if the receiver where collision occurs is blocked from light thereby giving a position in a short time. However, in experimental measurements, it is ensured that the average of correct APTs when both receivers received packets successfully are measured and this is plotted in Fig.19. E. MOBILE MULTIPLE RECEIVER SYSTEM
FIGURE 20. Average position timetmrNin (46) vs cycle timetcfor mobile multiple receivers in slotted unsynchronized multiple transmitter overlap region wheretmrNrepresents the APT forrreceivers andNtransmitters.
FIGURE 21. Average position timetmrNin (46) vs cycle timetcfor multiple receivers in unslotted unsynchronized multiple transmitter overlap region wheretmrNrepresents the APT forrreceivers and
Ntransmitters.
unsynchronized and unslotted unsynchronized systems is presented in Fig.20and Fig.21respectively.
When a multiple receiver system is static, the APT for up to four transmitters is about 1 s as seen in Fig.18and Fig.19. However, when a person is moving around across different overlap regions in a room, the APT, shown in Fig. 20and Fig. 21 for slotted and unslotted unsynchronized systems, is observed to stay below a second when the cycle time is between 150 and 350 ms. For two receivers, the positioning time is about 300 ms for the slotted system and 550 ms for unslotted system.
VII. CONCLUSIONS AND FUTURE WORK
In this paper, we discuss, design and analyse practical installation techniques that could be used to implement the
MLEM-based IPS design using inexpensive off-the-shelf hardware. Three practical designs for the implementation of MLEM indoor positioning system are considered. The designs include a synchronized system, a semi-synchronized system and unsynchronized systems. The synchronized sys-tem has the best performance in terms of positioning time but it requires a redesign of existing lighting facilities. The semi-synchronized system with similar positioning time as the syn-chronized system offers a more practical implementation but requires each LED to be tagged with a specific delay. To avoid these complexities, we designed PDM collision-handling algorithms that allow for use of unsynchronized LEDs in positioning. The unsynchronized systems spread packets in a low duty cycle and collisions are reduced by increasing cycle time. The unsynchronized systems are designed to be simple as they do not require any coordination. The probabilities of collision for the unsynchronized system are computed ana-lytically and the developed analytical expressions are verified by extensive Monte-Carlo simulations. This paper also shows that the accuracy of the MLEM system is improved by the use of multiple receivers. The IPS gives a sub-meter positioning error in a standard room of dimension 5 m×5 m×3 m.
The performances of the systems are evaluated by com-puting the positioning time. Based on the simple hardware implementation approach used, the positioning time increases for an increase in the number of transmitters and receivers. The results show that careful selection of the cycle time is necessary to keep the positioning time low. For slotted unsynchronized systems, the APT is below half a second and for unslotted unsynchronized systems, it is below 1 s. The analytical results of the positioning time for two transmit-ter and single and two receivers systems are validated by experimental measurement of built prototypes. In terms of performance, for a mobile receiver, all systems are shown to have APTs that are below a second which is good for human positioning. Multiple receiver designs not only increases positioning accuracy but also improves the robustness of the MLEM IPS because if one of the receivers is blocked or does not receive a LOS signal, positioning can be achieved from the other receivers.
Conclusively, this paper introduced novel unsynchronized designs for collision handling in proximity-based positioning. Analytical results are developed which match simulations and experiment. The prototype of the design is inexpensive, lightweight, wearable and not totally dependent on line of sight. Future work will study the robustness of the designed IPS in terms of tilted receivers.
APPENDIX A
DERIVATION OF RATIOS OF AREAS OF OVERLAPS IN PRESENTED IN TABLE 2
Here we show how to derive the ratios of areas of various overlap regions. For two overlapping circles with equal radii, by circle geometry, the area of overlapA22is known to be:
A22=2r2cos−1
d
2r − d
2 p
FIGURE 22. Illustration of overlap between 3 circles used to determine the overlap areas.
wheredis the distance between the centers of the two circles andris the radius of any of the circles. The total area of the overlapped circles isA2t =2πr2−A22and the area of non-overlapping regionsA12 = A2t−A22. Although no generic formulae exists for calculating all areas of overlapping region for more than two overlapping circles, calculating these areas follow basic rules of circle geometry. For three overlapping circles as shown in Fig.22, the area ofaABC is calculated from the known sides. The area of the three overlap regionA33 is calculated as the sum of the area ofaABC and 3×(Area of sector ABEC−aABC). Area of two overlap onlyA23can be calculated as 3×area of ABCD -A33where area of ABCD is the area of two overlapping circles as given in (A.47). The area of only one circle can be calculated as the area of ABCD +A23/3 subtracted from the area of each circle. The same argument is used to estimate area of overlapping regions for four circles and the results presented in Table2.
APPENDIX B
PROOF FOR PROBABILITY THAT A RECEIVER’S POSITIONING TIME IS DEFINED BY
A SPECIFIC OVERLAP REGION
In this appendix, we present proofs for the probability that a receiver’s positioning time is defined by a specific overlap region as described in (37) and (38). To prove these equa-tions, we use multidimensional mathematical induction (MI). Since (38) is therth term of (37), two-dimensional MI is used to prove (37), then by multidimensional MI, (37) this is used as a base case of a sequence to give proof of (38).
Proposition for (37):The probabilities that a 2-receiver is in an area ofnoverlap in aN number of transmitter system given by Table6can be represented as:
P2N(n)=
n2−(n−1)2
N2 =
2n−1
N2 , 1≤n≤N. (B.48)
TABLE 6.Probability that a 2-receiver inNtransmitter system is inm
number of overlaps region.
Proof:Base case:P22(1)=14. Induction overN: assum-ingP2k(1) is true. From (B.48),P2k(1) = k12. Ifk = k+1 this becomes P2(k+1)(1) = (k+1)1 2. By direct evaluation of
P2(k+1)(1) whereN =k+1 from (B.48), we getP2(k+1)(1)= 1
(k+1)2. Thus the induction over N for the proposition is true. Induction overn: assuming the proposition holds true forP2q(k) whereqis any positive integer representingN as validated by the induction overN. From (B.48),P2q(k) = k2−(k−1)2
q2 =
k2−(k2−2k+1)
q2 = 2k−1
q2 . Ifk=k+1 this becomes
P2q(k) = 2kq+12 . By direct evaluation of P2q(k +1) from (B.48), we getP2q(k +1) = (k+1)
2−k2
q2 = 2k+1
q2 . Thus the induction overnfor the proposition is also true. By verifying in both dimensionsNandnthat (B.48) is true for a base case and also true atk+1, then, for any positive integerk, (37) is proven true.
Proposition for (38):The probabilities that a r-receivers are in an area ofn overlap in a N number of transmitters system can be represented as:
PrN(n)=
nr −(n−1)r
Nr , 1≤n≤N. (B.49)
Proof: Base case: P22(1) = 14. Considering the series
P2N(n),P3N(n),P4N(n),. . . ,PrN(n), since the induction over Nandnhas been proven true, for induction overr, assuming
Pkn(n) is true. From (B.48),Pkn(n)=n
k−(n−1)k
nk =1−(
n−1
n ) k.
Ifk = k+1, this becomesP(k+1)n(n) = 1−(n−1n )k+1 = 1−(n−1n )(n−1n )k. By direct substitution ofk+1 forkin (B.49), ifn = N,P(k+1)n(n) = n
k+1−(n−1)k+1
nk+1 = 1−(
n−1
n )( n−1
n ) k.
Thus verifying the induction overr.
Remark:By the use of multidimensional MI, the proba-bility equations that arnumber of multiple receivers in aN
transmitter system is in a region ofnnumber of overlaps is verified to be true.
REFERENCES
[1] R. B. Thompson, ‘‘Global positioning system: The mathematics of GPS receivers,’’Math. Mag., vol. 71, no. 4, pp. 260–269, 1998.
[2] S. Ingram, D. Harmer, and M. Quinlan, ‘‘Ultrawideband indoor positioning systems and their use in emergencies,’’ inProc. IEEE Position Location Navigat. Symp. (PLANS), Apr. 2004, pp. 706–715.
[3] S.-H. Jung, G. Lee, and D. Han, ‘‘Methods and tools to construct a global indoor positioning system,’’IEEE Trans. Syst., Man, Cybern., Syst., to be published.
[4] M. B. Kjærgaard, H. Blunck, T. Godsk, T. Toftkjær, D. L. Christensen, and K. Grønbæk, ‘‘Indoor positioning using GPS revisited,’’ inProc. Int. Conf. Pervasive Comput., 2010, pp. 38–56.
[image:16.576.313.524.87.144.2]