Rochester Institute of Technology
RIT Scholar Works
Theses
Thesis/Dissertation Collections
11-1-1993
Using measured photography to obtain optimal
results from CCD Color Scanners
David L. Milburn
Follow this and additional works at:
http://scholarworks.rit.edu/theses
This Thesis is brought to you for free and open access by the Thesis/Dissertation Collections at RIT Scholar Works. It has been accepted for inclusion
in Theses by an authorized administrator of RIT Scholar Works. For more information, please contact
ritscholarworks@rit.edu.
Recommended Citation
from
CCD Color Scanners
by
David L. Milburn
A
thesis submittedin
partialfulfillment
oftherequirements
for
thedegree
ofMaster
ofScience
in
theSchool
ofPrinting
Management
andSciences
in
theCollege
ofImaging
Arts
andScience
oftheRochester
Institute
ofTechnology
November 1993
Rochester Institute of Technology
Rochester, New York
Certificate ofApproval
Master's Thesis
This is to certify that the Master's Thesis of
David
L.
Milburn
With a major in Graphic Arts Publishing
has been approved by the thesis committee as satisfactory
for the thesis requirement for the Master of Science degree
at the convocation of
November 1993
Thesis Committee:
Joseph
L.
Noga
Thesis Advisor
Marie Freckleton
Graduate Program Coordinator
each time a request for reproduction is made. I can be reached at the following address:
Z /
2>/.1
;-}~
#!)
-r-C/?1
.4"'c. .
--;e,
J
«-r~
dY
/46 /
<;
~ ;t
Heartfelt
appreciation goes tomy
wife,
Marianne,
anddaughters,
Sarah
andKate,
withoutwhose
patience, understanding,
and supportthis project would nothave
come tofruition.
Thanks
are alsodue
toProfessor Frank Romano
for
Quark
tips and presentationadvice,
John Compton
for
help
with thejudging
procedure,
David Cohen
for
technical consultation,
Rick Foster
for
finding
the crucialliterary
reference,
Eric Neumann
for
assistancein
theColor
Imaging
Lab,
andProfessor Marie Freckleton
for
proofreading.I
am also gratefultoProfessor Joseph
Noga,
my
advisor,
for his
suggestionto consider amulti-disciplinary,
measuredphotography
andprinting
project.He
wasinstrumental in
establishing
theinitial
direction
ofthe thesis and,thereafter,
leading
meback
tothe premisewhen
I
strayedtoofar
afield.If
notfor his
help,
this endeavorwouldlack
theclarity
ofpur posewhichis
evidentthroughout.List
of Tables
viList ofFigures
viiAbstract
viiiChapter
1: Introduction
Statement
oftheProblem
1-01
Endnotes
1-04
Chapter
2: Background
&
Theory
The Roots
ofMeasured
Photography
2-01
Reasons
for
Interest in
theStudy
2-02
A Brief
History
ofElectronic Color Separation
2-03
Photomultiplier
Tubes
2-06
Charge-Coupled Devices
2-06
Background
onthePixelcraft
CIS 4520RS
2-07
Background
ontheAgfa
Horizon
2-08
Endnotes
2-11
Chapter 3: Hypotheses
Endnotes
3-03
Methodology
Production
oftesttransparencies
4-0
1
Scanning
withtheDainippon Screen SG-608
4-05
Scanning
withthePixelcraft CIS
4520RS
4-13
Scanning
withtheAgfa Horizon
4-23
Integration
ofCMYK TIFF Files
4-30
Production
ofFuji
Color
Art
Proofs
4-30
Judging
ofHalftone Proofs
4-32
Densitometric Measurement
4-35
Endnotes
4-37
Chapter
5:
Analysis of
Results
Densitometric Measurements
5-01
Evaluation
ofJudging
Results
5-08
Chapter 6: Conclusions
&
Recommendations
Conclusions
6-01
Recommendations
for
Further
Study
6-03
Bibliography
7-01
Appendix A Halftone Proofs
for
the
Screen SG-608
A-l
Appendix B Halftone Proofs
for
the
Agfa Horizon
B-l
Appendix C Halftone Proofs
for
the
Pixelcraft
CIS
4520RS
C-l
Appendix
D
Listing
of
Equipment
D-l
Appendix E
Listing
ofSoftware
E-l
Appendix F
Judging
Data
Sheets
F-l
Chapter
4:
Methodology
Table
4-1:
Reflection
brightness
valuesin
theoriginal stilllife
scene4-04
Table
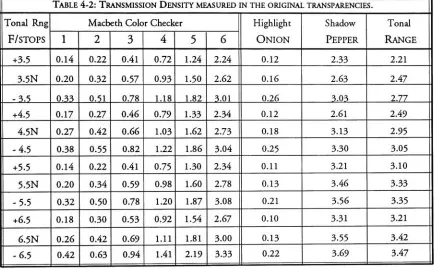
4-2:
Transmission
density
measuredin
theoriginaltransparencies4-07
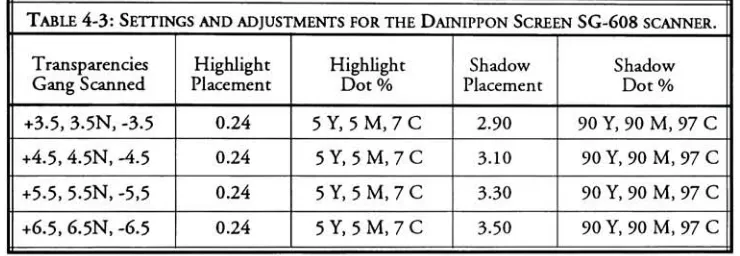
Table 4-3: Settings
and adjustmentsfor
theDainippon Screen
SG-608
scanner4-10
Chapter 5: Analysis of Results
Table 5-1: Densitometric
measurementsfor
thenormalexposure5-01
Table 5-2: Densitometric
measurementscomparing
exposurelatitude
5-03
Table
5-3: Comparison
ofdensity
rangedifferences between four
tonal ranges5-04
Table
5-4:
Tallied
resultsfrom
theJudging
Data
Sheets,
Part
1
5-09
Table
5-5:
Tallied
resultsfrom
theJudging
Data
Sheets,
Part 2
5-11
Chapter
4:
Methodology
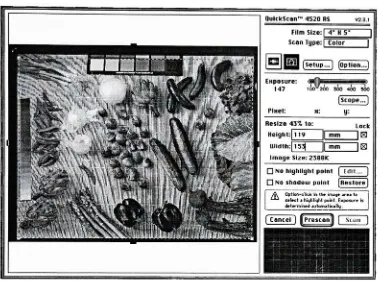
Figure
4-1: Color Access Quickscan
dialog
box for
theCIS
4520RS
scanner4-14
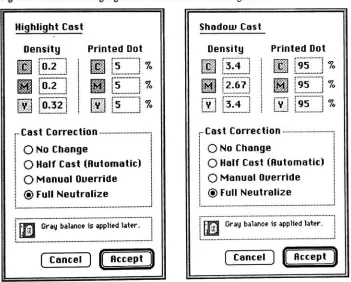
Figure
4-2: Color Access
Highlight
Cast
andShadow Cast
dialog
boxes
4-15
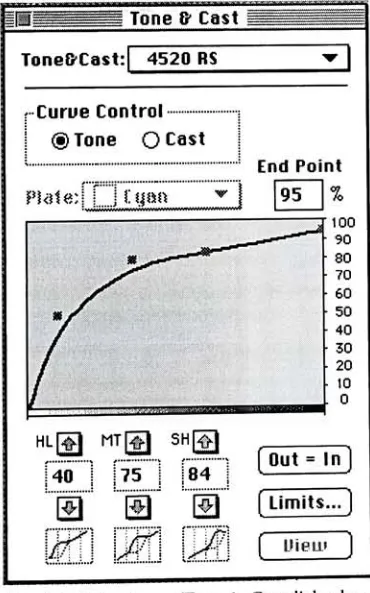
Figure
4-3: Color Access Tone
&
Cast
dialog
box
4-17
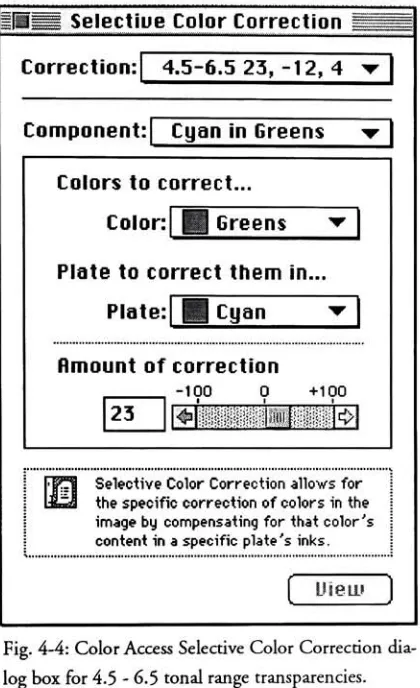
Figure
4-4: Color Access Selective Color
Correction
dialog
box
4-19
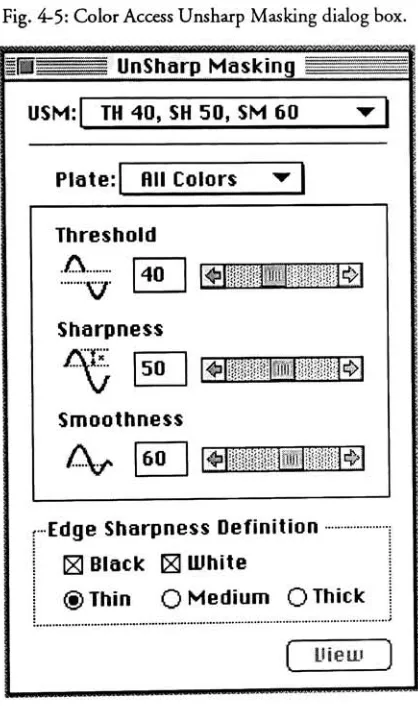
Figure
4-5: Color Access
Unsharp Masking
dialog
box
4-20
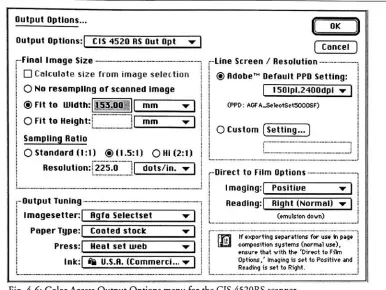
Figure
4-6:
Color
Access Output
Options
menufor
theCIS
4520RS
scanner4-22
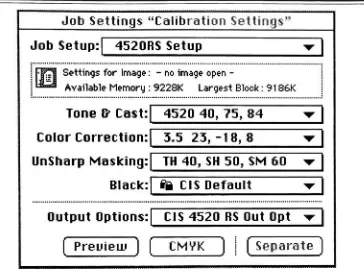
Figure
4-7:
Color Access Job
Settings
menufor
theCIS
4520RS
scanner4-23
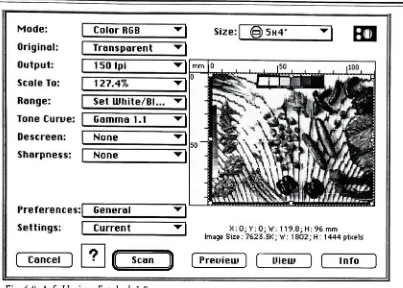
Figure
4-8:
Agfa Horizon Fotolook 1.0
scan menu4-25
Figure
4-9:
Agfa Horizon
Choose
"White Point
dialog
box
4-26
Figure
4-10:
Agfa Horizon
Choose
Black Point
dialog
box
4-27
With
the advent ofdesktop
color scannersin
the electronic prepress production environment,
quality in
colorseparationsfrom
transmissiveoriginalshas
become
erratic.The
causeofthis
fluctuation is,
in
part,
due
to the transitionfrom
PMT
toCCD-based scanning
technology.
Whereas,
PMT
scanners tend tohave
abroad dynamic
range,
thatofCCD
scannersis
morelimited.
This
characteristicadversely
affects thequality
of color separationsby
causing
additionaltone compression.An
originaltransparency typically has
a shadowdensity
of3.00
and adiffused
highlight
density
of0.30
for
an overalldensity
rangeof2.70.
On
afour-color heatset
web press withcoated
stock,
themaximum reproducible tonal range correspondsto adensity
of1.80.
The
difference
in
density
of0.90
between
theoriginalandthepress sheetis
unabletofit
throughthe
printing
window unlessit
undergoes considerabletonecompression.This
projectwasbased
on twohypotheses.
The
first
was that thelower
the tonal rangeof a transmissive original the more
readily
lower-midtone-to-shadow
tonality
couldbe
retained
in
the separations producedby
aCCD
scanner and related equipment.The
secondwasthat exposure
latitude
in
theseparations woulddecrease
withincreasing
tonalrange.The
first
stage of production was toproduce twelve test transparenciesby
photographing
a stilllife
settofour
tonal ranges:3.5,
4.5,
5.5,
and6.5 f/stops.
Within
eachrange,
threeimages
were selected to represent normalexposure,
1/2
f/stop
overexposure,
and1/2
f/stop
underexposure.
Comparison
ofhalftone
proofs,
madefrom
separations ofthenormally-exposed
transparencies,
werelater
usedfor
thefirst hypothesis.
Proofs
from
the1/2
f/stop
over- and1/2
f/stop
underexposures were compared with the normal exposures to test thesecond
hypothesis.
produce a set of
best-of-kind
reference separations andhalftone
proofs.Next,
the transparencies were scanned on two midrange
12-bit
CCD
scanners,
one aPixelcraft
CIS
4520RS,
theother anAgfa Horizon. Separations for both
wereproducedwithColor Access
1.3.3
software on aMacintosh Quadra
700
computer,
linked
to anAgfa
SelectSet
5000
imagesetter
viaanAgfa
5000PS Star Plus RIP. The image
files
were placedin
an8
1/2"
X
11"
QuarkXPress
pagewitha20% gray
surroundpriorto output.Halftone
proofs were produced with theFuji Color Art
proofing
system,
then viewedunder
5000 Kelvin
lighting.
Three
methodswere usedfor
comparison: visual evaluationby
the
author,
densitometric
measurement,
and evaluationby
32
independent judges.
Only
proofs
from
the twoCCD
scanners were shown to thejudges. Proofs
from
theSG-608,
ofnoticeably
higher
quality,
were usedfor
reference.The
four
proofsfrom
separations producedby
normally-exposed originalswere usedtoexaminethe
first
hypothesis.
Two
groupsofproofs,
onefor
eachscanner,
wererankedby
thejudges
according
tobest-to-worst
rendition oflower-midtone-to-shadow
detail.
The
rankings
for both
groups placed the3.5
f/stop
tonal rangesfirst,
4.5
f/stop
second,
5.5
f/stop
third,
and6.5
f/stop
fourth.
Visual
evaluationby
theauthor rankedtheproofsin
thesameorder,
establishing
a100%
correlation.Increases in
density
range were also expected tofollow
the3.5
to6.5
f/stop
ranking.But
actualmeasurements showedincreases in
density
to4.5
f/stops,
thenapronounceddrop
of
0.25
orgreaterfor
the5.5
and6.5
f/stop
ranges.This
demonstated
that thehigher
tonalranges exceeded the
capacity
oftheCCDs
to make afull
response,
indicating
thatlimited
dynamic
rangewascausing
abruptincreases in
tonecompression.To determine
thevalidity
ofthesecondhypothesis,
thejudges
examinedtwo groups oftwelve proofs
each,
corresponding
to the separationsfor
normal,
1/2
f/stop
over- and1/2
f/stop
underexposed originals within each ofthefour
tonal ranges.For
theAgfa
Horizon,
the rankings were
3.5
f/stop
tonal rangefirst,
4.5
f/stop
second,
5.5
f/stop
third,
and6.5
second,
5.5
f/stop
third,
and6.5
f/stop
fourth.
The
misranking
ofthe6.5
f/stop
rangein
second placeindicated
thedifficulty
thejudges
experiencedin
distinguishing
between higher
tonal rangesdue
to theincreasing
effects oftone compression.
Again,
densitometric
measurementsdid
not support the rankings
ofthejudges
or the authorbecause
thedensitometer
could notdistinguish between
small tonal range
differences due
to good exposurelatitude
and thosedifferences due
toblocked
shadowtonality resulting from
tonecompression.A
procedurewasdevised
for
mathematicalassessment oftonalrangedifferences.
Using
the change
in
density
between
adjacent tonalranges,
a value wasderived
which couldbe
expressed as afraction
oftheinital 1
f/stop
difference
between
ranges(
1
f/stop
=0.30
den
sity
units).For
example,
the3.5
f/stop
normal exposurefor
theAgfa Horizon
had
a tonalrange of
1.73
and the4.5
f/stop
normal exposurehad
a tonal range of2.02.
The
changefrom 3.5
to4.5 f/stops
is
+0.29.Expressed
as apercentage,
0.29
-0.30 =97%.
This
valueshowed that the scanner made a
nearly
complete responsein
translating
tonal rangediffer
encesin
the originaltransparency
to tonal rangedifferences
in
the separations.Further
refinement ofthesecalculationsis
needed toreflectdifferences
in
gamma andtonecompres sionbetween
theoriginaltransparenciesandthehalftone
proofs.The
findings
ofthisstudy
demonstrate
thatoptimalresultsfrom
aCCD
orPMT
scanner can
only
be
obtainedif
the tonal range ofthe original sceneis
less
than4.5
f/stops.
When
the4.5
f/stop
range wasexceeded,
theCCD
scanners respondedwith animmediate
deterioration
oflower-midtone-to-shadow
tonality.In
comparison,
PMT
scannerdisplayed
CHAPTER
1:
INTRODUCTION
Statement
ofthe
Problem
With
the advent ofdesktop
color scannersin
the electronic prepress production environment,
thequality
of color separationsfrom
transmissive originalshas become
erratic.The
cause ofthisflucuation
is,
in
part,
due
to thetransitionfrom
PMT
toCCD-based scanning
technology.Whereas,
PMT
scanners tend tohave
abroad dynamic
range,
that ofCCD
scanners
is
morelimited.
This
characteristicadversely
affectsthequality
of color separationsby
causing
additionaltone compression.A
possible solution to thedynamic
range problems posedby
CCD
technology1,
is
tolimit
the tonal range ofthe original transparenciesintended for scanning
and color separation.
The
techniqueofproducing
photographswith controlled tonal rangesis
referred to as measured photography.It
encompasses theidea
ofreverseengineering
from
the press sheet sothat themaximumdensity
rangewhichcanbe
reproducedon an offsetlithographic
printing
pressbecomes
thereferencetowhichtheoriginalphotographs are produced.In
the case offour-color
heatset
webprinting
on coatedstock,
the maximum reproducible
tonal rangeis generally
acknowledged ascorresponding
to adensity
of1.8.2On
a presssheet,
a reflectiondensitometer
might read0.10
at the5%
dot
placement and1.9
atthe
95%
dot
placementin
thedarkest
shadows.In
comparison,
a typicaltransparency
has
adiffused highlight
value of0.30
and a shadowvalue of3.00
for
an overalldensity
range of 2.70.1If
thedensity
range ofthepresssheet,
1.80,
is
subtractedfrom
thedensity
range ofthethe
printing
window of1.80.
The
resultis
pronounced tone compressionin
the transparency
whichprecludesanaccurate reproduction onthepress sheet.The
purpose ofthis thesis projectis
tostudy
how
differences
in
the tonal ranges oforiginal
transparencies
influence
thequality
of scans and color separations producedfrom
them.Since,
thedifferences
in
dynamic
rangebetween
PMT
andCCD
scanners appear tobe
animportant factor
in
thequality
ofcolorseparations madefor
reproduction,
this project
willinclude
two midrangeCCD
scannersfor
evaluationin
relation to aPMT
scannerserving
as ahigh-end
reference.The
first
stage ofthe projectwillbe
theproduction ofa set oftest transparencies withcontrolled tonal ranges.
The
lighting
on a stilllife
setwillbe
adjustedin
onef/stop
incre
ments
from
alow
range of3.0
f/stops
to ahigh
range of6.0
f/stops,
as measured with a reflected spotmeter.The
tonal rangefor
a giventransparency
willbe
calculated as thedis
tancein
f/stops
from
thebrightest
diffused
highlight
to thedarkest
shadowwithdetail.
Beginning
with theScreen
SG-608,
test transparenciescorresponding
to each ofthefour
tonal rangeswillbe
scanned and output as color separation negatives.From
theseparations,
halftone
proofswillbe
producedfor
subsequent evaluation.After
thereference proofshave
been
made,
the same set oftest transparencies willbe
scanned on thePixelcraft
CIS
4520RS
and theAgfa
Horizon,
both
12-bit, flatbed
CCD
scanners.Because
ofthecomponent nature of
desktop
scanners,
additional equipmentwillbe
needed to producecolorsep
arations.The
list
includes
aMacintosh
Quadra
700
computerrunning
Color Access 1.3.3
software
for
production oftheCMYK
separationfiles,
QuarkXPress
softwarefor
production of8
1/2"x11"
pages
containing
theimage
files,
and anAgfa 5000PS Star Plus
rasterimage
processorlinked
toanAgfa SelectSet 5000 imagesetter
for
outputting
theseparations.After
proofshave
been
madefrom
the separations producedby
theCCD
scanners,
an evaluation oftonal range parameterswillbe
conducted undercontrolledviewing
conditions.In
addition tovisualanalysis anddensitometric
measurementby
theauthor,
the proofswillENDNOTES
'Field,
Gary
G.
Color
Scanning
andImaging
Systems. Graphic Arts Technical Foundation.
1990.
p.30.
CHAPTER
2: BACKGROUND & THEORY
The Roots
ofMeasured
Photography
Competent
photographerslong
ago realizedtheimportance
ofcontrolling
tonal rangein
orderto preservehighlight
andshadowdetail
in
theirimages.
Initially
thiswasdone
by
locally
manipulating
theintensity
ofthelight
sourceduring
theprocess ofmaking
aprintfrom
anegative.This
techniqueis
called"dodging
andburning".
With negative-working
materials adodge decreases
theduration
oftheexposure andhas
theeffect ofdecreasing
density
ontheprint.A
burn
increases
theduration
oftheexposure andincreases
thedensity
ontheprint.In
practice,
dodging
is
usedtoretain shadowdetail
andburning
is
usedto retainhighlight
detail.
With
positive-working
materials suchasCibachrome
printsfrom
transparencies,
theeffects ofdodging
andburning
areexactly
opposite.A
more sophisticatedsolution to theproblem ofcontrolling
tonal rangewas proposedby
Ansel Adams in
thelate
1930s
and refined over the course ofhis
career as ablack
andwhite
landscape
photographer.Adam's
Zone System is
a method ofcontrolling
tonal rangein
the negativeby
compensating
with adjustmentsin
exposure anddevelopment.
This
involves
exposurefor
theshadows anddevelopment for
thehighlights,
and acombinationofboth
exposureanddevelopment
to controlhigher
densities
in
thenegative.1In
thecontext offour-color
offsetlithography,
tonal range controlis
again theprimary
issue. If
thetonal range oftheoriginal photographgready
exceeds thereproductionrangeofBackground
&
Theory
Refinements
in
printing
technology,
whichraisethelevel
of productquality
and consistency,
make the shortcomings ofmediocrephotography
increasingly
more apparent to graphicarts professionals.Excessive
contrast on the press sheet resultsin ink
plugging
theshadow areas and
obscuring
detail.
Insufficient
contrast yields reproductions which appearflat
andtwo-dimensionalandfail
toattracttheviewer'sinterest.
Reasons
for
Interest
in
the
Study
Drawing
onhis
years ofexperience as afreelance
photographer,
the author recognizes themindset of colleagues who tend toview theirtransparencies as anend
product,
ratherthanan
intermediate step in
the prepressproduction cycle.This
orientationdisposes
photographers toward
lighting
their photographs to produce the maximumtonal rangewhich canbe
held
by
thetransparency
film.
The primary
reason this occursis
thatmost studio photographerslight
theirsetsfrom
astarting
pointofhigh
contrast asproducedby
a singlekey
light
in
adimly
lit
studio environment.
As
thelighting
is
refined,
fill lights
and accentlights
may
be
added tolower
thecontrast ratio and
increase
surfacedetail
in important
areas oftheproduct.On
smalltabletop
sets often white or silver
fill
cards are usedin
place of additionallight
sources.These
arepositioned tocatch and reflect
illumination
from
thekey
light
anddirect
it into
areas oftheproductwhicharetoo
dark,
thereby
decreasing
thecontrast ratio.If
the photographeris working
with electronicflash,
he
will evaluate theselighting
refinements
by
periodically
shooting
aPolaroid
testshot.Otherwise,
the cumulative effect ofthelighting
canonly
be
judged
by
interpreting
f/stop
readingsfrom
aflashmeter. To
clarify
thispoint,
consider that theintensity
offlash
illumination
is
whatdetermines
thefilm
exposure.
It
can notbe
evaluatedby
thehuman
eye,
thusPolaroid
film
is
an essentialtool.Note,
thatif
thephotographeruses tungstenlighting,
the needfor
Polaroid
testsis
lessened.
Because it is
a continuouslight
source,
theeffects of tungstenlighting
arevisibleand canbe
Since
Polaroid
designed
its
professionalfilms
tobe
usedfor
proofing
purposes, asjust
explained,
it
follows
thatthey
are equippedwith tonal ranges which approximatethe range oftransparency
films
that thephotographer exposes as an end product.For
example, whenKodak introduced its
4x5
sheetfilm,
Ektachrome
100+,
rated atASA
100,
Polaroid
fol
lowed
suitby introducing
Polaroid Type
54,
also rated atASA
100.
These
twofilms
work well togetherbecause
theirtonal range characteristics arevery
similar andthereis
no needtorecalculate
ASA
ratings.The importance
ofthePolaroid
tonal rangeis
that,
by
default,
it is
the photographer's guide todetermining
when a photographis
correcdy
lit.
If
shadowandhighlight detail
is
correctly
rendered on thePolaroid,
then the photographerknows from
experience that the same renditionwillhold
trueonthetransparency
film.
These
sharedtraitsbetween Polaroid
andtransparency
films
areso consistentthatoften studio photographersfind
it
unnecessary
to usealightmeter.
Since many transparency
films
aredesigned
with a contrast range of5 f/stops
from
highlight
withdetail
to shadowwithdetail2,
Polaroid
has found
it
advantageous to offer theirfilms
with a similar range.For
this reason,many
studio photographersunknowingly
light
theirphotographstoacontrast range of5 f/stops.
The
resultontheartdirector's light
tableis
transparencies with perfecthighlight
andshadowdetail,
which utilize thefull
con trastrangefor
whichthey
weredesigned.
However,
when theseimages
are reproducedby
offsetlithography,
the5
f/stop
rangeis
too great tofit
through theprinting
window and substantialtonecompressionoccurs.2A Brief History
ofElectronic
Color Separation
Theory
a
German
physicist.Building
onKorn's
theories,
American
Telephone
andTelegraph intro
duced
thefirst
wirephotoserviceto theUnited Sates
in
1925.3Alexander
Murray
andRichard Morse
werefirst
to receive a patentfor
acolor-separation
scanning device.
Using
a conventionalengineering
lathe,
they
built
thefirst drum
scanner
in
1937
atKodak Research Laboratories. A
decade later
in
1947,
Time Inc.
acquiredtheprototype
from
Kodak
andproceededto refineit. In
1949,
Time
hired
theAustin
Company
to
build
whatbecame
thefirst
workable scanner.Not
long
after,
Hall
andRoss
atPrinting
Developments
Inc.
(PDI)
finished
workon theModel H-R
scanner,
introduced in
1950.4Early
scannersutilized vacuumtubetechnology
whichgenerated prodigous amounts ofheat
andrequired
warm-up
periodsofup
to twohours.
Typically,
anothertwohours
were neededtoproduce a set of continuous tonecolor separationswhichcould
be
madeonly
to100
percent oforiginal size.
In
spite oftheselimitations,
Time
had
installed
sixH-R
scannersby
August,
1950.5Since
letterpress
was thedominant printing
process oftheera,
a relatedfield
ofendeavorduring
the1940s
waselectronicengraving
ofmetalplates.Fairchild Camera
andInstrument
Corp. introduced
theirPhotoelectric Engraver in
1949.
It
used alathe
arrangement similarto the
PDI
scanner,
but
theimage
dots
wereburned
into
plastic with a red-hot stylus.Within
afew
years,
Fairchild
made anenlarging
andreducing
machine called theScan-A-Sizer
thatused acylindricalplateholder
capableof120
line-screen,
black
andwhiteoutput.6
Dr.
Ing
Rudolf
Hell's
Klischograph
had
similarfeatures,
but
used ahardened
steel stylus toengrave plastic or metal
letterpress
plates.Black
and white machines wereintroduced in
1953
and color modelsfollowed
soon after.The
Vario
Klischograph
featured
enlargementand reduction
capabilities.7
These
machinesintroduced
electronics to theprinting
business
and
foretold
thedevelopment
of moresophisticated electronic scanners.Since
theintroduction
ofthefirst
color separation scanner,many
technological advanceshave been
incorporated
into
recentdesigns.
These include
equipmentflexibility
whichseparations,
andgreater ease of use.Energetic
research anddevelopment
effortsby
ahandful
of companieshave
created athriving
marketfor
color separationscanning
overa span of20
years.These
manufacturersinclude
Crosfield
Electronics,
Dainippon
Screen,
theHell
Co.,
Royal
Zenith
Corp., Eikonix-Kodak,
andScitex America
Corp.8The
first
step in
executing
a scan on ahigh-end
color separation scanneris
to mount the originaltransparency
or reflectioncopy
on thescanning
drum.
On
the output side ofthe
machine,
a sheet ofhigh
contrast scannerfilm
is
positioned on therecording
drum.
As
thescannerdrum
rotates at1200
r.p.m.,
a small spot oflight
is
transmitted or reflected off the original.It
scans afine line
ofcopy
during
each revolution ofthedrum,
moving
precisely
oneline
widthin
a spiral pattern untilthe entireimage
has
been
scanned.Light
from
each spot on the scannedcopy is
transmitted to thescanning
head
where abeam
splitterdivides
it into
four
parts.Three
are usedfor
thered, green,
andblue
channels,
while thefourth
becomes
theunsharp
masking
signal.The
three channels each travel through acolorseparation
filter
before
being
focused
on aPMT
which convertsRGB
into
electricalimpulses. These "uncorrected
color separationsignals"
are then sent to the color computer
wherecorrectionsare madeto accommodate
printing
conditions.Next
thescaling
computersizesthe reproductions
for
output on therecording drum
by
expanding
orcompressing
the signalsin
circumferential and axialdirections
in
accordance with the specifieddegree
of enlargement orreduction.'If
the outputfrom
the color computeris
continuous,it is
termed ananalog device
since the signal cannot
be
electronically
expanded or compressed.Limited
mechanical enlargementis
facilitated
by
changing
the circumference ratio ofinput
to outputdrums.
For
electronicscreening
thedigital
signals arefed
directly
to thedot
generator.However,
most scanners use an analog-to-digital converter so that
digitized
signals canbe
storedin
short-term memory.
An exposing
pulse retrieves theseimage
signals and plays themback
over theexposing
drum
at slower speedfor
enlargement orfaster
speedfor
reduction.To
change scalein
the axialdirection
speed ratios are variedbetween exposing
andscanning
heads.
For
instance,
thescanning
head
wouldmovehalf
thespeed oftheexposing
head for
a200%
enlargement,ortwicethespeed oftheexposing
head for
a50%
Theory
Photomultiplier
Tubes
The
mostcommon photomultiplier(PMT)
usedin
high-end
scannersis
akind
ofvacuumtube photoelectric cellthat creates a signal multiplication effectwithinthe cell
itself When
light
strikes a photoemissivematerial,
known
as thephotocathode,
a stream ofelectronsis
emitted.
The
electron streamis
routedto asecondary
electron-emitting
electrode,
calledthe"target
electrode",
whichis
maintained at a positive potentialin
relation to the cathode.Secondary
electrons are emittedby
the target electrode and routed toward another targetelectrode and so
on,
untiltheaccumulated electronshave
undergoneseveralstages of amplification.
After
thisprocess,
the electrons are collected at the anode ofthe photomultiplier.Photo
multiplier'soccasionally
have
problemsrecording detail
in
very
dark
shadows,
due
to aweak
initial
stream ofelectrons of similarintensity
to thenoiselevel
ofthe device.11Charge-Coupled Devices
A
charge-coupleddevice
(CCD)
is
a semiconductor ora solid statedevice.
One
layer
of aCCD
consists of alayer
ofoverlapping
metallic electrodes and a second silicon crystal.The
intensity
oflight
reflectedfrom
ortransmitted throughthe originalis
recordedby
theelectrode network.
When
a photon oflight
strikes an electrode,it
pairs with an electronfrom
the silicon and creates a
gap in
the crystalline structure ofthe silicon molecules.The
electrons are conveyed
along electron-conducting
channels submerged within thedevice
throughchanging
zones ofhigh
andlow
electrical potential.When
the electrons reach anoutput
register,
they
are conveyedin
"packets"
(one
packet perpixel)
perpendicularto theirinitial
direction
oftravel.Along
the output shiftregister,
theelectronstravel to an amplifierwherethe charge ofeachpixel
is
measured.The
final
measureindicates
thelight
intensity
in
each pixel.
The
techniqueofmoving
theelectronchargeis
referredtoascharge-coupling.12One
advantage ofusing
CCDs
overPMTs is
theirinherent
stability.Technically,
CCDs
are more sensitive thanPMTs,
but
PMT
signals aresubstantially
ampified whereasCCD
signals are not.This
characteristicgivesPMT
scanners ahigher dynamic
rangein
relaThe
primary
limitation
withlinear CCD
arraysis
thattheir resolutionis
restrictedby
the size ofthe electrodes used to record the
image. The
width ofafirst level
electrodeis
about
5
microns(1/25
thediameter
of ahuman
hair).
Typically
CCDs
are manufacturedtosizes of
2,048
or4,096
elements,
although newerdesigns
may
have
7,000
elements.Recorded image
resolutionmay
be
adjustedby focusing
thearray
over shorter orlonger
dis
tances with variable
focal-length
lenses.
For
example,
a2,048-element array
will give ahigher
frequency
sampling
per unit widthwhenfocused
overa35mm
transparency
, thanif
focused
overthe samedimension
of a4X5
transparency.The
enlargement ratiodetermines
the
necessary
sampling
width.14Background
on the
Pixelcraft
CIS
4520RS
The Barneyscan
CIS 3515
was thefirst
high
quality
scanner that could accept mountedslides as an
input
source.With
aselling
pricejust
under$10,000,
it
created considerableinterest
whenintroduced in 1987
attheDesktop
Publishing
Conference in Santa
Clara,
CA.
Only
the yearbefore,
Howard
Barney,
one ofthe engineers whodeveloped
the originalDunn
film
recorder,
decided
to starthis
owncompany
for
the purpose ofdesigning
andmarketing
alow
costCCD
slide scanner.Within
a short time aftertheintroduction
oftheBarneyscan
CIS
3515,
theidea
had
takenhold
with other manufacturers andbefore
long
Eikonix, Howtek,
andNikon
had
introduced
theirownCCD
slidescanners.15The Pixelcraft CIS
4520RS
is
an up-scale version oftheCIS
3515,
withascanning
resolution of
2000
dpi
at12
bits
per pixel.It
utilizes alinear
CCD
array
whichmakes three passesoverthe
image,
one eachfor
red,
blue,
and green.Preview
modefor
thescanneris gray
scaleonly,
with9
minutes required to scan a35mm
slide at1000
dpi.
While
thisis
a snail-likepace relative to current standards, the
CIS 4520RS
does
its scanning
off-line, withoutrely
ing
on aMacintosh
computer.This
leaves
the operatorfree
toset-up
anotherimage
whilescanning
thefirst
one,
thusimproving
thethruput.16
Packaged
with theBarneyscan
CIS
4520RS is
separation softwareby
Color Access.
As
theTheory
ofthe print process
is
further demonstrated
by
its Color
Access
separationsoftware,
included
with the scanner.It
producesfar better
separations than those madein
Adobe
Photoshop. The Color Access
separations produced alighter black
plate,
resulting
in
better
shadow
detail,
andhandled
saturated reds muchbetter
thanPhotoshop."17In
aCCD
scanner comparisontest,
MacUser
characterized theBarneyscan
CIS 4520RS
ashaving
a narrow colorgamut,
but
one thatis
none-the-less well-balanced.In
comparisonwith the
Leaf
35
and45,
theNikon
LS
3510AF,
andtheMicrotek
Scanmate 1850,
it
wasfound
to produce the most accurate color rendition.18The primary limitation
oftheCIS
4520RS
is its relatively
low
resolution of2000
dpi.
This
constrainstheoutput reproductionsize to
8x10 inches. In
theOctober
1,
1992
issue
oftheSeybold Report
onDesktop
Publishing,
the narrowcolorgamutoftheCIS 4520RS
is
citedasmaking
it"less
thanideal
for
those who want to send theimages
out to afilm
recorder to make chromalines-thedynamic
rangeofthescanner enginejust isn't
sufficient."19Background
on theAgfa Horizon
The
Horizon,
amidrange,
flatbed
scannerfrom
Agfa,
wasintroduced
at theGutenberg
Festival in
Long
Beach,
CA in
1992.
It
features
a15,000
elementCCD
areaarray
composedofthree
5,000
CCD
arrays which areoptically
butted
with aproprietary
technique to givean optical resolution of
1,200
x1,200
dpi
overthefull
scan width.The
extralarge
scan areameasures
11.7
x16.5
inches
for
reflective originalsand8
x15
inches
for
transmissive originals.
Electronic zooming
permits a range ofresolutionsfor line
artfrom
20
to2400
dpi.20The
sampling
ratiofor
colororiginalsis 12
bits
per pixelpercolor,
whereas gray-scalescansare carried out at
10
bits
perpixel.The
dynamic
range of transmissive originalsis
boosted
by
a nonlinear amplifier to a
density
range of3.0 Dmax. Color
look-up
tables convert pixeldata
to10, 8,
or singlebits
determined
by
the scannerdriver
application.In
scanner modeThe
scannerdriver
softwareincorporates
two newfeatures
unique to theHorizon. The
first
is
built-in
unsharp
masking,
whichis
performed onthefly
according
to sixfilter levels
made while
setting
up
the scan.Second is
theability
to setindependent
white points andblack
pointsfor highlight
and shadowdetail
during
the prescanoperation,
priorto thefinal
For
thisproject,
theset oftest transparenciesshottocontrolled contrast rangeswillalsobe
scanned on theAgfa
Horizon
to provide a second set oftestdata.
In
contrast to theBarneyscan
CIS
4520RS,
whichhas
a reputationfor producing
accuratehigh-quality
scansfrom
transparencies,
theAgfa Horizon
during
its
brief
stay in
theIntegrated Electronic
Prepress Lab
atRI.T., has
achieved recognitionfor
its unusually
poor scansfrom
transparencies.
The
author suspects that thisdistinction
is
undeserved.In
theSeybold Special
Report covering
the1993
Boston
convention,
a test of midrange color scannersincludes
four-color
images
scanned ontheHorizon
whichshowit
tobe
of similarquality
toits
comTheory
ENDNOTES
Adams,
Ansel. The
Negative,
The New
AnselAdams Series
onPhotography,
New York
Graphics
Society, Little, Brown,
andCompany.
1982.
Page
82.
Paraphrased
from
Milburn,
David.
"Benefits
ofMeasured
Photography,"E.S.P.RI.T.
Rochester Institute
ofTechnology.1993.
Vol.
7,
Page 24-25.
3Molla,
R.K
Electronic Color Separation
Scanning,
Chapman
Printing
Co.
1990.
Page 34.
4Field,
Gary
G. Color
Scanning
andImaging
Systems. Graphic Arts Technical Foundation.
1990.
Page 5.
'Field,
Gary
G. Color
Scanning
andImaging
Systems.
Graphic Arts Technical Foundation.
1990. Page 5.
'Molla,
RK Electronic Color Separation
Scanning,
Chapman
Printing
Co.
1990.
Page 34.
7Field,
Gary
G. Color
Scanning
andImaging
Systems. Graphic Arts Technical Foundation.
1990. Page
8-9.
"Molla,
RK Electronic Color Separation
Scanning,
Chapman
Printing
Co. 1990. Page 37.
'Molla,
RK Electronic Color Separation
Scanning,
Chapman
Printing
Co.
1990.
Page
45.
10Molla,
RK. Electronic
Color
Separation
Scanning,
Chapman
Printing
Co.
1990.
Page
46.
"Paraphrased
from
Field,
Gary
G. Color
Scanning
andImaging
Systems,
Graphic Arts
Technical Foundation.
1990.
Page
29-30.
12Paraphrased
from
Field,
Gary
G. Color
Scanning
andImaging
Systems,
Graphic
Arts
Technical Foundation.
1990.
Page 30.
"Paraphrased
from
Field,
Gary
G.
Color
Scanning
andImaging
Systems,
Graphic Arts
Technical Foundation. 1990. Page 30.
"Paraphrased
from
Field,
Gary
G. Color
Scanning
andImaging
Systems,
Graphic Arts
Technical Foundation. 1990. Page 32.
16
"Sliding
into
high
gear:desktop
slidescanners,"
MacUser,
Ziff-Davis Publishing. 1992. Vol.
8,
no.11,
p.42.
17
"Color
Scanners,"Seyb
'oldReport
onDesktop
Publishing,
Seybold
Publications.
1992.
Vol.
16,
no.7,
p.13.
""Scanners,"
MacUser
Annual
1993,
Ziff-Davis
Publishing. 1993. Vol.
8,
no.13,
p.243.
1S
'Seybold
Report
onDesktop
Publishing,
Seybold
Publications. 1992. Vol.
7,
no.2,
p.48.
20
"Agfa
rollsouthigh-res
scanner,"
MacWeek,
Coastal
Associates
Publishing.
1992.
Vol.
6,
no.19,
p.8.
21
"Agfa
unveilssecond newCCD
scanner:Horizon
aimed atprepress,
production,"
Seybold
Report
onPublishing
Systems,
Seybold Publications.
1992.
Vol.
21,
no.16,
p.21.
22"Agfa
rolls out
high-res
scanner,"
MacWeek,
Coastal Associates
Publishing. 1992.
Vol.
6,
no.
19,
p.19.
23
"Mid-range
scanners,"CHAPTER
3:
HYPOTHESIS
While
thereis
widespread acknowlegementamong
graphic arts professionals thatCCD
scanners
lack
thebroad dynamic
range oftheirPMT
counterparts,1improvements in CCD
performance
have
generally
been
directed
at methods ofincreasing
signal-to-noiseratio,
oradjusting filtration
strategies to achieve amorelinear
responseto thevisible spectrum.This
thesis projectproposedto
study
another approach toimproving
CCD
scannerperformancebased
onchangesto theoriginalcopy,
ratherthan thescanneritself.
Since CCD
scannershave
a morelimited
dynamic
range,
it
seemedlikely
thatthey
would
have
troublescanning images
with wide tonal ranges.The initial
stage ofthestudy,
proposed
by
thisauthor,
wasto utilize measuredphotography
for
producing
a series of original transparencies with specific tonal ranges.
Using
a reflected spotmeter with a onedegree
angle ofacceptance, the tonal values
in
the original scene,in
this case a stilllife,
couldbe
controlled through carefulplacement of
highlight
and shadowvalues.As
a referencepoint,
the
brightest highlight
withdetail,
ordiffused
highlight,
wouldbe
maintainedat a constantreflection
brightness
value,
measuredin
tenths of anf/stop.
At
the opposite end oftherange,
thedarkest
shadowwithdetail
wouldbe
changedin
onef/stop
increments
to achievetonalranges of
3.0,
4.0,
5.0,
and6.0 f/stops.
In
addition to normal exposuresfor
each tonalrange,
over and underexposures wouldalso
be
producedin
an effort to examine the parameter ofexposurelatitude
andhow
it
is
affected
by
changesin
tonal range.In
total theexposures madeon the stilllife
scenewouldinclude 20
sheets of4X5
transparency
film.
Five
exposures were tobe
madefor
eachtonalrange,
including
a normalexposure,
ahalf-f/stop
over and underexposure, plus afull-f/stop
overandunderexposure.
This
combination ofexposures wouldalso makeit
possible toeditexpo-sure,
if
necessary.Once
thefilm had been
processed,
this set ofmeasured transparencies couldbe
usedto evaluatetheperformance of selectedCCD
scanners,
in
termsof theirability
to rendervarying
tonal ranges.In
addition totesting
twoCCD
scanners,
aPMT
scannerwould also
be
used as ahigh-end
referencetodemonstrate
thebest-of-kind
results achiev able with current state-of-the-artequipment.The
scanner chosenfor
this purpose was theDainippon Screen SG-608.
Of
the twoCCD
scanners chosenfor
thisproject,
thePixelcraft
CIS
4520RS
wasnoted
for
its
excellent performance.2As
one ofthefirst
mid-rangeCCD
scanners on themarket,
it
was a pioneerin
this most recent niche.The
Agfa Horizon
was chosenas the sec ondCCD
scanner.3
It
wasa newcomerto the marketplacewithfew followers
andunprovenperformance.
Although
comparisonsbetween
scanners were not theprimary
objective of thisstudy,
the authordecided
thatusing
two scanners,instead
ofone, wouldlend
further
credibility
to theresults,
providing they
werein
agreement.Stated in
conciseterms,
thehypothesis
ofthis thesis project wasthat thelower
the tonalrange ofthe original
transparency,
the morereadily
highlight
and shadowdetail
couldbe
retainedin
the separations producedby
aCCD
scanner,linked
to aMacintosh
Quadra
700
computer,running Color Access
software and output to anAgfa
5000PS
Star Plus
rasterimage
processor,interfaced
withanAgfa SelectSet
5000 imagesetter.
The
second part ofthehypothesis
concerned the one-halff/stop
over- and underexposed transparencies and
how
well their scans would separate andreproduce,
in
relation to those ofthe normal exposure.Good
exposurelatitude
wouldbe
indicated
by
smalldiffer
encesin
tonalrenditionandpoorlatitude
wouldbe
shownby
large
differences. The hypoth
esispertaining
to exposurelatitude
was thatit
woulddecrease
withincreasing
tonal range.ENDNOTES
Field,
Gary
G. Color
Scanning
andImaging
Systems.
Graphic
Arts Technical Foundation.
1990.
p.30.
2 "Scanners,"
MacUser
Annual 1993.
Ziff-Davis
Publishing. 1993. Vol.
8,
no.13,
p.243.
3
CHAPTER
4:
METHODOLOGY
Production
ofTest
Transparencies
The first
stage ofthis thesis project was the productionoftesttransparenciesutilizing
measured photography.
Based
on similartesting,
undertakenin RI.T.'s
photography
depart
ment
during
thewinter of1992-1993
for
theclass,
Picture
andPage
Research,
the authorfound
thatshooting
a series oftonal ranges couldeasily
be hindered
orfacilitated
by
thechoice ofwall and
ceiling
colorin
thesurrounding
studio environment.Earlier
effortsfor
thisclass were complicated
by
asmall studio spacewith white wallsandlow
suspended ceiling
whichtended toreflectlight back
totheset,
thereby
increasing
thelevel
ofambientlight
and
making it
difficult
toachievebroader
tonal rangesabove5
f/stops.
To
accomplish the tonal ranges neededfor
thisstudy
of3
f/stops
minimum and6
f/stops
maximum, several changes were necessary.Primary
among
these was to relocatetheset used
for
the tests toStudio
4-8,
ablack
space with a14-foot
ceiling.This
changereduced the ambient
light
level
by
minimizing
the effects ofstray
light
reflectedfrom
thewalls andceiling, thus
making
it
possibletoachievea6.5
f/stop
tonal range.In attempting
to createa3
f/stop
tonalrange,
theblack
studiowas aliability.
The
lack
of reflected
stray
light
tofill
in
shadows and reduce contrast, was offsetby
using
48"x
72"sheets ofwhite
foam
coreboard
to surroundtheset onall sides.The
effect of theselarge fill
cards was to maximize the
level
ofambientlight
around the setby
preventing stray
light
from
escaping into
thestudio.The
tonal rangefor
agiven photographis
determined
by
twofactors.
One,
which isinfluenced
by
the studio environment,is
the angle andintensity
ofillumination
whichis
usedto
light
theset.The
otheris
theamountoflight
reflectedfrom
various surfacesin
theMethodology
whichstrikes
its
surface.A
black
smooth-textured objectreflects15
to20
percent.In
termsof
light
intensity,
15
percentreflectanceis
2
1/2
f/stops less
than90
percent.Considering
this
difference,
thelighting
ratio(ratio
ofkey
tofill
light)
used ontheset can not add morethanan additional
1/2
f/stop
of contrastfor
the3
f/stop
tonalrange example.The
measuring
instrument
used todetermine
reflectancefor
these tests was aMinolta
Spotmeter
F.
Designed
to read reflectedlight
from
a1
degree
angle ofacceptance, theunique
feature
ofthis meteris
thatit
can measuretheintensity
offlash
illumination
as well as ambientlighting.
The
1
degree flash reading
ability
makesit
possible to meter precisepoints
in
a scene which otherwise couldbe
evaluatedonly
witha trial exposure onPolaroid
film.
For
example,
when aMacbeth
color checkeris
placedin
thescene,
spotmeter readingscan
be
takenfrom
individual
colorpatches.To
minimize variationin
meter readingsresulting from
changesin
the angle ofreflectance,
allmetering
wasdone
on thecamera/subject axisfrom
just in
front
ofthelens.
Past
experiencehad
shown that variation ofup
to1/2
stop is
commonin
readings ofthesame colorpatch taken
from
various angles relative to the camera position.The Spotmeter
F
providedfor
ahigh level
ofaccuracy
withdigital
readoutin increments
of one-tenthf/stop.
Under
normalviewing
conditionsone-thirdf/stop
is
ajust
noticeabledifference.
The
camera used to shoot the original transparencies was a4X5
Zone VI
with aRodenstock Sironar 210mm
f/5.6 lens.
To
facilitate
criticalfocus
adjustments,
the camera'sground glass was replaced with a
fresnel
focusing
screen whichincreased
thebrightness
oftheprojected
image
onthegroundglassby
about3 f/stops.
In
preparationfor
constructing
a setin Studio
4-8,
avariety
ofgardenproduce and asuitable
background
were procured.A
piece of plywood 4'x 4'
supported
by
two sawhorses,provided the
foundation
for
a"look-down"
style
set,
meaning
that the camera was positioned on a monostand above,
looking
nearly
straightdown.
From
thisangle,
the groundglass ofthe
4
x5
view camera wasfilled
with the matchstick windowblind background
Before
thefilm
for
the tonal range test couldbe
shot,
apreliminary
film
testwas carried out to
determine
the currentfilm
speed and colorbalance
under the studiolighting
conditions.
A
roughly
composed stilllife
waslaid
outwith thevegetables.Then
aMacbeth
Color Checker
was placedin
the middle ofthe scene.The
set waslit
with twoBroncolor
lampheads
outfittedwith"salad
bowl"
reflectorstocreate a
broad
evenlight
source.A
singlefill
card was used on the right side ofthe set to reduce the tonal range to5 f/stops from
metered
highlight
to meteredshadow,
with the normal exposurefalling
atf/45
based
on aflash
intensity
from
twoBroncolor
Flashman
generators set at1/2
power(approximately
700
wattseconds each).Four
sheets ofFuji
Velvia
RVP,
Emulsion
518-471,
were exposed with abracket
off/32.5, f/32.8, f/45.1,
andf/45.5.
Although
the manufacturer persistsin rating
thisfilm
atASA
50,
thespeed rangesbetween
ASA
25
and32. ASA
32
was usedfor
this test.The
films
were thenprocessed
by
Spectrum
Color,
alocal
Rochester
lab
specializing in E-6
processing.On
alight
tablebalanced for
5000
Kelvin,
the processedfilms
were evaluated.The
best
exposure was
f/32
1/2,
sothisbecame
thesubsequent referenceexposure.Color
balance
wasjudged
tobe 5
points yellow.The
author elected tokeep
thewarm castbecause
it
addedtothesunlit
feel
ofthestilllife.
Because
the3
f/stop
tonal range seemed mostdifficult
to achieve,it
was the oneattempted
first.
The
set wassurrounded onthree sidesby
whitefoam
corereflectorstomodify
the outputofthe twoBroncolor
flashheads
on thefourth
side.Resting
againstthefoam
core weresmallersilver reflectors angledto add more
light
todeep
shadow areas.Above
theset,
just
below
cameralevel,
anotherlarge
piece offoam
core was positioned to reflectlight
downward.
In
thegap
below
the saladbowl
reflectors, smaller pieces ofwhitefoam
corewere positionedtoeliminatethe
remaining empty
spacessurrounding
theset.In
spite oftheseefforts,
thelowest
tonal rangethatcouldbe
achievedwas3.3
f/stops
asread
by
theMinolta Spotmeter
F.
To
reduce the tonal rangeby
another1/3
f/stop
wouldhave
required a reflectivefabric
tentin
place ofthefoam
core reflectors and arepositioning
Methodology
highlight
valuesfor
alltonal ranges.This
wasdependent
onkeeping
thelight
sourcein
thesame position
for
alltests,
so thechangesnecessary
for
a3
f/stop
tonal rangewere ruled out.Rather
thanwork withthe tonal range at3.3
f/stops,
thefill
cardssurrounding
thesetwereadjusted to
increase it
by
0.2
f/stop
toachieve a3.5
f/stop
tonal range.The
vegetables selectedfor
the stilllife
were chosen with several purposesin
mind.First
was the representation ofdiffuse highlight
values achievedby
the onion and garlic.Second
was the representation ofdeep
shadow values withdetail
as seenin
theNorwegian
bell
peppers andItalian
eggplant.Third
was the representation ofmidtone valuesby
theBrussels
Sprouts,
beans,
artichokes,
and cabbage.To
provide additionalhighlight,
shadow,
and
gray
scalereferences,
aMacbeth Color Checker
andKodak Q-14 gray
scale wereincluded
at the edges ofthe composition.Spotmeter
values were recordedfor
the sixgray
scale steps onthe
Color
Checker
aswell asthediffuse highlight
reference onthe onion andthe
deep
shadowreferenceonthebell
pepper(refer
toFigure
4-1).
Table 4-1:
Reflection
brightness valuesin theoriginal stilllife scene measuredinf/stops.Tonal
Rg
F/STOPS
Macbeth
Color Checker
Hghlt
Onion
Garlic
Eggplt
Cabbage
Shadow
Pepper
1
2
3
4
5
6
+3.5
45.1
32.5
22.7
22.0
11.9
8.4
45.1
45.0
11.8
16.0
11.5
3.5N
45.1
32.5
22.7
22.0
11.9
8.4
45.1
45.0
11.8
16.0
n.5
-3.5
45.1
32.5
22.7
22.0
11.9
8.4
45.1
45.0
11.8
16.0
11.5
+4.532.7
32.2
22.5
16.7
11.6
8.2
45.1
32.7
11.6
11.7
8.5
4.5N
32.7
32.2
22.5
16.7
11.6
8.2
45.1
32.7
11.6
11.7
8.5
-4.5
32.7
32.2
22.5
16.7
11.6
8.2
45.1
32.7
11.6
11.7
8.5
+5.545.0
32.3
22.6
16.8
11.7
8.2
45.1
32.8
8.4
11.8
5.655.5N
45.0
32.3
22.6
16.8
11.7
8.2
45.1
32.8
8.4
11.8
5.65-5.5
45.0
32.3
22.6
16.8
11.7
8.2
45.1
32.8
8.4
11.8
5.65
+6.5
32.7
32.1
22.3
16.4
11.2
5.6845.1
45.0
8.4
11.7
4.5
6.5N
32.7
32.1
22.3
16.4
11.2
5.6845.1
45.0
8.4
11.7
4.5
-6.5
32.7
32.1
22.3
16.4
11.2
5.68
45.1
45.0
8.4
11.7
4.5
To
accomplish thelighting
changesnecessary
for
the progressionfrom 3.5 f/stops
to3.5
to4.5
f/stops
wasprimarily
affectedby
removing
the silver and goldfill
cardsleaning
against thefoam
coreboard.
To
increase
the tonal rangefrom
4.5
to5-5
f/stops,
thefoam
coreboards
above andin
front
ofthe set were removed.In
addition,
the tworemaining fill
cards were moved outwardfrom
the setby
6"
to
10".
For
thehighest
tonal range of6.5
f/stops,
asingle 2'x 2'
fill
card was positioned twofeet
away
from
the right side ofthesettoaddatraceof
detail
to thebell
peppers.A
set of20
test transparencies wasproducedfor
initial
evaluation.These
encompassed4
contrast ranges:3.5
f/stops,
4.5
f/stops,
5.5
f/stops,
and6.5
f/stops.
Within
each ofthesecontrastrangeswere
5
exposures:+1, +1/2,
Normal
(N),
-1/2,and-1.Although
al/3f/stop
bracket
is
standard procedure whenmaking
critical exposures ontransparency
film,
thisincrement
wasunlikely
toshow adiscernable
changewhen viewedas aFuji
Color Art
proof,
due
to the effect oftone compression.Based
on thebracket
ofinitial
test exposures, theauthorexpectedthata
1/2
f/stop
increment
wouldbe
neededto see a noticeabledifference.
Likewise
withthe1
f/stop
increment between
tonal rangecomparisons, previoustesting has
shown that a1/2
f/stop
increment,
although well-suited todigital image
capturedevices,
is
not
consistendy
noticeable ontransparency
film.
Because
ofthe aforementioned need to establish noticeabledifferences
and the timeconstraints
involved in
subsequent steps with thesetransparencies,
particularly
during
thescanning
stages,
the testimages
werelimited
totwelve totalfor
eachscanning
device,
includ
ing,
for
3.5
f/stop
range: +1/2,normal,
-1/2;for
4.5
f/stop
range: +1/2,normal,
-1/2;for
5.5
f/stop
range: +1/2,normal,
-1/2;andfor
6.5
f/stop
range: +1/2, normal, -1/2.Scanning
with the
Dainippon Screen SG-608
At
the outset ofpreparationsfor
scanning
the test transparencies withtheScreen
SG-608,
theauthor recognized a need to create a neutral
gray border surrounding
theimage. Rather
than
having
a whiteborder
which woulddetract from
the contrastin
the testimage,
or ablack border
which wouldheighten
the perception ofcontrast, agray background
wouldmer-Methodology
its.
Since
the proofs weretobe
optically
centered on8.5"
x
11"
pages,
using
the same substrateas the
balance
ofthethesis,
it
was preferableto generate thegray
background
as partofthe separation
films.
After
consideration,
nolikely
approach seemed athand for producing
thegray
back
groundwiththe
SG-608. One
possibility
was toexamine thescanner softwaretodetermine
if
theSG-608
couldbe
pre-set to generate separationscontaining
agray
surround withoutactually
having
abackground
mounted on thedrum
with the transparencies.Another idea
wasto mount the transparencies
in
agray
border
priortoscanning.However,
thefactor
thatweighed most
heavily
was the easewith whichfour
separationsfit
across thelength
ofthescanner
film
at the reproduction size of119
mmx153
mm plus registration marks.This
layout
madeit
convenient to expose three orfour
gang
scans on one sheet offilm.
Producing
8.5"
x
11"
separations wouldrequire
3
to4
timesas much separationfilm.
The
appeal ofmaintaini