Smart control for minimizing distribution network reinforcement cost due
to electrification
Danny Pudjianto
a,n, Predrag Djapic
a, Marko Aunedi
a, Chin Kim Gan
b,1, Goran Strbac
a, Sikai Huang
c,2,
David Infield
ca
Imperial College London, Electrical and Electronic Engineering Department, South Kensington Campus, UK
b
Universiti Teknikal Malaysia Melaka, Faculty of Electrical Engineering, Durian Tunggal, Malaysia
c
University of Strathclyde, Department of Electronic and Electrical Engineering, Royal College Building, UK
H I G H L I G H T S
cGrowth of electricity loads driven by electrification of transport and heat will be significant.
cIt will increase the electricity peak demand up to 2–3 times and cost tens of billion pounds if we maintain Business as Usual approach.
cA coordinated application of smart demand technologies can significantly reduce this cost.
cIt requires sets of policies and regulations to facilitate timely deployment of such technologies.
a r t i c l e
i n f o
Article history:
Received 30 September 2011 Accepted 10 May 2012 Available online 13 June 2012
Keywords:
Distribution network Electrification Smart control
a b s t r a c t
Electrification of transport fleets and heating sectors is seen as one of the key strategies to further reduce the use of fossil fuels and the resulting greenhouse gas emissions. However, it will potentially cause a significant increase of electricity peak demand and have adverse consequences on the electricity system, in particular on distribution networks. This paper will address the benefits of various applications of smart network control and demand response technologies for enhancing the integration of these future load categories, and for improvements in operation management and efficient use of distribution network assets. A range of numerical simulations have been carried out on different distribution network topologies (rural and urban networks) to identify the need and the cost of network reinforcement required to accommodate future load under various operating strategies such as Business as Usual (passive demand and passive network) against the smart grid approach. Applications of smart Plug-in vehicle (PiV) charging, smart heat pumps, and optimised control of network voltage regulators to reduce network investment have been studied, and selected key results of our studies on evaluating the benefits of implementing these technologies for Great Britain’s distribution networks are presented and discussed in this paper.
&2012 Elsevier Ltd. All rights reserved.
1. Introduction
In its development of a sustainable energy system, the UK government has set a clear target in its Renewable Energy Strategy (RES) (The UK HM Government, 2009) that by 2020, more than 35% of the UK electricity demand will be met by renewable generation and the electricity sector would be almost entirely decarbonised by 2030. Reduction of greenhouse gas emissions from other energy sectors can also be achieved by
switching from fossil fuels used in transport and for heating towards electricity supplied by renewable and low-carbon elec-tricity generators. However, this electrification may potentially act as a significant driver for an increase in peak demand that is disproportionately higher than the increase in energy consump-tion. This will have negative impacts on the electricity system as it increases demand for more generation and network capacity with low utilisation levels. In order to alleviate these negative impacts of the electrification, there are unprecedented opportu-nities for improving energy efficiency and utilising demand-side response facilitated by inherent storage capabilities present in electric car batteries and thermal storage associated with build-ings, not only to optimise electricity production capacity but also to enhance the efficient provision of network capacity.
Contents lists available atSciVerse ScienceDirect
journal homepage:www.elsevier.com/locate/enpol
Energy Policy
0301-4215/$ - see front matter&2012 Elsevier Ltd. All rights reserved. http://dx.doi.org/10.1016/j.enpol.2012.05.021
n
Corresponding author. Tel.:þ442075946108.
E-mail address:d.pudjianto@imperial.ac.uk (D. Pudjianto).
1
Tel.:þ6065552345.
2Tel.:
However, delivering the carbon reduction targets cost-effec-tively through demand-side response optimisation will require a fundamental shift from a passive to an active philosophy of network control in addition to social behavioural changes. This shift, enabled by the incorporation of demand response into system operation and design, can be facilitated by the application of a smart metering system supported by an appropriate informa-tion, communication and control infrastructure. Development of such a system has to be facilitated and stimulated by appropriate government policies that remove barriers for the development and deployment of such technologies.
Our analysis demonstrates that optimising responsive demand has the potential to reduce considerably the system peak demand and subsequently, the need for system reinforcement. In the UK, full penetration of Electric Vehicles (EVs) and Heat Pumps (HPs) could increase the present daily electricity consumption by about 50%, while doubling the system peak. By optimising demand response the increase in the peak demand could be restricted to only 29%, resulting in massively improved utilisation of genera-tion and network capacity, and significantly reduced network investment. At the local distribution network level, which is the focus of this study, significant benefits of optimising demand response in relation to the network capacity are observed even for very low levels of penetration of electric vehicles and heat pumps. In order to understand how the impact of increased electricity load in the future can be evaluated, we present and discuss our modelling approach of electric vehicles and domestic heat pumps inSection 2, followed by our modelling framework for distribu-tion networks in Section 3. Section 4 presents a range of numerical studies evaluating the impact of demand projection scenarios elaborated in three Transition Pathways on the UK distribution networks, and quantifying the value of various applications of smart control in reducing the network reinforce-ment cost required to accommodate the additional future loads. Finally, our conclusion is presented inSection 5.
2. Modelling of smart electrical demand
2.1. Modelling of electricity demand of electric vehicles
Electric vehicles are widely seen as one of the key policy instruments to enable shifting of transport demand from fossil fuels to the electricity sector that relies on renewable and low-carbon electricity generators. For the purpose of this study, a detailed National Transport Survey3(NTS) database is used. Data extracted from the NTS database contains detailed information on all journeys conducted by light vehicles including starts and ends of individual journeys grouped according to distances travelled. The NTS data is classified into 12 distance bands (e.g., less than 1 mile, 1 to 2 miles, 2 to 3 miles etc.). A small sample of the data set is presented inTable 1.
Based on these records, approximately 67.4 million journeys are undertaken daily on average, by around 34.2 million vehicles (i.e., on average, each car undertakes approximately two journeys per day). Based on the NTS data, each pattern of journeys is characterised by the number of vehicles involved along with start and end times of each journey, as well as the energy needed for each journey. The database created for the assessment under-taken in this study contains approximately 44,000 different combinations of journeys.
With driving behaviour data prepared in this fashion, with an average of approximately two journeys carried out by each car per day, optimisation of alternative charging strategies has been formulated, specifying the energy consumed during the journey together with the times when vehicles are stationary and possibly connected to the electricity system. Our simulation/optimisation algorithms ensure that the state of charge of batteries would not compromise the ability of vehicles to carry out their intended journeys. In this exercise we assume 6 kW as the maximum power for charging EV batteries and each vehicle has a battery large enough to supply their daily energy requirement.
EV loads are particularly well placed to support network operation: given their relatively modest amount of energy required; the short driving times generally associated with small passenger vehicles (vehicles are stationary on average for 90% of the time); and given that the batteries have relatively high power ratings. Clearly, there is considerable flexibility regarding the time when the vehicles can be charged (providing the availability of charging infrastructure) and this can provide significant benefits both to the operation of distribution and transmission networks and to the efficient dispatch and utilisation of generation. In this work we have not explicitly considered vehicle-to-grid applica-tions (discharging car batteries to support the grid4).
2.2. Modelling of domestic electric heat pumps
The heat sector is another area that has significant potential for decarbonising, both through replacing older gas-fired, and especially oil-fired or LPG-based domestic heating with electri-city-based heating provided by electric heat pumps (HP), and by using heat pumps as a low-carbon space heating option for new housing (included for example in the construction of ‘Zero Carbon Homes’ starting from year 2016).
[image:2.595.313.562.80.243.2]The UK residential heating market consists of approximately 26 million dwellings, with annual thermal demand typically in the range between 10,000 and 30,000 kW h (thermal), which is used for providing space heating and domestic hot water require-ments. The data associated with the operation of heat pumps used in this work were derived from empirical studies and field trials of micro-CHP and boiler systems conducted by the (Carbon Trust, 2007).
Table 1
Driving patterns data.
Start time End time Distance band No. of journeys (daily) 00:00–00:59 00:00–00:59 Under 1 mile 6,922 00:00–00:59 00:00–00:59 1 to under 2 miles 15,987 00:00–00:59 00:00–00:59 2 to under 3 miles 14,848
y y y
00:00–00:59 01:00–01:59 2 to under 3 miles 1,277 00:00–00:59 01:00–01:59 3 to under 5 miles 4,938 00:00–00:59 01:00–01:59 5 to under 10 miles 3,209
y y y
00:00–00:59 02:00–02:59 50 to under 100 miles 474 00:00–00:59 03:00–03:59 100 to under 200 miles 492 00:00–00:59 04:00–04:59 200 miles and over 388
y y y
23:00–2359 23:00–23:59 25 to under 35 miles 7,750 23:00–2359 23:00–23:59 35 to under 50 miles 1,458 23:00–2359 23:00–23:59 50 to under 100 miles 923
3
National Travel Survey Database 2008,Department for Transport, UK, 2008,
http://www.dft.gov.uk/.
4
InFig. 1below, an electricity demand profile is presented for an individual heat pump, mimicking the operation of a boiler or a micro-CHP. The Figure also presents the aggregate demand of all 21 different HPs covered by the trials, with hourly time resolu-tion, with ratings of heat pumps given in Table 2. A single-dwelling heat pump profile represents a typical operation pattern with distinct on and off operation of the heating system with time-driven control. Our model can take into account the improvements in energy efficiency and different insulation levels in dwellings heated by HPs.
The heat demand of an average UK dwelling under the cold weather conditions is evaluated in order to assess the impact of heat pumps on the electricity system. Under a full penetration of heat, the additional electrical load could reach about 45 GW which could coincide with the existing system peak. In terms of energy consumption, the aggregate daily demand of all heat pumps for a cold winter day would be around 460 GW h, representing more than 40% of the existing winter daily demand. Given the characteristics and constraints of heat pumps (i.e., low-temperature operation and reduced rate of heat delivery), a heat pump-based system could be accompanied with thermal storage in order to be able to follow heat requirements more closely with lower ratings. This would potentially lead to a more continuous and smoother operation of heat pumps, the impact of which is considered in this work. Heat storage will also provide an opportunity to optimise heat pump operation, not only to meet local heat requirements, but also to contribute to grid manage-ment or support the integration of renewable and less flexible low-carbon electricity generation. Although there are a number of options available, it is still uncertain what type and capacity of heat storage might be cost-effective. Our analysis suggests that heat storage of the capacity of less than 25% of daily heat demand would be sufficient for flattening of national daily demand profile in the case of full penetration of EVs and HPs while taking into account efficiency losses that might accompany the process of storing heat.
2.3. Impact of electrification of heat and transport on electricity demand
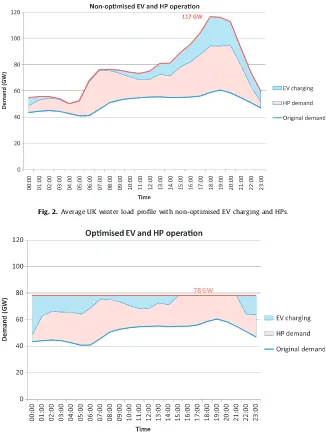
Fig. 2 illustrates the electricity demand profile for a cold winter day. This assumes non-optimised (no smart control and demand response) business-as-usual (BaU) system operation with incorporated heat sector and transport sector with charging points at residential dwellings. As peak demands of electrified heat and EV charging coincide with original system peak, it almost doubles the total peak demand while the increase in energy consumption is only about 50%.
In contrast to Fig. 2 above, Fig. 3 illustrates the effect of optimising EV charging and HP operation to minimise peak demand. Combined optimisation of EV and HP loads can take advantage of the complementarity between smart demand pro-files of EVs and HPs. In other words, domestic HP heat demand is predominantly day-time biased in comparison to ‘at home’ char-ging of EVs being predominantly night-time biased to enhance the utilisation of electricity infrastructure.
It is important to note that there will be significant interaction between the optimised demand responses of transport and heat sectors. In the case with heat pumps only, we observe that a significant amount of heat-related load would be shifted to the night period. On the other hand, in the combined optimisation with HPs and EVs, electric vehicle demand is shifted to the night while HP loading is only slightly modified from its original profile. This is because shifting HP loads through heat storage will incur energy losses and hence the optimisation would first make use of flexible EV loads while minimising the need to shift HP loads to achieve a more even load profile (which could be accomplished with limited heat storage). This demonstrates the need for a whole system approach when analysing the impact of heat pumps on the electricity system. Clearly, the load impact of electrifying the heat sector can be mitigated by appropriately controlling loads due to electrification of the transport sector, and vice versa, and there are obviously synergies between the two demand categories that need to be given due consideration.
[image:3.595.132.455.59.258.2]Coordinated management of responsive demand makes it possible to significantly reduce system peaks. In the business-as-usual case, as indicated inFig. 4, the energy input requirement of EVs and HPs would increase the energy demand by 52% compared with the original demand. At the same time, the system peak would almost double with a 92% increase (out of which 36% is contributed by EVs, and 56% by HPs). In a jointly optimised case
Fig. 1.Demand profile of a heat pump following the operating pattern of a boiler and aggregate profile of HPs of 21 dwellings in hourly resolution.
Table 2
Distribution of ratings of heat pumps. HP rating (kW)
Ranges (kW) 2–3 3–4 4–6
[image:3.595.31.284.311.354.2](‘EV and HP’ inFig. 4) the peak increase is only 29% (for simplicity of presentation we ignore energy losses associated with heat storage that would accompany HP systems). This clearly has a very profound impact on the utilisation of generation and net-work capacity in the electricity system.
It is important to stress that the effect of disproportionately higher increase of peak demand over energy demand is magnified at the local distribution network level due to significantly lower load diversity. As illustrated in the examples, network peak demand could more than double for less than 30% increase in energy.
2.4. Modelling uncertainty of EV loads
Reduced load aggregation results in a loss of diversity. This can result in higher peak loads, but it also increases uncertainty. Monte Carlo simulation of EV charging has been undertaken at the University of Strathclyde to estimate the expected additional loads on distribution transformers. In contrast to the NTS data used in Section 2.1, Time-of-Use UK Survey 2000 (UKTUS) data have been used, with 10-min time resolution. Details are pre-sented in (Huang and Infield, 2010).
[image:4.595.139.465.55.491.2]An example of a group of 214 houses supplied by a single distribution transformer has been selected. An EV uptake of 10% has been assumed. With the small sample size involved, one can expected to observe considerable variations between individual Monte Carlo simulation runs. To identify the mean behaviour but
[image:4.595.141.468.284.491.2]Fig. 2.Average UK winter load profile with non-optimised EV charging and HPs.
Fig. 3.Average national load profile with optimised EV charging and HP operation.
[image:4.595.47.291.519.657.2]more importantly to gain an understanding of the uncertainties associated with the additional EV charging load, the simulation needs to be re-run a large number of times with different random number seeds. Reasonable convergence was achieved with 100 simulation runs. The distribution of EVs across the 214 houses was calculated only once for all the 100 simulation runs. The total of 30 EVs is consistent with the UK car ownership statistics.Fig. 5 shows a representative sample of 3 of the 100 Monte Carlo simulation runs; the solid line shows the mean charging load as a function of time of day.
The simplest measure of the uncertainty associated with these values is provided by the standard deviation, which has been calculated from the 100 runs, again as a function of time of day. For the sample of 214 houses the maximum mean charging load occurred at 18.20 h and was 33.1 kW, with a standard deviation of 15.1 kW. Assuming that the error distribution is Gaussian, the 95% confidence interval is calculated to be between 3.4 kW and 62.7 kW. Therefore, in this simple example, the distribution transformer would need to be sized (for 95% confidence level) to be 62.7 kW larger than at present, in order to account for additional EV charging load. This value is equal to 29.5% of the existing domestic peak load and is thus not insignificant.
Fig. 6 combines the expected electricity load profile for a typical weekday with the expected EV charging load and its uncertainty, as described by the 95% confidence interval. This
shows that the maximum likely additional load at the relatively low EV penetration of 10% is significant as a proportion of the conventional domestic peak demand, and that both of these occur at almost exactly the same time of day.
3. Distribution network modelling
In order to evaluate the impact of increased penetration of electric vehicles and heat pumps, as modelled inSection 2, in the UK electric power distribution networks, we use a set of repre-sentative network models in order to take account different network characteristics. Representative generic UK distribution network models have been created using well-established fractal distribution network design tools described inGreen et al. (1999) and Gan et al. (2009). Networks at different voltage levels are designed in a hierarchical bottom-up approach, starting from 0.4 kV Low Voltage (LV) system, then 11 kV High Voltage (HV) system and proceeding up to 33 kV and above of Extra High Voltage (EHV) system, as shown inFig. 7.
The details of the steps are as follows:
In the first step, a network topology at the LV level is built. Different consumer settlements (e.g., urban, rural, semi-urban, etc.) are created based on the concept of fractal theory. Locations of distribution transformers, as sources of supply to LV networks, are at the centre of load clusters, following general design principles aimed at minimising the cost of installed equipment, losses and voltage drops.
Annual demand profile is also created reflecting the mix of customer types (domestic, commercial, industrial) and energy consumption. For the studies carried out in this paper, we have developed two representative LV networks. One is for an urban system and another is for a rural system. These are shown in Fig. 8. The key design characteristics of the representative net-works are comparable with those of real distribution netnet-works of similar topologies, particularly in terms of ratings of feeders and transformers used and associated network lengths.
[image:5.595.36.282.337.503.2]Starting from the network topology from Step 1 as an input, year-round AC load flow calculations are performed. These are aimed at calculating relevant entries, such as branch currents, losses, voltage drops, and so on. These entries are then used to design the network circuits based on a minimum life-cycle cost approach, satisfying the ER P2/6 design standard. In addition,
[image:5.595.302.551.515.720.2]Fig. 5.Example results of 100 runs of Monte Carlo simulation for EV charging demand for 214 houses with 10% EV take-up.
Fig. 6.Expected original load profile and EV charging load with its upper 95% confidence limit.
Start
Fractal LV network creation Consumer load
characteristics (density and distribution)
LV analysis and network sizing Technical and cost characteristics
of LV circuits and transformers, and cost of electricity
Fractal HV distribution network creation
Analysis and sizing of HV distribution network
Modelling, analysis and sizing of EHV network
Stop Different types of LV
networks
Technical and cost characteristics of HV distribution circuits and
transformers, and cost of electricity
Technical and cost characteristics of EHV circuits and transformers,
and cost of electricity
[image:5.595.37.282.549.722.2]based on topology and life-cycle cost information, the optimal sizing of transformers and circuits is carried out (Gan et al., 2011). In the third step, an interconnection HV grid-matrix, also based on a fractal model, is created in order to populate an HV distribution network using LV networks generated in Step 1. Notably, different types of LV networks can be interconnected through the matrix, with different overall characteristics, such as rural or urban networks, different load densities, different con-sumer density, and so on. Hence, realistic HV distribution net-work models can be created, with their characteristics modulated by tuning the HV grid-matrix parameters.
Step 4 is similar to step 2, but it is applied to HV distribution network. The relevant loading is taken from constituents LV sub-networks.
The EHV network is addressed as a simplified model that connects different HV distribution networks generated in Step 3 and Step 4. The relevant EHV module loading comes from HV distribution modules, thereby completing the overall hierarchical model.
The model also optimises substation locations, transformer ratings, and cable ratings (for underground/overhead lines). The model will evaluate the maximum voltage drop and fault level and re-design the network optimally by choosing appropriate network circuits/components in a cost-effective manner to miti-gate voltage problems and excessive fault level in any operating conditions across a 1-year time horizon. Design of the networks follows the principles set up by the Engineering Recommendation P2/6 (Energy Networks Association, 2006) and therefore it satis-fies the security criteria.
Using the proposed methodology, a number of network designs and control strategies can be tested on a range of network models. In the following section, we use the developed optimisa-tion models of smart electrical demand (EVs and HPs) and distribution network models, described previously in Sections 2 and 3, to evaluate the electrification driven network reinforce-ment cost in the UK.
4. Evaluating the impact of future load growth and values of smart control on distribution networks in the UK
Most of today’s electricity distribution networks in European countries including the UK were developed about 50 years ago to meet the fast growing industrialisation needs during that time. Much of the ageing equipment in the network infrastructure is now approaching the end of their service life and will eventually need to be replaced [Lakervi and Holmes, 1995]. In light of this,
Distribution Network Operators (DNOs) in the UK have already started to invest in network replacement projects and this investment is expected to continue and increase over the next decade. However, in order to devise appropriate network devel-opment strategies, it is important to understand the impact of a range of plausible pathways that affect distribution networks in various timescales in the future.
In this paper, we use the three projected demand scenarios developed in the Transition Pathways project. The project is an ongoing research effort that develops and analyses a set of transition pathways to a highly electric, low-carbon UK energy system (Foxon et al., 2008, 2009, 2010) driven by the UK Government’s target of reducing UK carbon emissions by 80% by 2050 (HM Government, 2009). The research is funded by the UK Engineering and Physical Sciences Research Council and the electricity utility E.ON UK, and involves a consortium of research-ers from UK univresearch-ersities. The consortium has identified three key transition pathways scenarios, namely ‘‘Market Rules’’ (MR), ‘‘Central Coordination’’ (CC), and ‘‘Thousand Flowers’’ (TF). The characteristics of each scenario can be described briefly as follows:
– Market Rules: this envisions the broad continuation of the
current market-led governance pattern, in which the govern-ment specifies the high level goals of the system and sets up the broad institutional structures, in an approach based on minimal possible interference in market arrangements.
– Central Co-ordination: this envisions greater direct
governmen-tal involvement in the governance of energy systems and the pursuit of low-carbon energy, applying some of the principles of transition management.
– Thousand Flowers: this envisions a sharper focus on more local,
bottom-up diverse solutions (‘let a thousand flowers bloom’), driven by innovative local authorities and citizens groups, such as the Transition Towns movement, to develop local micro-grids and energy service companies.
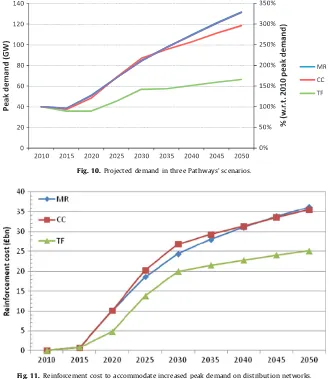
In all three transition pathways the consortium assumed a highly electric future, in which there will be a significant penetration of both electric heating and electric vehicles by 2050. The three pathways scenarios are illustrated inFig. 9.
[image:6.595.142.466.59.225.2]The impact of the Pathways’ scenarios on peak electricity demand is assessed taking into account hourly demand profiles for different mixes and types of electricity loads. The results of our analysis are summarised inFig. 10, which shows that the peak demand for electricity can increase by more than three times. For
the MR and CC pathways the trend of peak demand increase is similar, while TF has a lower impact on the peak demand growth since it is characterised by a relatively low heating demand as a result of more aggressive improvements in energy efficiency and house insulation.
Using the distribution network design tool described in Section 3and our estimated number of rural and urban distribu-tion networks in the UK, we analysed the cost of distribudistribu-tion network reinforcement to accommodate the future load. The level of network reinforcement required under different levels of penetration of new loads will be driven by both thermal ratings of equipment and network voltage constraints considering the requirements imposed by network design standards. Our analysis suggests that if we maintain passive distribution networks and passive demand response (Business-as-Usual—BaU), the cost of reinforcing UK distribution networks following the three Path-ways scenarios can reach up to £36bn (in real terms) across the 40-year period from 2010 to 2050. As MR and CC have similar
increased peak demand patterns, the reinforcement costs for these two pathways are similar, while TF has a lower, but still significant reinforcement cost. The results of our analysis are summarised inFig. 11.
In order to reduce this plausible future cost, technologies such as smart charging, smart appliances, and heat storage can be used to minimise the aggregate peak demand. In this paper, we focus on the applications of smart EV charging and heat pumps. In addition, we also analysed the applications of voltage regulators (VR) in active distribution network as we observe that in most cases the main driver for distribution network reinforcement is avoiding voltage violation. The results of our studies for the Market Rules scenario are presented in Fig. 12. The cost does not include the cost of intelligent infrastructure required to enable smart control.
[image:7.595.131.458.57.521.2]The results show that a combined application of EV smart charging and control of HP can further reduce the need for network reinforcement, producing higher cost savings compared
to individual EV and HP applications. This requires a coordinated system approach that can be facilitated by smart-grid technolo-gies. The cost savings can be up to around £10bn across 40 years. We also observe that the benefit of implementing active network with voltage regulator is significant. It reduces the cost by almost 66% compared to the Business as Usual approach (passive demand and passive network).
Fig. 13 shows the reinforcement cost under BaU and Smart control approaches for all of the three analysed pathways. Cost savings contributed by the application of combined control of smart EV charging, HP and VR (referred to as ‘‘Smart’’) are significant and should be pursued to minimise the cost of electrification of the UK transport fleet and heating in the future. The value of smart control in the UK system will be around
[image:8.595.138.467.58.437.2]Fig. 10. Projected demand in three Pathways’ scenarios.
[image:8.595.141.467.462.640.2]Fig. 11. Reinforcement cost to accommodate increased peak demand on distribution networks.
£20–25bn across 40 years (2010 to 2050). Appropriate policies and regulatory frameworks should be developed and formulated as soon as possible to facilitate an early deployment of such technologies. Our analysis of the three pathways suggests that significant reinforcement will be required starting from 2020 if we maintain the Business-as-Usual approach.
It is also important to reiterate that this study has not taken account of the need for additional, or reinforced, transmission network and generation infrastructure that would arise from a continued BaU approach. It follows that in practice there could be significant further cost savings associated with the ‘‘Smart’’ solution.
5. Conclusions
In all three transition pathway scenarios, namely ‘‘Market Rules’’ (MR), ‘‘Central Coordination’’ (CC), and ‘‘Thousand Flow-ers’’ (TF) the growth of both electric heating and electric vehicles up to 2050 is envisaged to be significant. Our analysis suggests that this will increase the electricity peak demand on the UK distribution networks up to 2–3 times compared to the present peak demand. Consequently, massive distribution network rein-forcement will be required, costing up to £36bn across the period 2010–2050 if we maintain passive distribution network and passive demand approaches. On the other hand, a coordinated application of smart demand technologies such as smart EV charging, smart HP control and active distribution network technologies with the use of voltage regulators can significantly reduce this cost. Appropriate policies and regulatory frameworks should be developed and devised as early as possible to facilitate the development and timely deployment of such technologies. In particular, network planning and design standards need to be revised, so that distribution network operators are able to simultaneously take into account the contribution of new flexible demand categories when making reinforcement decisions. In the current regulatory framework which typically remunerates asset-based network reinforcement, DNOs are not incentivised to take advantage of smart control solutions as an alternative to strength-ening the grid. This approach may turn out be much more costly
than alternative smart approaches, as our analysis of the three pathway scenarios suggests that significant reinforcement will be required starting from 2020 if we maintain the Business-as-Usual approach.
Acknowledgement
The authors gratefully acknowledge the support and funding from UK Engineering and Physical Sciences Research Council and the electricity utility E.ON UK.
References
C.K. Gan, N. Silva, D. Pudjianto, G. Strbac, R. Ferris, I. Foster, M. Aten, 2009. Evaluation of alternative distribution network design strategies. Proceedings 20th International Conference and Exhibition on Electricity Distribution. Gan, C.K., Mancarella, P., Pudjianto, D., Strbac, G., 2011. Statistical appraisal of
economic design strategies of LV distribution networks,. Electric Power Systems Research 81, 1363–1372.
Carbon Trust, 2007. Micro-CHP Accelerator Interim Report.
Lakervi, E., Holmes, E.J., 1995. Electricity Distribution Network Design. Peter Peregrinus, England 1995.
Energy Networks Association, 2006. Engineering Recommendation P2/6, Security of Supply.
Foxon, T.J., Hammond, G.P., Pearson, P.J., 2010. Developing transition pathways for a low carbon electricity system in the UK. Technological Forecasting and Social Change 77, 1203–1213.
Foxon, T.J., Hammond, G.P., Pearson, P.J., Burgess, J.. Hargreaves, T., 2009. Transi-tion pathways for a UK low carbon energy system: exploring different governance patterns’, Paper for 1st European Conference on Sustainability Transitions: Dynamics and Governance of Transitions to Sustainability, Amsterdam, The Netherlands, 4–5 June 2009.
Green, J.P., Smith, S.A., Strbac, G., 1999. Evaluation of electricity distribution system design strategies. IEE Proc. Generation, Transmission and Distribution 146 (1), 53–60.
S. Huang, D. Infield, 2010. The impact of domestic Plug-in Hybrid Electric Vehicles on power distribution system loads, in Power System Technology (POWER-CON), 2010 International Conference on, pp. 1–7.
The UK HM Government, 2009. The UK Renewable Energy Strategy.
Timothy J. Foxon, Geoffrey P. Hammond, Peter J. Pearson, 2008. Transition pathways for a low carbon energy system in the UK: assessing the compat-ibility of large-scale and small-scale options. Paper for 7th BIEE Academic Conference, St Johns College, Oxford, 24–25 September 2008.
[image:9.595.132.456.57.232.2]Vehicle Licensing Statistics, 2008. National Statistics Bulletin, Department for Transport, UK.