Title: Evaluation of nucleosome forming potentials (NFPs) of
forensically important STRs
Authors: Phuvadol Thanakiatkrai, Lindsey Welch
Address: Centre for Forensic Science, University of Strathclyde, 204 George Street, Glasgow, United Kingdom, G1 1XW
Tel: +441415484519, Fax: +441415482532, [email protected],
Abstract:
Keywords: nucleosome, nucleosome forming potential, nucleosome positioning signal, forensic, STR
Introduction:
Recent advancements in forensic DNA analysis have focused on improving analysis techniques, such as pyrosequencing [1], increased PCR cycles [2], post-PCR purification [3], and mini-STR designs [4]. These improvements have proved to be successful in obtaining better DNA profiles with degraded DNA samples often found in mass disasters and samples exposed to the environment. However, the intrinsic structural properties of DNA that might prevent its degradation have been overlooked. Using these structural properties as guidelines, forensic scientists might be able to choose the loci that can better withstand degradation and hence obtain more information from a degraded sample.
The binding of the octameric histone cores to 147 bp of DNA is a complex, multifactorial process that limits the interactions of DNA with other proteins. The formation and location of nucleosomes, the association of DNA with histones, are known to depend on the following factors: dinucleotide periodicity, base stacking, GC content, and chromatin remodelers [5-16]. It has been shown that certain properties, such as low deformation energy [17] and periodicity repeats of GG/CC dinucleotides [9], favor nucleosome formation. They are called “nucleosome positioning signals” [11].
human genome annotation for nucleosome exclusion regions also showed that regions free of nucleosomes correlated well with DNase I hypersensitive sites, from which an inference can be made that DNA bound in the nucleosomes could be protected against DNases [20].
The in silico study presented here was carried out to evaluate the “nucleosome forming potentials” (NFPs) (how likely it is for a certain sequence of DNA to be bound by nucleosomes) of 60 forensically important markers (58 STRs plus amelogenin X and Y). After analysis of the softwares available, we explored two nucleosome positioning signals – DNA bendability based on known stiff sequences and dinucleotide base stacking – via two freely available tools, NXSensor [21] and nuScore [22], respectively.
We hypothesized that some forensically important STR loci evaluated in this study may be more protected by nucleosomes than other loci. Determining which loci are protected could allow them to be incorporated into future forensic identification kits, resulting in a higher discrimination power for certain degraded sample types (saliva, bone, and decomposed remains) than with current profiling methods.
Materials and methods:
Selecting
markers
and
obtaining
base
sequences
Fifty-eight STR markers and amelogenin X and Y, totalling 60 markers (Table 1), were selected based on their past use and current recommendations by the forensic community. Sequences were obtained from the NCBI Human Genome Map (http://www.ncbi.nlm.nih.gov/genome/guide/human/). These sequences were center-aligned at the tandem repeat units and truncated for 200 bp at both the 5’ and 3’ end, yielding a sequence of 400 bases.
NXSensor
mechanisms
and
parameters
All 60 markers were evaluated and accessibility scores were given as a measure of how accessible the input sequence was to DNA-binding proteins. The score was calculated using the following formula:
A
=
L
o
≥
OS
min
L
i
−
L
a
(Equation 1)where A the accessibility score; Lo the total length of open contiguous
segment; OSmin the minimum length of open segment; Li the length of input
sequence; and La the total length of ambiguous segments. An accessibility
score of 0 indicated the whole input sequence contains no sequence that inhibits nucleosome formation while a score of 1 indicated the whole sequence is open for access by proteins and is not bound as a nucleosome.
The default settings used were: 147 bp window size; minimum number of exclusion sequences considered significant = 1; and the minimum length of open segments = 10.
A marker was deemed to have a high NFP if the accessibility score was close to zero and a low NFP close to one.
NuScore
mechanisms
and
parameters
164 bp window size. Two output values - DNA deformation energy and nucleosome positioning score (NPScore) - were used in this study.
The DNA deformation energy measures the amount of energy required to impose the structure of the nucleosome bend onto the input sequence; whilst the NPScore shows the significance in deviation of the deformation energy at one point from its neighbouring positions. Supplementary materials from [22] used an NPScore threshold of less than or equal to -2 to indicate a possible nucleosome dyad location, and the same threshold was applied in this study. A more stringent threshold of -3 was evaluated in this study as well.
Comparisons of original base sequences with random arrangements
All 60 markers were compared with random sequences of the same dinucleotide content to determine if the positioning of the nucleosome dyad is dependent upon the specific arrangements of dinucleotides and their interactions. The number of locations with an NPScore more negative than two thresholds (-2 and -3) were counted and compared statistically.
A marker was deemed to have a high NFP when the locations of NPScore crossing the threshold (NPScore ≤ -2) were high and vice versa.
Results:
NXSensor
of the 60 markers (18.3%) contained short nucleotide sequences that were deemed “stiff” and were less probable to exist as nucleosomes. Their accessibility scores ranged from 0.028 to 0.098 (Figure 1).
NuScore
An example graphical output of an NPScore profile of D18S51 is shown in Figure 2a. The alternating high-low score seen in the figure was typical of every sequence. The minima signified locations where there was potential for a nucleosome dyad to exist. In this profile, a reference line is shown at -2, as suggested by [22]. Values below -2 and -3 were counted for each STR locus. All loci displayed at least one possible location for a nucleosome dyad (threshold of -2) in the 400 bases input (Table 2). The medians of possible nucleosome dyad locations were 7 and 1 for the threshold of -2 and -3 respectively, with standard deviations at 2.380 and 0.851. The markers with the highest potential dyad locations of 12 were D21S11 and D10S1435, meaning that these two loci were the most likely to be bound to nucleosomes.
Comparisons
of
original
base
sequences
with
random
arrangements
A set of 100 random sequences with the same dinucleotide composition was generated by the nuScore program for each marker. The number of possible dyad locations for both arrangements (original and random) and both thresholds (-2 and -3) are listed in Table 2. For example, using D18S51 as an input sequence, a random sequence profile was generated and displayed for direct comparison with the original profile (Figure 2b).
Statistical comparison of original and random configurations containing dyad locations with a threshold of -2 gave a p-value of 0.004, indicating a significant difference in the scores obtained from the two different configurations. When the threshold was set to -3, no significant difference was observed between the two configurations (p = 0.466). Due to the low number of positions crossing the threshold at -3 (Table 2), threshold -2 was chosen for further experiments.
Comparison of accessibility scores from NXSensor to threshold -2 and -3 scores for each STR locus yielded correlation coefficients of 0.024 and -0.13, respectively. This observation revealed that there was no linear correlation of accessibility scores to NPScores.
Discussion:
loci of the widely-used commercials kits do not generally go beyond this size, albeit with a few exceptions, such as Penta E of PowerPlex® 16 (size range 379 to 474 bp) [24]. In addition, most STRs in current use do not have repeat units (without the flanking regions) that exceed 147 bp, which is equivalent to 36-37 repeat units for a tetranucleotide STR. The reason that amplicon lengths of commercial kits such as SGM Plus™ extend much greater than the repeat unit size is because of the flanking regions for convenient primer design and multiplexing. Hence, using mini-STR primers as shown in [25] as an example, the actual amplicon length of the markers can be reduced to less than the nucleosomal protection size of 147 bp.
Given that STRs have varying number of repeats depending on each individual and that our methods center-aligned the sequence, the flanking regions will change accordingly with each allele. This could have an effect on the NFPs. However, center-aligning the sequences was deemed important because, in theory, the closer the nucleosome dyad is to the center of the repeat units, the higher the chance that the primer binding sites and the repeat units would remain intact after DNA degradation (due to nucleosome protection) and that successful PCR amplification could occur.
correct, the ten loci with accessibility scores of more than 0 should exhibit properties associated with degraded DNA and/or low-template DNA amplification [2] while these effects should be dampened with the other 49 loci.
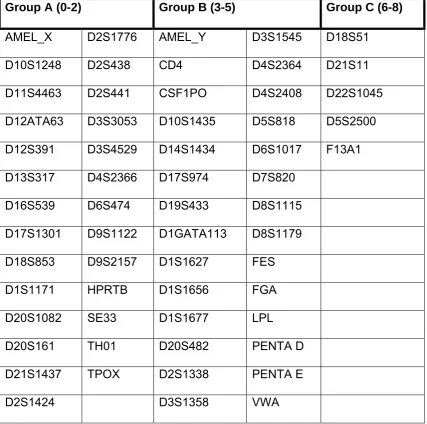
The nuScore results showing at least one potential nucleosome dyad location (NPScore ≤ -2) within the 400 bp of each marker were expected. Nucleosomes serve to facilitate compacting of the chromatin for higher order structure [14] and, as a nucleosome binds approximately 147 bp of DNA, at least one dyad should be seen in a sequence as long as 400 bp. The core 100 bp was more important as discussed above and was used to categorize the STR loci. The markers in group A and group C could be targeted for further empirical comparisons for evidence that may validate the protective capabilities of nucleosomes on STR loci.
The numbers of possible dyad location of the 60 markers in their original arrangements were compared to those of the random arrangements in order to determine if these locations are influenced by the specific arrangement of dinucleotides and their interactions. The change in the locations of the minima (Figure 2) and the statistical differences between the two suggest that both the numbers of possible dyad locations and the positions they might take up depend on the arrangement of the bases and not the nucleotide content.
sequence. Nucleosome binding and attraction is a multifactorial event, with commonly known variables being dinucleotide periodicity and stacking, GC content and chromatin remodelers [9, 11-13, 15, 20, 26]. Since this attraction depends on more than one single factor, a significant difference might not be observed when only one or two factors are considered as in our study. Furthermore, these signals only indicate the probability of finding a nucleosome at a given location and not experimentally mapped nucleosome positions. Therefore further experiments using artificial degradation of saliva samples are being carried out to validate our in silico findings.
Also, all the STR loci evaluated in these studies, with the exception of amelogenin, were located within an intron or intergenic region. Our findings agree with Vinogradov [27], who showed that these regions are enriched with NFPs because they do not have to be regulated, transcribed (for intergenic STRs), or translated (for intron STRs). Therefore they are less likely to be accessed by proteins.
Other nucleosome prediction programs are also available online for research use. The most recent program released in December 2009 is “FineStr” (http://www.cs.bgu.ac.il/~nucleom/) [28], which is based on Caenorhabditis elegans universal nucleosome positioning pattern [29, 30]. Another
Conclusion:
Assessment of NFPs of forensically important STRs could be beneficial as nucleosome-bound DNA is less likely to degrade due to being in the ‘bound configuration’. Our findings show that most STR loci in use nowadays are already somewhat protected from degradation by nucleosomes. Selecting the loci with stronger attraction to nucleosomes for a multiplex could increase the chance of obtaining a better balanced profile with fewer allelic drop-outs. Further work using time-series degraded saliva samples will be employed to empirically determine the differences between bound and unbound STRs under in vitro conditions.
References:
1. D. Anna-Maria, E. Hanna and A. Marie, Forensic analysis of autosomal STR markers using Pyrosequencing. Forensic Sci. Int. Genet. 4 (2010) 122-129.
2. P. Gill, J. Whitaker, C. Flaxman, N. Brown and J. Buckleton, An investigation of the rigor of interpretation rules for STRs derived from less than 100 pg of DNA. Forensic Sci. Int. 112 (2000) 17-40.
3. P. J. Smith and J. Ballantyne, Simplified low-copy-number DNA analysis by post-PCR purification. J. Forensic Sci. 52 (2007) 820-829. 4. J. M. Butler, Y. Shen and B. R. Mccord, The development of reduced
size STR amplicons as tools for analysis of degraded DNA. J. Forensic Sci. 48 (2003) 1054-1064.
5. S. Ercan and J. D. Lieb, New evidence that DNA encodes its packaging. Nat. Genet. 38 (2006) 1104-1105.
6. I. Ioshikhes, A. Bolshoy, K. Derenshteyn, M. Borodovsky and E. N. Trifonov, Nucleosome DNA sequence pattern revealed by multiple alignment of experimentally mapped sequences. J. Mol. Biol. 262 (1996) 129-139.
7. I. P. Ioshikhes, I. Albert, S. J. Zanton and B. F. Pugh, Nucleosome positions predicted through comparative genomics. Nat. Genet. 38 (2006) 1210-1215.
8. R. Kiyama and E. N. Trifonov, What positions nucleosomes?--A model. FEBS Lett. 523 (2002) 7-11.
10. P. T. Lowary and J. Widom, New DNA sequence rules for high affinity binding to histone octamer and sequence-directed nucleosome positioning. J. Mol. Biol. 276 (1998) 19-42.
11. H. E. Peckham, R. E. Thurman, Y. Fu, J. A. Stamatoyannopoulos, W. S. Noble, K. Struhl and Z. Weng, Nucleosome positioning signals in genomic DNA. Genome Res. 17 (2007) 1170-1177.
12. O. J. Rando and K. Ahmad, Rules and regulation in the primary structure of chromatin. Curr. Opin. Cell Biol. 19 (2007) 250-256.
13. E. Segal, Y. Fondufe-Mittendorf, L. Chen, A. Thastrom, Y. Field, I. K. Moore, J. P. Wang and J. Widom, A genomic code for nucleosome positioning. Nature 442 (2006) 772-778.
14. R. D. Kornberg and Y. Lorch, Twenty-five years of the nucleosome, fundamental particle of the eukaryote chromosome. Cell 98 (1999) 285-294.
15. G. C. Yuan, Y. J. Liu, M. F. Dion, M. D. Slack, L. F. Wu, S. J. Altschuler and O. J. Rando, Genome-scale identification of nucleosome positions in S. cerevisiae. Science 309 (2005) 626-630.
16. T. Bettecken and E. N. Trifonov, Repertoires of the nucleosome-positioning dinucleotides. PLoS ONE 4 (2009) e7654.
17. A. A. Travers, The structural basis of DNA flexibility. Philosophical Transactions of the Royal Society of London. Series A: Mathematical, Physical and Engineering Sciences 362 (2004) 1423-1438.
18. L. A. Dixon, C. M. Murray, E. J. Archer, A. E. Dobbins, P. Koumi and P. Gill, Validation of a 21-locus autosomal SNP multiplex for forensic identification purposes. Forensic Sci. Int. 154 (2005) 62-77.
19. L. A. Dixon, A. E. Dobbins, H. K. Pulker, J. M. Butler, P. M. Vallone, M. D. Coble, W. Parson, B. Berger, P. Grubwieser, H. S. Mogensen, N. Morling, K. Nielsen, J. J. Sanchez, E. Petkovski, A. Carracedo, P. Sanchez-Diz, E. Ramos-Luis, M. Brion, J. A. Irwin, R. S. Just, O. Loreille, T. J. Parsons, D. Syndercombe-Court, H. Schmitter, B. Stradmann-Bellinghausen, K. Bender and P. Gill, Analysis of artificially degraded DNA using STRs and SNPs--results of a collaborative European (EDNAP) exercise. Forensic Sci. Int. 164 (2006) 33-44.
20. A. Radwan, A. Younis, P. Luykx and S. Khuri, Prediction and analysis of nucleosome exclusion regions in the human genome. BMC Genomics 9 (2008) 186-186.
21. P. Luykx, I. V. Bajic and S. Khuri, NXSensor web tool for evaluating DNA for nucleosome exclusion sequences and accessibility to binding factors. Nucleic Acids Res. 34 (2006) W560-565.
22. M. Y. Tolstorukov, V. Choudhary, W. K. Olson, V. B. Zhurkin and P. J. Park, nuScore: a web-interface for nucleosome positioning predictions. Bioinformatics 24 (2008) 1456-1458.
23. R. E. Dickerson, Definitions and nomenclature of nucleic acid structure parameters. J. Biomol. Struct. Dyn. 6 (1989) 627-634.
24. Technical Manual: PowerPlex® 16 System #TMD012, Promega Corporation, 2008.
26. E. N. Trifonov, Curved DNA. CRC Crit. Rev. Biochem. 19 (1985) 89-106.
27. A. E. Vinogradov, Noncoding DNA, isochores and gene expression: nucleosome formation potential. Nucleic Acids Res. 33 (2005) 559-563. 28. I. Gabdank, D. Barash and E. N. Trifonov, FineStr : a web server for
single-base-resolution nucleosome positioning. Bioinformatics (2010) btq030.
29. E. N. Trifonov, Nucleosome positioning by sequence, state of the art and apparent finale. J. Biomol. Struct. Dyn. 27 (2010) 741-746.
30. E. N. Trifonov, Base pair stacking in nucleosome DNA and bendability sequence pattern. J. Theor. Biol. 263 (2010) 337-339.
Figures:
Figure 1.
Figure 2.
Table 1. The 58 STR markers plus amelogenin X and Y, their GenBank accession number and chromosomal position in the latest human GRCh37 assembly.
Table 2. Number of possible locations for a nucleosome dyad with the threshold of -2 and -3 for the 60 markers tested. Original (Ori) and random (Ran) indicate the arrangement of the base sequences. Original arrangement is found in a human genome and random is the same dinucleotides arbitrarily rearranged. The table is arranged in descending order of possible locations for Ori in threshold -2.
Marker
Threshold -2
Threshold
-3 Marker
Threshold -2
Threshold -3
Ori Ran Ori Ran Ori Ran Ori Ran
D10S1435 12 4 0 2 D19S433 7 8 1 2
D21S11 12 5 1 0 D1S1677 7 6 1 1
CD4 11 8 1 1 D4S2408 7 12 0 2
D5S2500 11 8 1 2 D5S818 7 7 0 0
F13A1 11 4 1 0 D8S1115 7 5 0 1
D12ATA63 10 7 0 1 D12S391 6 7 1 1
D1S1627 10 7 2 1 D14S1434 6 5 2 1
D1S1656 10 5 2 1 D17S1301 6 6 2 0
D2S1338 10 4 0 0 D1S1171 6 6 1 1
D7S820 10 5 1 1 D21S1437 6 7 0 1
PENTA E 10 8 1 1 D2S441 6 4 0 1
CSF1PO 9 1 0 0 D3S3053 6 4 0 0
D3S1545 9 7 2 0 D6S474 6 1 1 0
D4S2364 9 4 2 0 D8S1179 6 2 0 0
FGA 9 4 2 1 PENTA D 6 8 0 1 VWA 9 5 0 2 TH01 6 6 2 0
AMEL_Y 8 9 2 0 D2S438 5 3 1 0
D18S51 8 8 3 1 D4S2366 5 8 0 1
D1GATA113 8 6 0 1 D9S1122 5 5 0 0
D20S1082 8 7 0 1 D9S2157 5 11 0 0
D20S482 8 7 0 0 HPRTB 5 2 0 1
D22S1045 8 6 3 0 TPOX 5 7 0 0
D3S1358 8 4 2 0 D17S974 4 5 1 0
D6S1017 8 6 1 1 D20S161 4 7 1 1
FES 8 3 1 0 D2S1776 4 7 0 1 LPL 8 4 1 1 D3S4529 4 8 0 1
AMEL_X 7 7 0 1 D13S317 3 3 0 1
D10S1248 7 9 0 1 D2S1424 3 8 1 1
D11S4463 7 6 1 1 D18S853 2 6 0 0
D16S539 7 5 1 0 SE33 2 7 0 0
Table 3. 60 markers divided into three groups according to the number of positions crossing the threshold of -2 at the central 100 bases (sorted in alphabetical order).
Group A (0-2) Group B (3-5) Group C (6-8)
AMEL_X D2S1776 AMEL_Y D3S1545 D18S51
D10S1248 D2S438 CD4 D4S2364 D21S11
D11S4463 D2S441 CSF1PO D4S2408 D22S1045
D12ATA63 D3S3053 D10S1435 D5S818 D5S2500
D12S391 D3S4529 D14S1434 D6S1017 F13A1
D13S317 D4S2366 D17S974 D7S820
D16S539 D6S474 D19S433 D8S1115 D17S1301 D9S1122 D1GATA113 D8S1179
D18S853 D9S2157 D1S1627 FES
D1S1171 HPRTB D1S1656 FGA
D20S1082 SE33 D1S1677 LPL
D20S161 TH01 D20S482 PENTA D
D21S1437 TPOX D2S1338 PENTA E