Visual estimation of joint angles at the elbow
Rashid Barakat Abu-Rajab · A. Marsh · D. Young · L. A. Rymaszewski
Abstract The aim of this study was to assess the accuracy of visual estimation of elbow joint angles. A total of 116 observers (93 doctors and 23 physiotherapists) were shown 21 digital images of two arms in predeWned degrees of elbow Xexion on two separate occasions. They estimated the angle of Xexion to the nearest 5°. Only 70.8% of esti-mates were within §5°, although intra-observer agreement was good among all groups tested (ICC range 0.963– 0.983). Orthopaedic consultants and registrars were equiva-lent and statistically better at estimating the angles com-pared to senior house oYcers and physiotherapists (P< 0.001). Compared to the angles of 85 and 90°, all other angles were signiWcantly less likely to be estimated to within §5° (P< 0.001). In conclusion, visual estimation of joint angles at the elbow may not be desirable in cases where accurate serial assessment is required for clinical decision making. The use of a goniometer by an agreed standardized protocol is advised.
Keywords Elbow · Visual estimation · Angles · Assessment
Introduction
The main function of the elbow joint is to position the hand in space. Morrey et al. [5] showed that the functional range of motion is approximately 30–130°. Accurate mea-surement of elbow Xexion/extension is therefore impor-tant to monitor disease progression and the response to treatment, as well to deWne the indications for surgery. Clinicians may be tempted to visually estimate these joint angles, although it is controversial whether this technique is reliable [1, 4, 7, 9, 10]. Goniometric readings at the elbow have been shown to have errors up to 6° [4]. Despite several studies reported in physiotherapy journals [4, 9, 10], only one paper has assessed orthopaedic sur-geons’ ability to accurately estimate joint angles [7], and this was not at the elbow. As this is common practice in orthopaedic clinics, the aim of this study was to determine whether visual estimation was an accurate method for assessing joint angles at the elbow.
Materials and methods
Two healthy volunteers, one overweight and one lean, were involved in the study. Each subjects’ upper limb was posi-tioned against a wooden board, and digital images were taken perpendicular to the board, with a camera mounted on a tripod (Fig.1). The forearm was placed in neutral rota-tion with the palm of the hand Xat on the board. The surface markings of the centre of the humeral head, the humeral lat-eral epicondyle (roughly the axis of elbow rotation) and the distal radio-ulnar joint were marked. The elbows were posi-tioned at predetermined angles using a long-arm goniome-ter and validated using Scion Image (Scion Corporation, Maryland, USA) imaging software.
R. B. Abu-Rajab (&) Orthopaedic Department, Royal Alexandra Hospital,
Corsebar Road, Paisley PA2 9PN, UK
e-mail: rashid.abu-rajab@rah.scot.nhs.uk; r1abu@hotmail.com
A. Marsh · L. A. Rymaszewski Orthopaedic Department, Glasgow Royal InWrmary, Castle Street, Glasgow G4 0SF, UK
D. Young
A total of 21 digital images (11 of the lean arm and 10 of the overweight arm) with the elbow in varying degrees of Xexion were taken. The lean arms elbow was placed at 10, 25, 40, 55, 70, 85, 90, 105, 120, 135 and 150° of Xexion. Those of the overweight arm were at 20, 35, 50, 65, 80, 90, 105, 120, 135 and 145°. One picture was shown twice, near the beginning and end (lean 55°).
One hundred and sixteen members of staV from four orthopaedic departments were recruited—28 consultant surgeons, 29 specialist registrars, 12 experienced senior house oYcers (SHO3), 24 Wrst year senior house oYcers (SHO) and 23 physiotherapists. The observers were asked to visually estimate elbow Xexion on each of the digital images on two separate occasions 1–5 weeks apart. They were instructed to record angles for each of the subjects to the nearest 5°, and only one measurement was allowed for each digital image.
Statistical analysis was performed grouping the errors into 5° levels of accuracy, and logistic regression analy-sis was used to determine the predictors of accuracy from grade, angle being estimated and thickness of arm, adjusted for time (i.e. Wrst or second assessment). Back-ward selection was used to produce the Wnal model and estimate odds ratios. Pairwise comparisons were done to compare the error rates for each profession with the per-formance of the consultants as the baseline with P-val-ues adjusted for multiple comparisons using the Bonferroni correction factor. The reliability of the mea-surements over time was assessed for each professional group by computing the intra-class correlation coe Y-cient. All analyses were done using Minitab Statistical Software for Windows (Minitab Inc., State College, USA) and STATA Statistical Software (StataCorp LP, Texas, USA) with a signiWcance level of 5%.
Results
On only 3 out of 232 occasions were all 21 photos accu-rately estimated to within §5°. However, the two specialist registrars, and one consultant, were unable to achieve this level of accuracy on both occasions.
All groups had high intra-class correlations (range 0.963–0.983) indicating good intra-observer variability, and repeatability of the measurements between the two time points (Table1). The lean arm at 55° was shown twice and was estimated to within §5° 44% of the time as photo 2 and 51% of the time as photo 17. This diVerence was not signiWcant.
[image:2.595.115.482.59.247.2]The measurement errors for each grade of profession are shown in Fig.2. These are shown as the mean of both attempts and the statistics is described for all estimates taken as a whole and not each individual observer. A break-down of these by attempt and a total for all observers can be seen in Table2 and illustrates that taking all professions together an average accuracy to within §5° was only seen 70.8% of the time. The magnitude of these measurement errors are illustrated in Fig.3 that clearly demonstrates a wide variability of estimates. However, at angles close to 90° and at the extremes of Xexion and extension observers
Fig. 1 a Digital photograph of lean arm showing a joint angle of 55°. b Digital photograph of overweight arm showing a joint angle of 105°
Table 1 Intra-class correlation coeYcients for all professions
Profession ICC 95% CI
Consultants 0.981 0.974, 0.986
Registrars 0.983 0.976, 0.988
SHO3s 0.970 0.956, 0.979
SHOs 0.963 0.948, 0.974
[image:2.595.306.543.629.717.2]were more accurate. This was conWrmed by logistic regres-sion analysis when compared to an angle of 90°;all other angles, apart from 85°, were signiWcantly less likely to be estimated within §5° (P< 0.001).
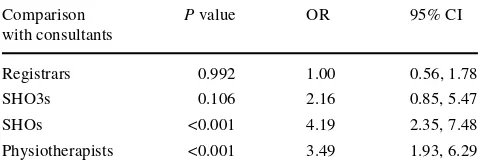
There was no diVerence in the proportions of accurate estimates between the lean and overweight arms (P= 0.141). Results were more likely to be accurate on the second attempt (P= 0.001). Compared to consultants, SHOs and physiotherapists were signiWcantly less likely to estimate the angles to within §5° accuracy. These compari-sons are shown in Table3. Estimating angles to within
§10° highlighted a diVerence in the arm thickness
(P= 0.007), with the lean arm more likely to be estimated accurately [OR 2.04, 95% CI (1.21, 3.42)]. The correspond-ing table of results for comparison with consultants is shown in Table4.
Fig. 2 Measurement errors for diVerent profession—mean of both at-tempts
Errors By Profession
0 10 20 30 40 50 60 70 80 90
20+ 10-15
5-10 +/-5
Error (Degrees)
Percentage (%)
[image:3.595.312.541.57.206.2]Consultant Registrar SHO3 SHO Physio
Table 2 Measurement errors for all professions on both occasions
Grade Time Proportion
accurate to within §5° (%)
Proportion accurate to within §10° (%)
Proportion accurate to within §15° (%)
Consultant First 75.2 93.7 98.3
Second 79.8 95.9 99.2
Both 77.5 94.8 98.7
Registrar First 74.1 92.8 99.5
Second 82.4 96.9 99.5
Both 78.2 94.8 99.5
SHO3 First 65.9 88.9 96.8
Second 73.4 90.9 96.0
Both 69.6 89.9 96.4
SHO First 62.1 82.1 92.5
Second 59.9 83.9 94.1
Both 61.0 83.0 93.3
Physiotherapist First 63.2 84.5 95.9
Second 64.6 85.9 95.9
Both 63.9 85.2 95.9
All First 68.8 88.8 96.8
Second 72.7 91.2 97.2
Both 70.8 90.0 97.0
[image:3.595.54.288.59.224.2]Fig. 3 Boxplot showing distribution of errors by angle
Table 3 Results of logistic regression analysis for comparison with consultants at level of estimation §5°
Comparison with consultants
P value OR 95% CI
Registrars 0.766 0.95 0.68, 1.32
SHO3s 0.071 1.58 0.96, 2.59
SHOs <0.001 2.46 1.71, 3.54
[image:3.595.306.544.272.356.2] [image:3.595.179.544.443.718.2]When validating all photos using Scion Image (Scion Corporation, Maryland, USA) imaging software, all angles measured with the long-arm goniometer, using a standard-ized protocol, were found to be within a mean diVerence of 1.56° (range 0.04–2.59°) from the value measured on the computer.
Discussion
This study demonstrated the inaccuracy of visual estima-tion of joint angles at the elbow, with only 70.8% of esti-mates overall being within §5°. Low [4] showed a mean error of 5° (SD 6°) when using a goniometer to measure elbow angles, but a mean error of 9.3° (SD 12.5°) when visually estimating. Watkins et al. [9] have shown simi-lar results for the knee, and Rose et al. [7] for the small joints in the hand. However, these Wndings have been disputed by others. Williams et al. [10] compared the diVerent types of goniometer with visual estimation for shoulder Xexion and concluded that visual estimation was as reliable and consistent as goniometry. However, they only looked at one angle, which was 100°, and as our study has shown angles closer to 90° are more likely to be estimated correctly so one could question their bold conclusion.
The reliability of goniometers has also been questioned with reported standard deviations varying from 2.1° to 6.0° for the elbow [1, 2, 4], but with values as high as 11.48° reported for other joints [10]. Standardisation of the patient’s position and stabilization of the proximal segment of the joint during the measurement process have been shown to minimize error and increase interobserver reli-ability [6, 9]. Fish and Wingate [2] reported that improper alignment of the goniometer, misidentiWcation of bony landmarks and variations in manual force, all contributed to goniometric error at the elbow. Thus, unless bony land-marks are accurately identiWed, correct application of the instrumentation cannot be guaranteed. In our study, the bony landmarks were clearly marked for reference, allow-ing all subjects to see these points for measurement. This may have been a source of potential error as it may have
forced the observers to estimate angles in an unfamiliar way, but it did standardize what everyone was measuring.
During the study, some test observers complained of “fatigue” while estimating the angles and felt they may not have performed as well at the end as at the begin-ning. We believe that this mimics the clinical environ-ment, as fatigue will be experienced towards the end of a busy clinic. These concerns were not borne out in the results; however, as when the same photo was shown twice, it was more accurately estimated on the later of the two occasions, though this was not statistically sig-niWcant, suggesting the “fatigue” they felt made little diVerence.
Experience did, in our study, seem to play a role in the accuracy of visual assessment being signiWcantly better in consultants and specialist registrars. Interest-ingly, physiotherapists, despite familiarity with assess-ing joint angles with a goniometer, had signiWcantly poorer results. This may simply be due to a lack of expe-rience with the techniques of visual estimation. These Wndings are similar to the Wndings of Rose et al. [7], who looked at estimation of MCP and IP Xexion in a resin hand model, and Williams and Callaghan [10] who hypothesised that visual estimation is a level of skill that is acquired through practice.
Our study demonstrated good intra-observer reliability for all diVerent groups (range 0.963–0.983). These results are in agreement with previously published studies [1, 3, 8, 9], emphasizing the importance of continuity when serially assessing joint angles.
In conclusion, we would suggest that visual estimation of joint angles at the elbow is not advisable in cases where accurate serial assessment is required for clinical decision making and would recommend the use of a goniometer by an agreed standardized technique in clinical practice.
ConXict of interest statement No funds were received in support of this study. No beneWts in any form have been or will be received from a commercial party related directly or indirectly to the subject of this manuscript.
References
1. Boone DC et al (1978) Reliability of goniometric measurements. Phys Ther 58(11):1355–1390
2. Fish DR, Wingate L (1985) Sources of goniometric error at the elbow. Phys Ther 65(11):1666–1670
3. Gajdosik RL, Bohannon RW (1987) Clinical measurement of range of motion. Review of goniometry emphasizing reliability and validity. Phys Ther 67(12):1867–1872
4. Low JL (1976) The reliability of joint measurement. Physiother-apy 62(7):227–229
[image:4.595.50.289.84.168.2]5. Morrey BF, Askew LJ, Chao EY (1981) A biomechanical study of normal functional elbow motion. J Bone Joint Surg Am 63(6):872–877
Table 4 Results of logistic regression analysis for comparison with consultants at level of estimation §10°
Comparison with consultants
P value OR 95% CI
Registrars 0.992 1.00 0.56, 1.78
SHO3s 0.106 2.16 0.85, 5.47
SHOs <0.001 4.19 2.35, 7.48
6. Riddle DL, Rothstein JM, Lamb RL (1987) Goniometric reliabil-ity in a clinical setting. Shoulder measurements. Phys Ther 67(5):668–673
7. Rose V et al (2002) Visual estimation of Wnger angles: do we need goniometers? J Hand Surg [Br] 27(4):382–384
8. Rothstein JM, Miller PJ, Roettger RF (1983) Goniometric reliabil-ity in a clinical setting. Elbow and knee measurements. Phys Ther 63(10):1611–1615