DELAMINATION LOCALIZATION AND LENGTH
ESTIMATION IN COMPOSITE LAMINATE BEAM BY VSHM AND
PATTERN RECOGNITION METHODS
Roberto Palazzetti*, Irina Trendafilova†, Andrea Zucchelli* and Giangiacomo Minak* *
Engineering Faculty, Mechanical Engineering Department University of Bologna
Viale del Risorgimento 2, 40136 Bologna, Italy e-mail: [email protected]
†
Department of Mechanical Engineering University of Strathclyde
James Weir Building, 75 Montrose Street, Glasgow, UK e-mail: [email protected]
Key words: Vibration-based damage detection, Composite beam, Delamination detection, Numerical Analysis.
SUMMARY.
The focus of this work is to investigate the delamination damage in laminate composite
beams, to fix a Vibration-based structural health monitoring (VSHM) method for the
laminate structures. The analysis is concentrated on the vibration characteristics of the
samples and, in particular, the attention is addressed on the first several natural frequencies of
a composite laminate beam with a delamination damage. The core of this work is an
experimental investigation on the vibration response of a composite laminate beam and its
changes caused by delaminations with different sizes and in different locations of the beam.
The study is divided in 3 sections: delamination detection, delamination localization, and
delamination estimate. The aim is to determine how the first six harmonics frequencies
change due to the delamination, and the results show that they can be successfully used to
investigate the presence, the location and the dimensions of the delamination in a composite
beam. A Pattern Recognition analysis is used to locate the damage, while the detection and
the evaluation are done using the changes in the harmonic frequencies. A finite element
analysis is performed, and the variations of the natural frequencies due to delamination are in
good agreement with the experimental results.
1. Introduction
Composite materials form about 70% of contemporary civil and military aircraft. Aircraft
safety is paramount because an accident will normally have catastrophic consequences in
and difficult, if not impossible, to repair. Composite materials can loose up to 60% of their
stiffness and toughness, and still remain visibly unchanged. These are some of the reasons
that make structural health monitoring for composite materials an issue of great importance.
Delamination is one of most common failure mechanisms for composite materials.
Delamination problem is as old as composite material. In laminated materials repeated cyclic
stresses, impact, and so on can cause layers to separate, forming a mica-like structure of
separate layers, with significant loss of mechanical strength. Thus, delamination is an
insidious kind of failure as it develops inside of the material, without being obvious on the
surface.
Delamination failure may be detected in the material by its sound [1,2]: solid composite has
bright sound, while delaminated part sounds dull. Other nondestructive health monitoring
(NDHM) methods include embedding optical fibers coupled with optical time domain
reflectometer testing [3], testing with ultrasound [1,2], radiographic imagining [1,4], infrared
imaging [1,5], in some cases acoustic emission monitoring [1,6,7], and vibration-based
measuring methods [2,8]. Among NDHM methods the vibration-based methods is a suitable
tool for damage detection which has been scarcely explored except for several papers devoted
to vibration based monitoring for delamination detection [2].
Vibration-based structural health monitoring (VSHM) methods use the vibration response of a
structure in order to find out its health. In VSHM methods the information from vibration
parameters (modal frequencies, mode shapes and modal damping ratio) or combinations of
some of them are used to estimate the variations of a structure mechanical response when
damaged. The basic idea of these methods is that modal parameters are functions of the
physical and mechanical properties of the structure (mass, damping and stiffness). In
particular changes in the mechanical properties, such as the stiffness reduction, will cause
changes in the modal characteristics. The measure of the vibration response of a structure
before and after a damaging event enable the possibility to estimate the damage localization
and entity. In the case of composite structure the usage of VSHM has been applied to
investigate two main failure modes: the matrix crack and the delamination. A comprehensive
literature review of this studies is presented in [9,10]. In particular it is interesting to cite the
works of Lifshitz and Rotem [11] who measured resonant frequencies and damping on
quartzparticle-filled epoxy and polyester. The authors found damping to be more sensitive to
damage than changes in the dynamic moduli. Schultz and Warwick [12] measured the forced
vibration response of glass-fiber-reinforced epoxy beams at various intervals during fatigue
damage. They also found, however, that the damping ratio and response magnitude were very
sensitive to damage. Adams, et al. [13] tested and glass-reinforced plates to attempt to detect
damage after both static and fatigue torsional loading. The main mode of failure was matrix
shear cracking. They found damping changes to be more sensitive than frequency shifts for
detecting the onset of damage. They also noted that some changes in dynamic properties in
the early stages of damage could be recovered after a rest period. Cawley and Adams [14]
apply a frequency-shift-based damage detection routine to several damage cases (holes, saw
cuts, crushing with a ball bearing, local heating with a flame, and impact) in composite
materials (CFRP plates and honeycomb panels with CFRP faces). They were able to locate
low levels of damage accurately. This successful location did require, however, controlled
temperatures and testing of the undamaged and damaged specimens in a short amount of time
to prevent long-term frequency shift. Reddy, et al. [15] experimentally measured natural
frequencies in composite plates containing delaminations. Graphite fiber/epoxy resin panels
with a [±45,0,90]2s layup were used with delaminations comprising 10% of the total panel area. They found that the resonant frequencies were insensitive to the delaminations, even
taking into account the higher modes. Lee, et al. [16] looked at the damping loss factor as a
possible indicator for detecting and locating four types of damage in composites beam:
notches that removed less than 5% of the cross-sectional area, matrix cracking in the 90
degree plies of a [902/019/902] glass/epoxy composite, In all cases, cantilever beams were excited with a force hammer. They found that the change in the damping loss factor was
always more sensitive to damage than the frequency change was. Tracy and Pardoen [17]
experimentally examined frequency shifts in graphite-epoxy laminates with midplane
delaminations. The resulting frequency shifts corresponded well with the analytical
predictions. Engblom and Havelka [18] quantified, both numerically and experimentally, the
effects of fibre breakage, matrix cracking, local buckling, and delamination based on
variations in stiffness and damping characteristics. Sanders, et al. [19] measured modal
parameters on damaged graphite/epoxy [0/903]s beams. Damage was induced by tensile loading the beams to 60%, 75%, and 85% of the ultimate tensile strength. Damage was
predicted using a sensitivity method and the measured frequencies. Because the measured
mode shapes were of poor resolution, they were not used in the prediction. Results agreed
well with independently obtained results based on static stiffness measurements and crack
densities from edge replication. Because this damage was approximately uniform throughout
the beam, the ability of the method to localize damage was not demonstrated. Nokes and
measure modal parameters on a composite beam at high frequencies (up to 10 kHz) with high
spatial resolution. They found the damping loss factor to be a sensitive indicator of global
material damage. Diaz Valdes and Soutis [21] used a novel method known as resonant
ultrasound spectroscopy to determine the modal frequencies of a composite beam obtained
from an eight-ply [0/90/90/0]s carbon/epoxy laminate of size 330 mm x 300 mm. The laminate was fabricated using T800-924C prepreg tapes. They used commercial, brass
backed, piezoceramic transducer and a piezoelectric film element (AMP Inc., LDTO-028-K)
bonded near the beam's fixed end and operated as actuator and sensor respectively. Changes
of the modal frequencies after delamination initiation, compared to those of a
non-delaminated specimen, gave a good indication of the degree of damage, demonstrating the
feasibility of using measured changes in the vibration characteristics to detect damage.
In this work, the VSHM is used to develop a simple delamination detection which is based
only on changes in the harmonic frequencies of a structure. The proposed method utilizes the
first several natural frequencies of a structure which are a rather easy and straightforward to
be precisely estimated from experiment. The study is based mainly on experimental results
and numerical analysis are performed on delaminated beam only for the purpose to support
the delamination localization. From the study it emerged that by a damage index based on the
first natural frequency it is possible to discriminate the presence or absence of a critical
delamination, and also that it was possible to determine, with a 95% of confidence, where the
delamination is located. Moreover by the relation between the variation of first natural
frequency (damage index) and the delamination length it is possible to determine the size of
damage.
The paper is organised as follows. In paragraph 2 the tested beams and the way used to
introduce the delamination are presented. It also discusses the different sizes and positions of
the delamination as well as the measurement points positions. The experiment performed and
the numerical model are described here as well. Paragraph 3 presents the results for the
natural frequencies of the healthy beam and the ones obtained for different delamination sizes
and locations as well as for different positions of the delamination. It was done to track and
find trends in the changes that the natural frequencies experience with delamination. A
damage index based on the first natural frequencies is suggested. The last paragraph discusses
the obtained results and makes conclusions regarding the application of the first several
natural frequencies for damage detection, localization and quantification of delamination in
2. Materials and Methods
The structures considered are composite beams made by prepreg of carbon fibers (T300)
embedded in a epoxy resin (SE 84 SP-Gurit) with a 60% of fibers volume ratio and a density
of 300 g/m2. Laminate lay-up was cross ply [0/90]10s. The beams were manufactured with a length of 350 mm, a width of 30 mm and 1.7 mm thick. The thickness is made of ten layers. It
is used this kind of structure because its shape is appropriate for the purposes: it is thin,
therefore it is possible to have wide amplitude with a small force. This fixing condition was
adopted because it mimics better a real structural part than a free-free beam and also because
the tests are quite easy to do. Delamination was introduced artificially by inserting a Teflon
sheet in the desired position. The artificial introduction has the advantage that the
delamination can be introduced exactly with the desired size and in the desired position but it
has the disadvantage that different specimens are tested: for these reasons special care was
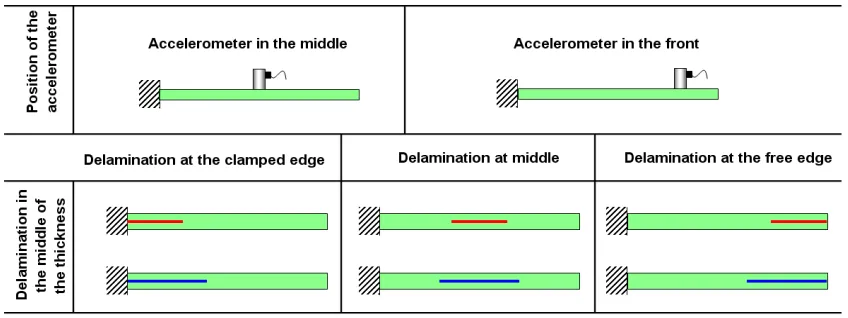
taken that all the specimens are identical in terms of dimensions. Two different sizes of
delamination were introduced: “long” and “short”. The small one is 115 mm long and the big
one is 175 mm long. Three different positions of the delamination along the beam length were
tested, namely back (starting at the clamped end), middle and front. The positions of the
[image:5.612.94.518.419.578.2]delamination are shown in Figure 1.
Figure 1 – scheme of the position of the accelerometer and of the delamination
Beams were excited with a “Bump Test”, which was done by clamping the beam at one end
and stimulating the structure at the free end, while an accelerometer, fixed above the beam
registers the response. This kind of test is safer than others which use sine solicitation, and it
is easier; moreover, for the purpose of this work the magnitude of the vibration is not
this kind of tests are impulse, broadband, swept sine, and chirp. Each has its own advantages
and disadvantages. In this work it is been used an impulse signal exerted by a hammer, hitting
the free end of the samples. The quantity to be measured is the motion during the vibration, so
it is necessary to use an accelerometer: a piezoelectric one was used. To constrain beams it
was decided to use a G – clamp on a stiff table. In order not to damage the item in the contact
point with the clamp, a slab made of stiff rubber was interposed between the elements in
contact (clamp-beam and table-beam). Beams were clamped in the way to leave a free length
of 300 mm for all the experiments. Two different positions of the accelerometer were
explored as well: it was placed in the middle of the beam, 150 from the clamping and close to
the free end, 225 mm from the clamped end. The reason for this choices is that the different
vibration modes have different node points where the displacement is null or very close to
zero. The middle position is expected to be close to a node point for some modes e.g. the third
and the fifth modes, but it is a point of large amplitude displacements for other modes e.g. the
first, the second and the fourth mode. Thus it would be appropriate for analyzing some modes.
The end position is not expected to be a node point for any of the lower modes for a cantilever
beam. Six different configurations of delaminated beams were manufactured, each one of
them tested twice, changing the position of accelerometer. Because of the possible errors in
the manufacturing process, it was decided to manufacture 3 identical items for each
configuration, and repeat each tests 5 times for every configuration obtaining in this way the
harmonic frequencies from the average of the results for each signal: thus 30 data sets were
obtained for each specimen, for every position of the transducer. It was the same for the
non-delaminated beams: the test was repeated on 3 identical items, 5 times for each position. In
this way 3 specimens for each one of the 7 different configurations (1 undamaged and 6
damaged) were obtained, and tests for each specimen were repeated 5 times for both position
of the accelerometer.
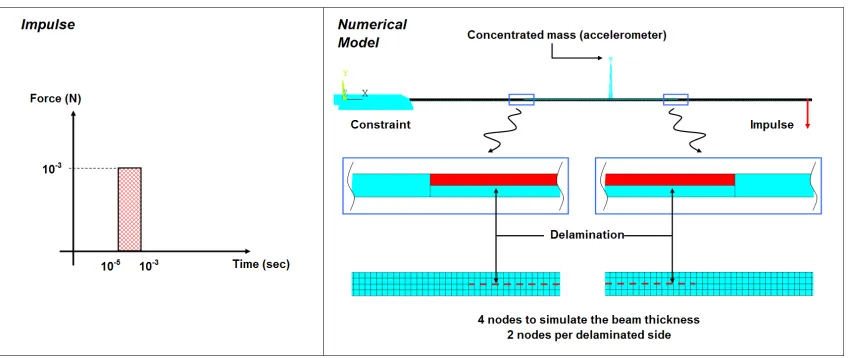
Numerical analysis have to simulate the test condition, thus the most important and critical
aspect is simulate the impulse. It is impossible with a modal analysis, so a Transient Analysis
was used. The impulse for transient analysis was simulated by a squared function, shown in
Figure 2 - Impulse characteristics and Numerical model details
The elements used are PLANE182 to model the beam, MASS21 to simulate the mass of
accelerometer, LINK1 to connect the concentrated mass of the accelerometer to the beam,
TARGE169 and CONTA172 to introduce the Contact Condition in the delaminated zone.
Delamination was inserted into the geometry as a discontinuity, modelling the beam with
more areas as shown in figure 2. For the purpose of numerical simulation the following
material characteristic have been used: Ex = Ey = 44000 MPa, ν = 0.28, density = 1600 kg/m3. This analysis allows to determine the vibration of the beam with the purposes of confirm the
experimental results and support the delamination localization procedure (§3.2).
3. Delamination detection and localization
In this section the detection of the delamination, its localization and its length estimation
using the natural frequencies is considered. In §3.1 it is discussed the way to determine the
occurrence of a delamination in the composite beam. In §3.2 a simple method for the
delamination localization based on the pattern recognition method is developed and applied to
the delaminated beams. In §3.3 a methodology for the estimation of the delamination length
based on the variation of the first natural frequency is shown.
3.1 Delamination detection. The main idea of this paragraph is to suggest a method to detect the presence of the delamination damage in the composite beam. This is done using the
stiffness reduction then it can be expected to reduce the flexural natural frequencies of the
structure [22] and especially the first natural frequency. In order to account this variation a
damage index based on the variation of the first natural frequency is proposed. This index
represents the experimentally obtained relative changes in per cent in the first natural
frequency of the beam with the length of the delamination for different positions of the
delamination. A further Finite Element analysis, which results in terms of variation of the first
natural frequency are also summarized in figure 3, confirmed the experimental ones.
(A) 0 20 40 60 80 100 120 140 160 180 200
0% 2% 4% 6% 8% 10% 12% 14% 16% 18%
Variation of the first natural frequency (%)
D e la m in a ti o n l e n g th [ m m ] Exp-Back Num-Back (B) 0 20 40 60 80 100 120 140 160 180 200
0% 5% 10% 15% 20% 25% 30% 35%
Variation of the first natural frequency (%)
D e la m in a ti o n l e n g th ( m m ) Exp-Mid Num-Mid (C) 0 20 40 60 80 100 120 140 160 180 200
0% 10% 20% 30% 40% 50%
Variation of the first natural frequency (%)
D e la m in a ti o n L e n g h t [m m ] Exp-Front Num-Front
Figure 3 – Per-cent variation of the first natural frequency estimated for specimens having the delamination respectively in the clamped edge (A), in the middle (B) and in the free edge (C). Results in all diagrams are obtained by both experimental tests and numerical analysis
Another observation that can be done is that the changes are big enough even for the case of the smaller delamination length. Thus the following damage index can be suggested:
undamaged damaged undamaged f f f 1 1 1 − = ξ (1)
ξ<ξ∗ no delamination ξ>ξ∗ presence of delamination
In the above rule ξ* is a threshold value and below that one can assume that there is no delamination while above this value it can be assumed that delamination is present in the beam. Normally this threshold value can be set to about 0.05 or 5%. Changes below this value can be caused by a number of reasons including noise, temperature and environmental changes. Once the changes become bigger than the presence of delamination is quite likely so this might be set as an “alert” level in the detection. It was been created a testing sample of 900 signals (half of these were with no delamination and the other 500 corresponded to different levels and different positions of delamination) by adding noise between 3% and 5% (Gaussian noise) to the experimentally obtained vibration signals. From these results it was determined the first natural frequency and used it in the delamination index suggested above by equation (1). The alarm level was set to 10%. The delamination index correctly detected the presence of delamination in 96% of the cases.
3.2 Delamination localization.
The question answered in this paragraph is whether localization of the position of the delamination with respect to the beam length is possible. The experimental results for the first several natural frequencies and the theoretically obtained ones were reviewed and it turned out a rather complicated task to find the boundaries for the different frequencies for the different delamination locations namely back (close to clamping), middle (around the midpoint of the beam) and front (close to the front of the beam, away from clamping). This is why the problem for damage detection and localization was formulated as a pattern recognition (PR) one [23-26]. Three different categories (classes) according to the possible location of the delamination are defined: delamination back (B), delamination middle (M) and delamination front (F). This formulation suggests that one already suspect the presence of delamination in the structure. A PR problem suggests the recognition of the signals measured for the three different delamination locations on the basis of some features that can be extracted from these signals. Since it is clear that the natural frequencies are sensitive to damage and consequently to delamination six of the natural frequencies as features were chosen. These were chosen on the basis of the numerically obtained natural frequencies from the FE model of a clamped undamaged carbon fiber beam. The natural frequencies used are given in Table 1. It was also observed that the spectra of the measured responses for the undamaged as well as for the delaminated beams exhibit peaks close to these six frequencies with a certain variance which is also given in Table 1. These particular frequencies were chosen because they are not double ones and there are no other natural frequencies within the interval f±2σ. Table 1 - The six natural frequencies used as features and the corresponding standard deviations.
f1
(2nd natural frequency
f2
(3rd natural frequency)
f3
(5th natural frequency)
f4
(7th natural frequency)
f5
(10th natural frequency)
f6
µ=2.5 Hz
σ = 20%
µ=4.9 Hz
σ = 15%
µ=7.2 Hz
σ = 7%
µ=52 Hz
σ = 1%
µ=74 Hz
σ = 1%
µ=112 Hz
σ = 0.9%
In order to solve a PR problem it is been created a training sample of 1200 signals (400 for each category) measured for 1 second and sampled at 500 Hz (according to our model this is the expected range for the first six natural frequencies of the beam). This sample was created using 100 measured signals and adding Gaussian noise between 3% and 5% to the measured acceleration response signals. The next step was to test whether it is possible to recognize signals from the three defined categories using the first 6 natural frequencies. For the purpose a new testing of another 1200 signals was created, obtained using another 100 measured signals and adding Gaussian noise between 3% and 5%. The recognition was done using the 1-NN method. According to the method each new signal is assigned to the category of its nearest neighbour. The Euclidean distance between vectors made of the first 6 natural frequencies of the beam was used a measure.
∑ − = = 6 1 2 2 1 2
1 ) ( )
(
i
i i f
f
d f ,f (2)
Thus for each new vector of the testing sample the distances to all the vectors from the training sample were obtained and a vector f was categorized to the class j if its nearest negihbour f j belonged to that class:
) , ( min ) , ( 1200 1 k k j d
d f f f f
=
= (3)
where f kare the vectors from the training sample. The results from the testing are presented
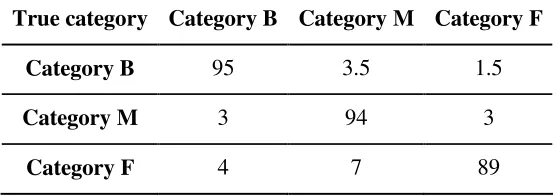
[image:10.612.88.525.68.103.2]in terms of “confusion matrix” which contains the percentage of all the correctly classified and the miss-classified vectors f from the testing sample. The confusion matrix is given in Table 2. It can be seen that for the B and M categories about 95% of the signals were correctly classified and only for the category F(front delamination) 89% were correctly recognized while the rest 11% were miss-classified.
Table 2 - Confusion matrix for the testing sample
True category Category B Category M Category F
Category B 95 3.5 1.5
Category M 3 94 3
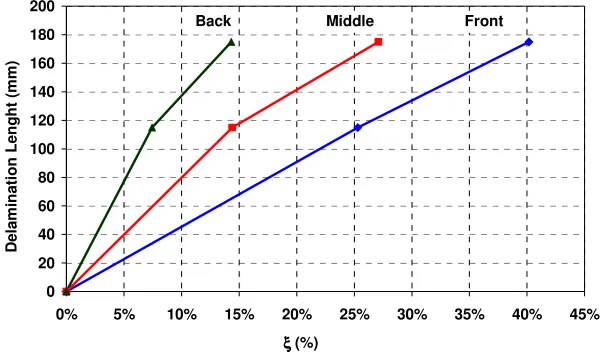
[image:10.612.167.445.589.687.2]3.3 Delamination Length. The main idea of this paragraph is to suggest a method to determine the dimensions of the delamination located with the previous PR. This will be done using the damage index already mentioned above. It was been written the Damage Index for the different configurations of damaged beams, and the results are shown in Figure 4.
0 20 40 60 80 100 120 140 160 180 200
0% 5% 10% 15% 20% 25% 30% 35% 40% 45%
ξ ξξ ξ (%)
[image:11.612.157.457.151.327.2]D e la m in a ti o n L e n g h t (m m ) Front Middle Back
Figure 4. Delamination index for different positions of delamination along the beam length
When the delamination presence is confirmed as proposed in §3.1, and located as described
by the methodology exposed in §3.2, the knowledge of damage index ξ enable the estimation
of the delamination length.
4. Conclusions.
mentioned above. It is a very good achievement, because in most damage assessment methods another experiment (e.g. acoustic emission) is needed to locate and/or quantify the fault.
References
[1] Peter J. Shull, Nondestructive Evaluation Theory, Techniques, and Applications, Marcel
Dekker, Inc., 2002.
[2] S.W. Doebling, C.R. Farrar and M.B. Prime, A Summary Review of Vibration-Based
Damage Identification Methods, The Shock and Vibration Digest, Vol. 30, No. 2, pp.
91-105, 1998
[3] R. Crane, A. Macander and J. Gagoric, Fibre optics for a damage detection system for
fibre reinforced plastic composite structures, Rev Progr Quant Non-Destruct Eval 2B,
pp. 1419–1430, 1982.
[4] Robert Crane, Donald Hagemaier, Robert Fassbender, Radiographic Inspection of
Composites, Comprehensive Composite Materials, Chapter 5.13, Pages 321-344, 2003
[5] H.I. Ringermacher, B. Knight, J. Li, Y.A. Plotnikov, G. Aksel and D.R. Howard et al.,
Quantitative evaluation of discrete failure events in composites using infrared imaging
and acoustic emission, Nondestruct Test Eval 22 (2–3), pp. 93–99, 2007
[6] G. Minak, A. Zucchelli, Damage Evaluation and Residual Strength Prediction of CFRP
Laminates by means of Acoustic Emission Techniques, a cura di LUCAS P. DURAND.
Composite Materials Research Progress. (pp.1-45). ISBN: 1-60021-994-2.
HAUPPAUGE NY: Nova Science Publishers, Inc.
[7] Igor M. De Rosa, Carlo Santulli, Fabrizio Sarasini, Acoustic emission for monitoring
the mechanical behaviour of natural fibre composites: a literature review, Composites
Part A: Applied Science and Manufacturing, In Press, Accepted Manuscript, Available
online 10 May 2009
[8] Clarence W. de Silva, Vibration Monitoring, Testing, and Instrumentation, CRC Press
Taylor & Francis Group
[9] Scott W. Doebling, Charles R. Farrar, Michael B. Prime, Daniel W. Shevitz, Damage
Identification and Health Monitoring of Structural and Mechanical Systems from
Changes in Their Vibration Characteristics: A Literature Review, Los Alamos National
[10] Y. Zou, L. Tong, G. P. Steven, Vibration-Based Model-Dependent Damage
(Delamination) Identification and Health Monitoring for Composite Structures – A
Review, Journal of Sound and Vibration, 230(2), 357-378, 2000
[11] Lifshitz, J.M., Rotem, A. Determination of Reinforcement Unbonding of Composites by
a Vibration Technique, Journal of Composite Materials, 3 (3), p.412-423, Jan 1969
[12] Schultz, A. B., Warwick, D. N., Vibration Response: A Non-Destructive Test for
Fatigue Crack Damage in Filament-Reinforced Composites, Journal of Composite
Materials, 5 (3), p.394-404, Jan 1971
[13] Adams, R.D., D. Walton, J.E. Flitcroft, and D. Short, Vibration Testing as a
Nondestructive Test Tool for Composite Materials, Composite Reliability, ASTM STP
580, 159–175, 1975
[14] Cawley, P. and R.D. Adams, The Locations of Defects in Structures from
Measurements of Natural Frequencies, Journal of Strain Analysis, 14 (2), 49–57, 1979.
[15] Reddy, A.D., L.W. Rehfield, and R.S. Haag, Influence of Prescribed Delaminations on
Stiffness-Controlled Behavior of Composite Laminates, Effects of Defects in
Composite Materials, ASTM STP 836, 71–83, 1984.
[16] Lee, B.T., C.T. Sun, and D. Liu, An Assessment of Damping Measurement in the
Evaluation of Integrity of Composite Beams, Journal of Reinforced Plastics and
Composites, 6, 114–125, 1987.
[17] Tracy, J.J. and G.C. Pardoen, Effect of Delamination on the Natural Frequencies of
Composite Laminates, Journal of Composite Materials, 23, 1200–1215, 1989.
[18] Engblom, J.J. and J.J. Havelka, Combined Analytical/Experimental Approach for
Developing Structural Model of Damaged Composite Structures, in Proc. of 32th
AIAA/ASME/ASCE/AHS/ASC Structures, Structural Dynamics and Materials Conf.,
1332–1340, AIAA-91-1085-CP, 1991.
[19] Sanders, D., Y.I. Kim and R.N. Stubbs, Nondestructive Evaluation of Damage in
Composite Structures Using Modal Parameters, Experimental Mechanics, 32, 240–251,
1992.
[20] Nokes, J.P. and G.L. Cloud, 1993, The Application of Interferometric Techniques to the
Nondestructive Inspection of Fiber-reinforced Materials, Experimental Mechanics, 33,
314–319.
[21] S. H. Diaz Valdes, C. Soutis, Delamination Detection in Composite Laminates from
Variations of their Modal Characteristics, Journal of Sound and Vibration, 228(1), 1-9,
[22] Christian N. Della, Dongwei Shu, Vibration of Delaminated Composite Laminates: A
Review, Applied Mechanics Reviews, January 2007, Vol. 60, 1-20
[23] I. Trendafilova, W. Heylen, Categorization and Pattern Recognition methods for
Damage Localization from Vibration Measurements, 2003, Mechanical Systems and
Signal Processing, 17 (4), pp 825-836.
[24] I. Trendafilova, A study on vibration-based damage detection and location in an aircraft
wing scaled model, Applied Mechanics and Materials, vol 3-4 (2005), pp 309-314
[25] J.T. Tou, R. C. Gonzales, Pattern recognition principles Addison-Wesley Publ. Comp
(1974)
[26] H. Sohn, Charles R. Farrar, Norman F. Hunter, and Keith Worden, Structural Health
Monitoring Using Statistical Pattern Recognition Techniques, ASME Journal of