Evaluation of user satisfaction using evidential reasoning-based
methodology
Dawei Tanga, T. C. Wongb*, K. S. Chinc, and C. K. Kwongd
a
Safety and Environment Assurance Center, Unilever Colworth, Colworth Science Park, Sharnbrook, Bedfordshire, UK, MK44 1LQ
b
Department of Design, Manufacture, and Engineering Management, The University of Strathclyde, Glasgow, Scotland, UK, G1 1XQ
c
Department of Systems Engineering and Engineering Management, The City University of Hong Kong, Hong Kong, China
d
Department of Industrial and Systems Engineering, The Hong Kong Polytechnic University, Hong Kong, China
ABSTRACT
For the sake of gaining competitive advantages, it is important to evaluate the satisfaction level of a product or service from the users’ perspective. This can be done by investigating the
relationship among customer attributes (customer requirements) and design attributes (product configurations). However, such relationship would be highly non-linear in nature. In this regard, many
approaches have been proposed over traditional linear methods. Particularly, Adaptive Neuro-Fuzzy Inference System (ANFIS) method has been prevalently utilized in modeling such vague and complex
relationship among these attributes and evaluating user satisfaction towards certain products or services. Despite the fact that ANFIS method can explicitly model the non-linear relation among these
attributes, it may be restricted if uncertain information can be observed due to subjectivity and incompleteness. To overcome these limitations, a belief rule base (BRB) approach with evidential
reasoning (ER) is applied in this paper. For justification purpose, both the ANFIS and BRB methods are applied to the same case. Comparison results indicate that the BRB is capable of minimizing the human biases in evaluating user satisfaction and rectifying the inappropriateness associated with
ANFIS method. Also, the BRB method can generate more rational and informative evaluation results.
Keywords: user satisfaction; belief rule base; evidential reasoning; ANFIS; subjectivity;
1. INTRODUCTION
With an increasing emphasis on a company’s ability to produce high-quality consumer
products, it is important to examine user satisfaction which has a direct influence on user retention as well as company’s profitability [3,15]. According to users’ needs and preferences, it is vital to find out
how user satisfaction would be affected especially within a highly competitive market [11]. In this
regard, user satisfaction has been evaluated with different methods such as statistical regression [8], fuzzy regression [2,16], neural networks [1,10], fuzzy rule-based modeling [5,19], etc. However, in
most of the current literature, a linear relationship between customer attributes (customers’ requirements) and design attributes (products’ configuration) is always assumed, although such a
relationship would be highly non-linear [18]. In addition, a number of models in the literature mentioned above are implicit, i.e., they are in essence a “black box” model in which a separate
explanation facility is required to justify the reasoning process [32].
To overcome these shortcomings, a modified method based on an Adaptive Neuro-Fuzzy
Inference System (ANFIS) [18] is proposed to evaluate user satisfaction. The advantages of such a method are: (i) the non-linear relationship between customer attributes and design attributes can be
modeled; (ii) the generated models are more simple and explicit than that from the original ANFIS. This method was verified through a case study about the evaluation of user satisfaction towards
different notebook computers. However, both the original and the modified ANFIS methods have some limitations, which can be summarized as follows:
Some design attributes such as the color of a product cannot be numerically measured due to
their imprecise and uncertain features. Hence, advanced soft computing methods like ANFIS
are not applicable for modeling such attributes [20]. In addition, due to the complexity of user perception, incompleteness may exist in the information regarding design attributes, i.e. many samples collected from survey may be incomplete, and such incompleteness cannot be
properly addressed by ANFIS [17].
Using ANFIS, the information regarding the relations among customer attributes and design
attributes is represented by a fuzzy rule base which can be inferred from numerical data or
expert knowledge [7]. Due to the complexity of user perception towards notebook computers, information regarding such relations may be uncertain because of subjectivity or incompleteness. However, ANFIS is not able to handle the uncertain information.
The information aggregation process of ANFIS is conducted by a weighted summation
method which suffers from the following limitations:
In the aggregation formula, different measurement units (e.g., “LCD Screen Size” in inch and “weight” in kg of notebook computers) are summed up directly. This is
inappropriate and the aggregated results may induce confusion since the physical
The aggregation formula can only handle numerical information without uncertainty.
As discussed before, some design attributes cannot be quantified (e.g. color of the
notebook computer).
Using the weighted summation method, different combination of attribute values may
lead to the same result. In other words, the variations among distinct sets of attributes
may be ignored, which leads to significant information loss.
Using ANFIS, a single score is computed to measure user satisfaction, but such score cannot
reflect the proportion of uncertain information regarding design attributes, which are the major input to the evaluation model.
Also, it oversimplifies the reality by describing human perception with a single value, which
only indicates the overall impression but not the diverse nature of human perception towards a certain product. Thus, the strengths or weaknesses of the product cannot be truly revealed [25].
Due to the above constraints, a Belief Rule Base (BRB) method [26] is applied to evaluate user satisfaction in this study. Similar to both the modified ANFIS method in Kwong et al. [18] and
the original ANFIS method [12], the BRB method is also able to explicitly model the non-linear relationship among customer attributes and design attributes. Also, it can overcome all the above constraints of ANFIS. To demonstrate the advantages of the BRB method over ANFIS method, two
case studies with the same data in [18] are conducted.
The paper is organized as follows: in Section 2, BRB method is introduced and the
advantages of BRB method over ANFIS method for user satisfaction evaluation are analyzed, the BRB method is then validated by two case studies in Section 3, and Section 4 concludes the paper
with future research direction.
2. THE PROPOSED METHOD
As discussed in the previous section, design attributes of a certain product may be of different
inherent features, and thus should be assessed in different forms. In addition, different types of uncertainties are inevitably involved in the process of evaluating user satisfaction due to the
subjectivity and incompleteness. In order to capture information of different forms and accommodate uncertainties of different types under a unified framework, belief distribution is introduced.
2.1. Belief distribution and belief rule base
A belief distribution was originally developed to model a subjective evaluation with
uncertainty [27]. For example, when evaluating the performance of a product, a customer may think that its performance is classified as “Good” with 70% confidence level and “Excellent” with 30%
confidence level. The above evaluation thus can be represented by a belief distribution:
“Good” respectively. The sum of degree of belief is 1.0 which indicates a complete evaluation.
However, when evaluating user satisfaction, the incomplete judgment may be observed due to several
reasons such as lack of data or evidence, or the novelty or complexity of the product. For example, incomplete judgment can be noted as: E(Performance) = {(Excellent, 0.3), (Good, 0.5)} where the sum of degree of belief is only 0.8 < 1.0. Therefore, such evaluation is incomplete if the customer
does not have sufficient information to assign his/her degree of belief in judging the product’s performance. However, it is expected that the incompleteness will be resolved after the customer has
acquired more information by experiencing the product.
Although belief distribution is originally used to model subjective judgments, it can conform
to quantitative information with the transformation method proposed in [27]. Also, fuzzy numbers can be embedded by belief distribution using the max-min operator [26]. Therefore, as a unified
framework, belief distribution is able to process different forms of information such as quantitative, fuzzy or qualitative, etc.
In general, a belief distribution can be expressed by (1) where E(Attribute) stands for the performance evaluation in terms of a particular attribute, H1,…,Hn are the grades used to classify that
attribute, and β1,…,βn are the belief degrees attached to the corresponding grades.
1, 1
, 2, 2
,....,
n, n
E Attribute H H H (1)
In (1), if
1 1 n i i
, the evaluation is deemed as complete, otherwise incomplete. Based on thebelief distribution, a Belief Rule Base (BRB) is proposed in [26], which consists of L belief rules, and
the k-th
k
1, 2,...,L
belief rule (Rk) in a BRB can be denoted by (2). In (2),
, 1, 2,..., ,0 , 1
i k i N i k
is the degree of Di to which the consequence D in the k-th rule is likely
to appear. If the knowledge regarding the relation among Ai and D where Ai is described by
, i 1, 2,...,
i p i i
A p M is complete, ,
1 1 N i k i
, otherwise, ,1 1 N i k i
, for all i=1…M. In the rule base,θk (rule weight) is used to reflect the relative importance of Rk and δk,j is used to denote the relative
importance of the j-th antecedent (Aj) of Rk for all j=1…M.
1 1, 1 2 2, 2 ,
1 1, 2 2, ,
: ... ,
{( , ),( , ),....,( , )}
k k k
k p p M M pM
k k N N K
R IF A is A AND A is A AND AND A is A
THEN D is D D D (2)
Specifically, the details of Rk can be depicted as: there are M antecedents (A1…AM) and the
by the grade of , j
k j p
A for all j=1…N, the consequence D can be described by Di with the belief degree
of βi,k for all i=1…N.
2.2. Inference and result explanation
Before conducting the inference based on BRB, the information regarding each antecedent should be first transformed into a belief distribution using the method proposed in [27]. After the transformation, different forms of information regarding each antecedent and different types of
uncertainties involved can be modeled by belief distributions in a unified way. Specifically, the information regarding antecedent Ai (for i=1…M) in (2) can be represented by a belief distribution as
shown in (3). In (3), Ai can be described by Ai,j which are the referential values or grades, to the degree of αi,j where i=1…M and j=1…Mi.
i
i,1, i,1
, i,2, i,2
,...
i M, i, i M, i
S A A A A (3)
Based on the information regarding antecedents in forms of belief distributions as presented in (3), and knowledge regarding the relations among antecedents and consequence denoted by belief
rules as shown in (2), the next step is to conduct inference such that meaningful results can be generated. In this paper, the inference is conducted by the Rule-base Inference Methodology using the
Evidential Reasoning (RIMER) approach [26]. The key idea of RIMER is as follows: 1) activate belief rules with different strengths. The activation strength of a belief rule is based on the match
degree between the combination of antecedents in the rule and the actual information regarding the antecedents. An activation weight is assigned to each belief rule to represent the corresponding activation strength of the rule. 2) The consequences of all activated rules are combined with the
consideration of its activation weight using Evidential Reasoning (ER) approach to generate the inference result [28, 29]. Specifically, based on (3), the conditional part of Rk can be denoted by (4).
In (4), the total match degree (αk) of the input ( , i
, , 1, 2,...,
, , i
, , 1, 2,...,
k k
i p i j i i p i j i
A A j M j M )
and the packet antecedent of Rk can be calculated by (5) where k i, must satisfy (6). The activation weight/strength (ωk) of Rk can be specified by (7) by incorporating αk and the weight (θk) of Rk.
1, 1, 1,1
2, 2, 2, 2
...
, M, , M
k k k k k k
p p p p M p M p
A A A (4)
, , 1 k i i M k k i pi
(5)
, , , 1,2,...,max
k i k i k i i M
1 k k k L i i i
(7)Likewise, the inference result of RIMER is represented by a belief distribution as shown in
(8). In (8), i
i
1, 2,...,N
is the degree to which the result would be described by Di. In addition, according to the RIMER method [26] and analytical ER approach [29], the relation between
1, 2,...,
n n N
in (8), i k,
i
1, 2,...,N
,k
1, 2,...,L
in (2) and k
k
1, 2,...,L
in (7) can be represented by (9) where n=1…N [20]. If the input information and each belief rule in the BRB iscomplete, 1 1 N n n
, otherwise,1 1 N n n
. βH is used to measure the difference (i.e. incompleteness)between
1
N n n
and 1, as presented in (10).
1, 1
, 2, 2
,..., N, N
S D D D D (8)
, , ,
1 1
1 1
, , ,
1 1 1 1 1 1
1 1
1 1 1 1
L N L N
k n k k i k k i k
i i
k k
n N L N L N L
k n k k i k k i k k
n k i k i k
N
(9) 1 1 N H n n
(10)
For the ease of comparison among the inference results, the minimum and maximum utility of the inference result D in (8) can be calculated by (11) and (12) respectively. It is assumed that Un in
(11) and (12) is the utility of Hn
n
1, 2,...,N
in (1), representing the extent to which the grade Hnis preferred regarding the result D. Normally, Un is a real number between 0 and 1, and if Hn is highly
preferred, Un will be close to 1, otherwise it will be close to 0 if Hn is not preferred at all. In addition,
for the convenience of discussion, it is assumed that Uk1Uk
k
1, 2,...,N1
.It can be observed that the utility of D is given as an interval with lower bound U(D)min and upper bound U(D)max due to the impact of βH. Usually, the average of U(D)min and U(D)max is
considered as the representative utility of the aggregated evidence D in (8). Noted that the utility is a
precise value instead of an interval if H 0and
min
max1
N i i i
U D U D U
. The evaluation of a
min
1
1 2N
H i i
i
U D U U
(11)
1
max 1
N
i i N H N i
U D U U
(12)
min maxmin max
( ) ( )
[ ( ) , ( ) ]
2
U D U D
E Attribute U D U D OR (13)
From the above discussion, the result generated by RIMER is either in the form of a belief
distribution or a utility based on the belief distribution. Also, the uncertainties, either caused by incompleteness or subjectivity, can be conveniently reflected from the inference result. In this
connection, the incompleteness can be reflected by βH if the result is represented by a belief distribution. Alternatively, the incompleteness can be reflected by the interval width, i.e. U(D)max– U(D)min, if the result is in the form of a utility. Apart from incompleteness, subjectivity can also be
measured by belief distribution in the similar form of (3). Using BRB method, the impact of subjectivity can then be reflected by (8). Since the inference result can be analyzed in terms of both
belief distribution and utility, our proposed method can provide a convenient yet diverse means of evaluating user satisfaction.
2.3. Summary
The advantages of applying BRB to evaluate user satisfaction over ANFIS method can be summarized as follows:
With the introduction of belief distributions and the transformation method proposed in [27],
different forms of information (e.g., quantitative, fuzzy or qualitative) and types of
uncertainties (due to subjectivity or incompleteness) regarding design attributes can be modeled under a unified framework;
Different types of uncertain knowledge regarding the relation among customer attributes and
design attributes can also be modeled using belief rules;
Under the context of BRB, there are several distinct features of the aggregation process which
is conducted by the ER approach:
The measurements of attributes with distinct nature need not to be added directly.
Instead, they can be uniformly transformed into belief distributions and then handled
by BRB method;
The difference in value between various sets of attributes can be captured and
reflected by aggregated result, which is represented by belief distributions; and Information loss during the process of inference can be minimized [22].
Uncertainties (due to subjectivity or incompleteness) can be conveniently reflected from the
In addition to overall user satisfaction towards a certain product, the inference result can also
provide evidence to show the diverse nature of customer perception towards that product such
that its strengths and weaknesses can be conveniently examined.
3. CASE STUDY: THE APPLICATION OF RIMER IN USER SATISFACTION
EVALUATION
3.1. Background
In order to evaluate the user satisfaction towards notebook computer, which is one of the common electronic products, a survey was conducted [18]. The target respondents were mostly
full-time engineering students from a local university and 80 completed questionnaires were received. In
the survey, the respondents were asked to rate six different brands of notebook computers (Brand A-F) against five customer attributes: Quality, Performance, User-friendliness, Comfortable-to-Carry, and Appearance Attractiveness. The design attributes (configurations) of the benchmarked computers
were: CPU, RAM, hard disk memory, LCD screen size, battery life, weight, and price. A five-point scale was used to assess the computers against five different customer attributes: 1 – Very Bad, 2 –
Bad, 3 – Moderate, 4 – Good, and 5 – Very Good. From the survey results, 91% of the respondents have indicated that they would spend more than HKD 6,000 to purchase notebook computers.
Surprisingly, 27% of them have shown that computers of HKD 10,000 or more would be acceptable even though they don’t have any income. This observation, thus, highlights the potential of this
market segment. It is believed that this segment would demonstrate even higher purchasing desire and power after university graduation. Therefore, it is beneficial to understand the needs or preferences of
this target group. For ease of evaluation, their needs are matched with customer attributes (e.g. Quality, Comfortable-to-Carry, Appearance Attractiveness, etc). The product configurations are described by design attributes (e.g. CPU, RAM, LCD Screen Size, Weight, Color, Design, etc) which
can be controlled to fulfill the customers’ needs.
The data collected in the survey will be used to validate the BRB based method introduced in
this paper, and to demonstrate the advantages of the BRB based method over the modified ANFIS method as well as the original ANFIS method. In fact, there is no major difference between the
modified and original ANFIS methods except a more simple and explicit user satisfaction model can be extracted from the modified one. In terms of inference result, the same can be concluded from the
modified and original ANFIS methods. Hence, two case studies will be conducted to compare the inference capability of our proposed method and ANFIS method. In the first case, both our method
and ANFIS method are applied to the same problem, and the advantages of our method will be reflected. In the second case, our method will be applied to a problem which cannot be solved by
ANFIS method.
In the study of Kwong et al. [18], a case to evaluate user satisfaction of notebook computers was investigated. Specifically, a modified ANFIS was applied to model the relation among customer
attribute of ‘‘Comfortable-to-Carry” and two relevant design attributes, “LCD Screen Size” and “Weight”. To demonstrate the advantages of BRB method over the modified ANFIS method, both
methods are applied to the same case.
As discussed in Section 1, “LCD Screen Size” and “Weight” are design attributes of different inherent features, thus it is inappropriate to aggregate them by weighted summation method. In this regard, belief distributions are applied to measure “LCD Screen Size” and “Weight”. To transform the
numerical information of “LCD Screen Size” and “Weight” into belief distributions, the first step is to describe such attributes using a set of levels. In general, it is quite common to differentiate “LCD Screen Size” and/or “Weight” into three levels [24,25]. The three levels of “LCD Screen Size” and “Weight” are shown in Table 1. After investigating “LCD Screen Size” of the notebook computers in
current market, it is found that 8.0 inches is the smallest LCD Screen Size, while 17.3 inches is the
largest, thus, these two figures are described by the level of “Small” and “Large” respectively, while the mid-point of these 2 values, 12.7 inches, is described by “Moderate”. Similarly, regarding “Weight”, 1 kg, 2.32 kg and 3.63 kg are the corresponding values for the level of “Light”, “Moderate” and “Heavy” respectively.
“Table 1”
According to the facts regarding the six notebook computers, namely Brand A-F, the input to the evaluation model of customer attribute “Comfortable-to-Carry” must be the information regarding
the two relevant design attributes “LCD Screen Size” and “Weight”. The information of these two design attributes is summarized in Table 2. By using the method proposed in [27] and the levels defined in Table 1, the numerical values regarding “LCD Screen Size” and “Weight” can be
transformed into belief distribution as reported in Table 3. However, using ANFIS method in [18], “LCD Screen Size” and “Weight” were differentiated into three and five levels respectively, leading
to at most 15 fuzzy rules.
“Table 2” “Table 3”
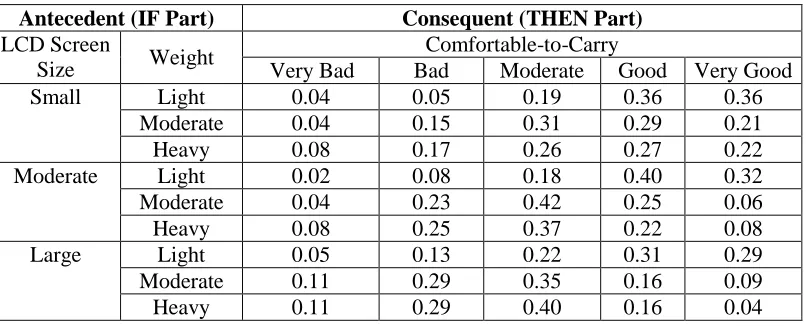
To identify the relation between customer attribute and the two design attributes, customer judgment is collected and then captured in a BRB as shown in Table 4. In Table 4, the first two columns are the antecedents (conditional part) of the belief rules while the last five columns are the
9 belief rules are required where 15 fuzzy rules are needed if ANFIS method is used. For example, the last row represents a belief rule: IF LCD Screen Size is Large AND Weight is Heavy, THEN
Comfortable-to-Carry is {(Very Bad, 0.11), (Bad, 0.29), (Moderate, 0.35), (Good, 0.16), (Very Good,
0.09)}. In addition, due to insufficient knowledge, all the attribute weights and rule weights in the BRB are initially set to 1.
“Table 4”
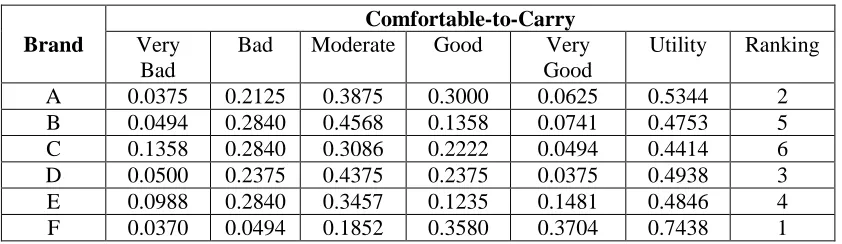
Using the BRB method, the inference result can be conducted and details are summarized in
Table 5. The column “utility” is the overall indicator on “Comfortable-to-Carry” according to the belief degrees assigned to each level of the customer attribute. It is assumed that the utility for the level of “Very Bad”, “Bad”, “Moderate”, “Good”, and “Very Good” are 0, 0.25, 0.5, 0.75 and 1
respectively. On the other hand, based on the survey, user satisfaction towards “Comfortable-to-Carry” is summarized in Table 6. For ease of comparison, the ranking of the six notebook computers
generated by different methods is shown in Table 7.
“Table 5” “Table 6” “Table 7”
In summary, it is found that there are some inconsistencies among the computer ranking generated by BRB method, the survey, ANFIS method, and the raw data as reported in Table 7. To
facilitate further discussion, the raw data in Table 2 is examined. In Table 2, if only “LCD Screen Size” and “Weight” are considered, it is rational to identify that Brand F is the lightest with the
smallest screen size, so it should rank the top in the aspect of “Comfortable-to-Carry”. By logical reasoning, Brand A is better than Brand D as A is lighter than D while both are having the same
screen size. The same logic can be used to differentiate the rest. In summary, in terms of “Comfortable-to-Carry”, the ranking extracted from the raw data regarding the six notebook
computers from the most preferable to the least preferable is: F, A, D, B, C and E.
Therefore, the ranking based on raw data is exactly the same as the ranking generated by BRB
method. The deviation of the ranking generated by the survey and the raw data may due to the customer biases (due to subjectivity or incompleteness), while the difference between the ranking
generated by ANFIS method and the raw data may due to information loss during aggregation process. Therefore, in the first case, it can be seen that BRB method not only can reduce the impact of customer biases, but also can rectify the problem of information loss when applying ANFIS method.
In the first case, both “LCD Screen Size” and “Weight” can be measured in terms of numerical values. However, some other design attributes are too abstract to be measured
quantitatively. To illustrate the capability of BRB method to accommodate different forms of information with different types of uncertainties, another customer attribute, “Appearance Attractiveness”, is examined in this case. As a kind of perception about satisfaction, attractiveness can
be defined as the degree to which a product is pleasing, charming, and arousing interest [9]. Correspondently, two design attributes, “Color” and “Design”, are selected to influence “Appearance Attractiveness” according to customers’ opinions from the survey. It is quite obvious that both “Color” and “Design” cannot be numerically assessed. Therefore, appropriate subjective terms are
selected to measure these design attributes in levels.
Regarding the measure of subjective terms such as “Color” and “Design” of microelectronic
products, a survey was conducted by [4] to capture the feeling of some subjects on the appearance of such products (e.g. notebook computers). In their study, expressive adjectives which are more suitable
for consumer to express their perceptions toward products [24] are used. Based on their factor analysis results, some pairs were found useful and three levels based on the pair of “Vivid-Dull” are used to describe the attribute of “Color”, which can be summarized in Table 8. Regarding the attribute of “Design”, three levels are also used and details are summarized in Table 9.
“Table 8” “Table 9”
Unlike “LCD Screen Size” and “Weight” in the first case, “Color” and “Design” of notebook
computers must be highly dependent on human preference. Therefore, a rationing process is needed to possibly eliminate biases and inconsistencies of customer judgment when specifying belief
distributions to describe “Color” and “Design” of those notebook computers. Taking the design attribute of “Color” as an example, the information gathering process for “Color” of a certain
notebook computer is as follows: a group of customers are invited to assign a belief distribution to describe color of the notebook computer in terms of three levels (Table 8). For the ease of comparison,
their judgments are also indicated by the utility they assigned. For the notebook computer, if there is a pair of judgments with the utility difference larger than the pre-defined threshold, the whole group of
customers is required to re-assign the belief distribution to describe the color of those notebook computers. This rationing process will continue until all the utility differences between any pair of
customer judgments in the same group are smaller than the threshold. The same procedure is repeated for the remaining notebook computers.
that computer. As a result, the information of “Color” and “Design” of the six notebook computers for evaluating “Appearance Attractiveness” can be summarized in Table 10.
“Table 10”
In Table 10, the sum of the degree assigned to “Design” of Brand D is 0.8 < 1, i.e., such judgment is incomplete, which means that the customers are not 100% sure of how much degree
should be assigned to all the three levels regarding “Design” of D. Possibly, the customers cannot reach an agreement on how to assign the remaining degree of 0.2 until they acquire more knowledge
over time.
On the other hand, similar to “Comfortable-to-Carry”, five different grades are used to describe the customer attribute of “Appearance Attractiveness”, i.e.: “Very Bad”, “Bad”, “Moderate”, “Good”, and “Very Good”. After “Color”, “Design” and “Appearance Attractiveness” are described
by subjective terms, the BRB regarding the relation among them can be shown in Table 11 based on the knowledge extracted from the survey.
“Table 11”
Similar to Table 4, each row in Table 11 stands for a belief rule in the BRB, e.g., the last row of the table represents a belief rule: IF Color is Dull AND Design is Standard, THEN Appearance
Attractiveness is {(Very Bad, 0.06), (Bad, 0.19), (Moderate, 0.40), (Good, 0.28), (Very Good, 0.07)}. Note that for the same reason in the first case, all attribute weights and rule weights are initially set to
1. From Table 11, the customers are more likely to choose the notebook computers with “Moderate” color and “Modern” design, the rationality can be explained as follows: in the old days, machine was
mostly made of metals, hence, its appearance was usually grey in color. Therefore, most of the customers in the survey may assume that grey is a standard color of computing machines such as notebook computers. In addition, “Vivid” color may be too sharp for notebook computers which are
of practical uses (e.g. writing reports, surfing the internet, etc) in universities as students normally don't want to attract too much attention from others, especially teachers. “Dull” color may look so
heavy and give an impression of maturity and boredom that young people don't prefer much. As for the attribute of “Design”, young people may be more willing to buy the computers with “Modern”
design, such as the computers with fashionable shape, mirror-like finishing or sandblasted treated
surface, which have a better sense of touching, seeing and even showing off.
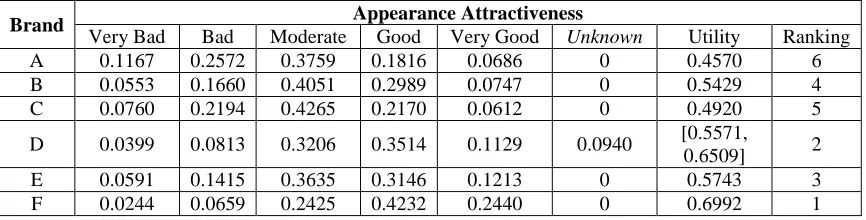
Based on the information reported in Table 10 and Table 11, the inference based on BRB method can be conducted and its details can be summarized in Table 12.
In Table 12, a grade of “Unknown” is used to denote the incompleteness in the information
regarding design attributes of Brand D where there is no incompleteness for other bands. The degree of “Unknown” of Brand D will be reduced when customers have acquired more information over time.
According to the method in [26], the utility computed for each brand is used to describe how well
each brand can satisfy “Appearance Attractiveness” as listed in the “Utility” column. Note that the utility of Brand D is represented by an interval instead of a precise value due to incompleteness. In
this connection, the mid-point of the utility interval is considered as a representative value, thus, the representative utility regarding “Appearance Attractiveness” of Brand D is 0.6040. Therefore, the
ranking of the notebook computers from the most attractive appearance to the least attractive appearance is as follows: F, D, E, B, C and A.
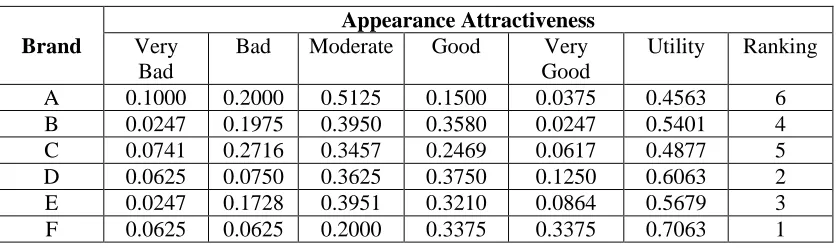
On the other hand, the evaluation on “Appearance Attractiveness” based on the survey can be summarized in Table 13. From Table 12 and Table 13, it can be seen that the ranking based on BRB
method and that from the survey is exactly the same.
“Table 13”
Note that, in both cases, there are some differences between the utilities generated by BRB method and those from survey. Besides the possible biases and inconsistencies of customer judgments, such differences may be also caused by the inaccuracies in determining the parameters of the BRBs,
including weights of different antecedents, weights of different rules, and belief degrees in the consequence part of belief rules. Nevertheless, such parameters can be learned and trained by the
method proposed in [31] with the accumulation of the data from the survey over time. After learning, the inference results based on the trained BRBs will be more practical and realistic.
3.4. Summary
Several major advantages of BRB method over ANFIS method can be highlighted as follows:
3.4.1. The first case
The information aggregated by BRB method is of the same nature. For example, although the
inherent features of “LCD Screen Size” and “Weight” are different, they can be synchronized after the aggregation by BRB method when “Comfortable-to-Carry” is being evaluated.
However, using ANFIS method, the numerical value of “LCD Screen Size” (i.e. inch) and that of “Weight” (i.e. kg) are summed up directly that may not be logical.
With the application of BRB method, the information loss during the evaluation process can
be minimized. For example, ANFIS method could only compute a single score for each
in which an overall utility can be generated regarding a certain customer attribute. Since the belief distribution can capture different forms of information, variations in the evaluation
process can be retained as much as possible. In other words, evaluation problems with dynamic features (e.g. variations in customer judgment over time) cannot be successfully solved by ANFIS method [21], but BRB method is capable of handling such problems.
3.4.2. The Second Case
Different forms of information used to describe design attributes with different kinds of
uncertainties can be modeled and processed by BRB method. For example, “Color” and “Design” need to be described subjectively, and the information regarding “Design” of Brand
D is incomplete. Under this situation, since the required initial knowledge of ANFIS must be
in the form of numerical data [6], ANFIS method is incapable of solving the second case as the design attributes cannot be quantified. In contrast, BRB method can be used to conduct the evaluation even in the presence of subjectivity and incompleteness.
The evaluation result generated by BRB method is more informative than the result generated
by ANFIS method. For example, the incompleteness about “Design” of Brand D can be conveniently reflected by the inference result based on BRB method regarding “Appearance Attractiveness” of Brand D. Possibly, Brand D is a relatively new or obsolete model in the
current market. Given the incompleteness in evaluating Brand D, BRB method is still able to compute the overall utility and the range of utility due to incomplete judgment.
In general, both the limitations of ANFIS method and customer biases (due to subjectivity or incompleteness) can be rectified and reduced by BRB method. Therefore, in evaluating the
performance of consumer products where incomplete or subjective human judgment is commonly observed, BRB method should be able to provide a more rational and diverse means of evaluating the
user satisfaction as compared to ANFIS method.
3.5. Managerial Insights
Given subjective and incomplete information from customers, it is still vital for manufacturer
or service provider to identify the customer preference. In this connection, BRB method can be effectively used to make evaluations and the results can give useful insights about how a certain group of customers may assess a product or service, and how much confidence they might have. Using BRB
method, we can know more about the customers, i.e. what they like and how they like it, in a more rational way. Even customer judgment is not always correct/true, a product or service can be at least
developed to maximize the likelihood of satisfying their needs based on the latest information on hand. Once customers have more knowledge about the product or service, our evaluation will be more
conclusive in configuring the product or service attributes so as to maximize the customer satisfaction.
In this paper, to overcome the limitations of ANFIS method when evaluating the user satisfaction, BRB method is examined. The major advantages of BRB method over ANFIS method
can be summarized as: (1) Belief distribution, which is the basis of BRB method, can accommodate different forms of information regarding design attributes with different types of uncertainties; (2) BRB method can model uncertain knowledge regarding the relation among design attributes and
customer attributes; (3) Under the framework of BRB method, different forms of knowledge can be uniformly transformed into belief distributions, and then handled by the ER approach [30] such that
the information loss during the evaluation process can be minimized; (4) The uncertain information regarding design attributes, the diversity in human perception and the overall impression towards a
single customer attribute can be fully reflected and explained in the evaluation result based on BRB method. To demonstrate the advantages mentioned above, two case studies are presented. The results
show that BRB method is able to provide a more rational process to evaluate user satisfaction with fewer biases, as compared to ANFIS method. Correspondently, the evaluation result generated by
BRB method is more rational and informative than that generated by ANFIS method. In addition, BRB method can also solve evaluation problems which cannot be solved by ANFIS method.
In this study, the connectivity between customer attributes and design attributes is pre-assumed and may not be always true. Hence, the accuracy of our evaluation results would be affected.
Also, our evaluation is mostly based on two customer attributes, and the results may not be comprehensive. Regarding the future research, the link between customer attributes and design attributes will be examined in more details and, in addition to “Comfortable-to-Carry” and “Appearance Attractiveness”, we will consider other customer attributes such as “Quality”, “Performance”, and “User Friendliness” when evaluating user satisfaction towards notebook
computers. Therefore, it is believed that a more convincing measurement of user satisfaction towards notebook computers can be generated by aggregating the evaluation results on all the five attributes
(or even more). Also, such applications could be extended to other electronic products such as mobile phones, tablets, etc.
ACKNOWLEDGEMENT
The work described in this paper was partially supported by a SRG grant from the City University of Hong Kong (Project No. 7002571).
REFERENCES
[1] C.H. Chen, L.P. Khoo, W. Yan, An investigation into affective design using sorting technique and
[2] Y. Chen, J. Tang, R.Y.K. Fung, Z. Ren, Fuzzy regression-based mathematical programming model for quality function deployment, International Journal of Production Research, 42 (2004)
1009–1027.
[3] K.S. Choi, W.H. Cho, S. Lee, H. Lee, C. Kim, The relationships among quality, value, satisfaction
and behavioral intention in health care provider choice: A South Korean study, Journal of Business Research, 57 (2004) 913–921.
[4] M.C. Chuang, Y.C. Ma, Expressing the expected product images in product design of
micro-electronic products, International Journal of Industrial Ergonomics, 27 (2001) 233-245.
[5] R.Y.K. Fung, K. Popplewell, J. Xie, An intelligent hybrid system for customer requirements analysis and product attribute targets determination, International Journal of Production Research, 36
(1998) 13–34.
[6] M. Geethanjali, S.M. Raja Slochanal, A combined adaptive network and fuzzy inference system (ANFIS) approach for overcurrent relay system, Neurocomputing, 71 (2008) 895-903.
[7] A.T. Gumus, A.F. Guneri, F. Ulengin, A new methodology for multi-echelon inventory management in stochastic and neuro-fuzzy environments, International Journal of Production
Economics, 128 (2010) 248-260.
[8] S.H. Han, M.H. Yun, K.J. Kim, J. Kwahk, Evaluation of product usability: Development and validation of usability dimensions and design elements based on empirical models, International
Journal of Industrial Ergonomics, 26 (2000) 477–488.
[9] S.H. Han, M.H. Yun, J. Kwahk, S.W. Hong, Usability of consumer electronic products, International Journal of Industrial Ergonomics, 28 (2001) 143-151.
[10] S.W. Hsiao, H.C. Tsai, Applying a hybrid approach based on fuzzy neural network and genetic
algorithm to product form design, International Journal of Industrial Ergonomics, 35 (2005) 411–428.
[11] S.H. Hsu, M.C. Chuang, C.C. Chang, A semantic differential study of designers’ and users’ product form perception, International Journal of Industrial Ergonomics, 25 (2000) 375-391.
[13] J. Jiao, Y. Zhang, Product portfolio identification based on association rule mining,
Computer-Aided Design, 37 (2005) 149-172.
[14] J. Jiao, Y. Zhang, Y. Wang, A heuristic genetic algorithm for product portfolio planning,
Computers and Operations Research, 34 (2007) 1777-1799.
[15] M.D. Johnson, G. Nader, C. Fornell, C., Expectations, perceived performance, and user satisfaction for a complex service: The case of bank loans, Journal of Economic Psychology, 17 (1996)
163–182.
[16] K. Kim, T. Park, Determination of an optimal set of design requirements using house of quality, Journal of Operations Management, 16 (1998) 569–581.
[17] D.E. Koulouriotis, I.E. Diakoulakis, D.M. Emiris, C.D. Zopounidis, Development of dynamic
cognitive networks as complex systems approximators: validation in financial time series, Applied Soft Computing, 5 (2005) 157-179.
[18] C.K. Kwong, T.C. Wong, K.Y. Chan, A methodology of generating user satisfaction models for new product development using a neuro-fuzzy approach, Expert Systems with Applications, 36 (2009)
11262–11270.
[19] J. Park, S.H. Han, A fuzzy rule-based approach to modeling affective user satisfaction towards office chair design, International Journal of Industrial Ergonomics, 34 (2004) 31–47.
[20] Z.G. Su, P.H. Wang, J. Shen, X.J., Yu, Z.Z. Lv, L. Lu, Multi-model strategy based evidential soft
sensor model for predicting evaluation of variables with uncertainty, Applied Soft Computing, 11 (2011) 2595-2610.
[21] C. Vairappan, H. Tamura, S. Gao, Z. Tang, Batch type local search-based adaptive neuro-fuzzy
inference system (ANFIS) with self-feedbacks for time-series prediction, Neurocomputing, 72 (2009) 1870-1877.
[22] J. Wang, J.B. Yang, P. Sen, Multi-person and multi-attribute design evaluations using evidential reasoning based on subjective safety and cost analysis, Reliability Engineering and System Safety, 52
[23] Y.M. Wang, J.B. Yang, D.L. Xu, Environmental Impact Assessment Using the Evidential Reasoning Approach, European Journal of Operational Research, 174 (2006) 1885-1913.
[24] C.C. Yang, M.D. Shieh, A support vector regression based prediction model of affective responses for product form design, Computers & Industrial Engineering, 59 (2010) 682-689.
[25] J.B. Yang, Y.M. Wang, D.L. Xu, K.S. Chin, The evidential reasoning approach for MCDA under
both probabilistic and fuzzy uncertainties, European Journal of Operational Research, 171 (2006) 309-343.
[26] J.B. Yang, J. Liu, J. Wang, H.S. Sii, H.W. Wang, Belief rule-base inference methodology using
the evidential reasoning approach – RIMER, IEEE Transactions on Systems, Man, and Cybernetics – Part A, 36 (2006) 266-285.
[27] J.B. Yang, Rule and utility based evidential reasoning approach for multiple attribute decision
analysis under uncertainty, European Journal of Operational Research, 131 (2001) 31-61.
[28] J.B. Yang, M.G. Singh, An evidential reasoning approach for multiple attribute decision making with uncertainty, IEEE Transactions on Systems, Man, and Cybernetics, 24 (1994) 1-18.
[29] J.B. Yang, D.L. Xu, On the evidential reasoning algorithm for multiattribute decision analysis under uncertainty, IEEE Transactions on Systems, Man, and Cybernetics - Part A: Systems and
Humans, 32 (2002) 289-304.
[30] J.B. Yang, D.L. Xu, Nonlinear information aggregation via evidential reasoning in multiattribute decision analysis under uncertainty, IEEE Transactions on Systems, Man, and Cybernetics - Part A:
Systems and Humans, 32 (2002) 376-393.
[31] J.B. Yang, J. Liu, D.L. Xu, J. Wang, H.W. Wang, Optimization models for training belief rule based systems, IEEE Transactions on Systems, Man, and Cybernetics – Part A, 37 (2007) 569-585.
[32] J. Zeleznikow, J.R. Nolan, Using soft computing to build real world intelligent decision support
systems in uncertain domains, Decision Support Systems, 31 (2001) 263-285.
[33] Z.J. Zhou, C.H. Hu, D.L. Xu, J.B. Yang, D.H. Zhou, New model for system behavior prediction
Table 1: Levels of LCD Screen Size and Weight
Design Attributes Levels
Small Moderate Large LCD Screen Size (inch) 8.0 12.7 17.3
[image:19.612.94.516.195.250.2]Light Moderate Heavy Weight (kg) 1.0 2.32 3.63
Table 2: LCD Screen Size and Weight of different notebook computers
Design Attributes Brand A Brand B Brand C Brand D Brand E Brand F
LCD Screen Size
(inch) 14.1 15.4 15.4 14.1 15.4 13.3
Weight (kg) 2.4 2.68 2.89 2.41 2.9 1.93
Table 3: Design attributes of six notebook computers in belief distribution
Brand LCD Screen Size Weight
Small Moderate Large Light Moderate Heavy A 0 0.695652 0.304348 0 0.938931 0.061069 B 0 0.413043 0.586957 0 0.725191 0.274809 C 0 0.413043 0.586957 0 0.564885 0.435115 D 0 0.695652 0.304348 0 0.931298 0.068702 E 0 0.413043 0.586957 0 0.557252 0.442748 F 0 0.869565 0.130435 0.295455 0.704545 0
Table 4: Belief Rule Base regarding “Comfortable-to-Carry”
Antecedent (IF Part) Consequent (THEN Part)
LCD Screen
Size Weight
Comfortable-to-Carry
Very Bad Bad Moderate Good Very Good Small Light 0.04 0.05 0.19 0.36 0.36
[image:19.612.95.519.304.413.2] [image:19.612.108.511.466.629.2]Table 5: Inference results of “Comfortable-to-Carry” based on BRB method
Brand
Comfortable-to-Carry
Very Bad
Bad Moderate Good Very Good
Utility Ranking
[image:20.612.97.518.264.386.2]A 0.0496 0.2406 0.4325 0.2248 0.0526 0.5078 2 B 0.0795 0.2677 0.4184 0.1841 0.0503 0.4914 4 C 0.0879 0.2794 0.3976 0.1814 0.0536 0.4870 5 D 0.0530 0.2468 0.4256 0.2239 0.0507 0.5076 3 E 0.0879 0.2794 0.3973 0.1814 0.0540 0.4867 6 F 0.0384 0.2009 0.3768 0.2804 0.1034 0.5357 1
Table 6: Inference results of “Comfortable-to-Carry” based on the survey
Brand
Comfortable-to-Carry
Very Bad
Bad Moderate Good Very Good
Utility Ranking
[image:20.612.172.441.440.551.2]A 0.0375 0.2125 0.3875 0.3000 0.0625 0.5344 2 B 0.0494 0.2840 0.4568 0.1358 0.0741 0.4753 5 C 0.1358 0.2840 0.3086 0.2222 0.0494 0.4414 6 D 0.0500 0.2375 0.4375 0.2375 0.0375 0.4938 3 E 0.0988 0.2840 0.3457 0.1235 0.1481 0.4846 4 F 0.0370 0.0494 0.1852 0.3580 0.3704 0.7438 1
Table 7: Ranking of “Comfortable-to-Carry” generated by different methods
Brand
Ranking generated by
BRB Survey ANFIS Raw data
A 2 2 2 2
B 4 5 5 4
C 5 6 6 5
D 3 3 3 3
E 6 4 4 6
[image:20.612.95.520.601.698.2]F 1 1 1 1
Table 8: Three levels of Color with explanation and example
Level Explanation Example
Vivid The notebook looks more fashionable and attractive with Vivid Color such that it can
easily catch the eyes of users
White, Yellow, Red, Green
Moderate In between of Vivid and Dull Blue, Purple, Grey Dull The notebook looks more professional (or
practical) and stable with Dull Color
Table 9: Three levels of Design with explanation
Level Explanation
Professional The computer looks formal and steady, and the potential customers of this category are business people. Modern The computer looks fashionable and cool, and the
potential customers of this category are young people or students.
Standard There are only very basic elements in the design of the computer, and the potential customers of this category are
[image:21.612.99.514.244.354.2]those who need the computer just to finish their tasks.
Table 10: Information of “Color” and “Design” for evaluating “Appearance Attractiveness”
Brand Color Design
Vivid Moderate Dull Professional Modern Standard
A 0 0.9 0.1 1 0 0 1 1
B 0 0.1 0.9 1 0 0.3 0.7 1
C 0.8 0.2 0 1 0 0.2 0.8 1
D 0 0.2 0.8 1 0.1 0.7 0 0.8
E 0 0.5 0.5 1 0 0.5 0.5 1
F 0.1 0.7 0.2 1 0.6 0.4 0 1
Table 11: Belief Rule Base regarding “Appearance Attractiveness”
Antecedent (IF Part) Consequent (THEN Part)
Color Design Appearance Attractiveness
Very Bad Bad Moderate Good Very Good Vivid Professional 0.04 0.15 0.29 0.34 0.18
Modern 0.06 0.10 0.33 0.36 0.15
Standard 0.08 0.24 0.43 0.20 0.05 Moderate Professional 0.04 0.07 0.21 0.40 0.28
Modern 0.03 0.05 0.25 0.40 0.27
Standard 0.12 0.26 0.37 0.18 0.07 Dull Professional 0.03 0.09 0.29 0.39 0.20
Modern 0.05 0.10 0.37 0.37 0.11
Standard 0.06 0.19 0.40 0.28 0.07
Table 12: Inference results of “Appearance Attractiveness” based on BRB method
Brand Appearance Attractiveness
Very Bad Bad Moderate Good Very Good Unknown Utility Ranking A 0.1167 0.2572 0.3759 0.1816 0.0686 0 0.4570 6 B 0.0553 0.1660 0.4051 0.2989 0.0747 0 0.5429 4 C 0.0760 0.2194 0.4265 0.2170 0.0612 0 0.4920 5
D 0.0399 0.0813 0.3206 0.3514 0.1129 0.0940 [0.5571,
[image:21.612.102.514.388.551.2] [image:21.612.91.524.605.715.2]Table 13: Inference results of “Appearance Attractiveness” based on the survey
Brand
Appearance Attractiveness
Very Bad
Bad Moderate Good Very Good
Utility Ranking