City, University of London Institutional Repository
Citation
:
Einbond, A. & Schwarz, D. (2010). Spatializing Timbre With Corpus-Based
Concatenative Synthesis. Paper presented at the International Computer Music Conference,
ICMC 2010, June 1–5, 2010, New York, USA.
This is the published version of the paper.
This version of the publication may differ from the final published
version.
Permanent repository link:
http://openaccess.city.ac.uk/16732/
Link to published version
:
Copyright and reuse:
City Research Online aims to make research
outputs of City, University of London available to a wider audience.
Copyright and Moral Rights remain with the author(s) and/or copyright
holders. URLs from City Research Online may be freely distributed and
linked to.
SPATIALIZING TIMBRE WITH CORPUS-BASED CONCATENATIVE
SYNTHESIS
Aaron Einbond
Computer Music Center (CMC)
Department of Music, Columbia University, New York
Diemo Schwarz
Ircam–Centre Pompidou CNRS-STMS
1 Place Igor Stravinsky, 75004 Paris
ABSTRACT
Corpus-based concatenative synthesis presents unique possibilities for the visualization of audio descriptor data. These visualization tools can be applied to sound diffusion in the physical space of the concert hall using current spa-tialization technologies. Using CATART and the FTM&CO
library for MAX/MSP we develop a technique for the orga-nization of a navigation space for synthesis based on user-defined spatial zones and informed by the perceptual con-cept oftimbre space. Spatialization responds automatically to descriptor data and is controllable in real-time or can be recorded for later playback. This work has been realized in recent compositions for instruments, electronics, and sound installation using Wave Field Synthesis and Vector-Based
Amplitude Panning. The goal is to place the listener in the
midst of a virtual space of sounds organized by their de-scriptor data, simulating an immersion in timbre space.
1. INTRODUCTION
Composers from Var`ese to Chowning have proposed strate-gies for recording and reproducing spatial trajectories adapted to the spatialization technologies available to them [6, 2]. Recent research involving sound descriptors and the availability of tools for their rapid calculation suggest broad applications for real-time electronic music. It is therefore tempting to look for a model for spatialization taking ad-vantage of this rich source of data.
1.1. Timbre Space
One promising model can be drawn from studies of mu-sic perception: timbre space. According to research by Wessel and Grey, listeners’ grouping of sounds of disparate timbres is consistent with a low-dimensional spatial model [14, 4]. This research prompted Wessel to propose a system that would allow the user metaphorically to “take a walk in timbre space.” 1 Pursuing the implications of this idea, we propose timbre-space as the point of departure for the parametrization of spatial trajectories according to sonic de-scriptor data.
1David Wessel, personal communication.
Taking advantage of the recent technique of corpus-based concatenative synthesis, large databases, orcorpora, of recorded sound can be analyzed, stored, and retrieved based on the descriptors of each sound sample. Descrip-tor data is mapped to a low-dimensional user interface to facilitate the selection and re-synthesis of units. Through a suitable choice of axes, this interface can be mapped to sim-ilar descriptors to those identified by Wessel and Grey for a two- or three-dimensional timbre space.
Beyond this literal application, we have developed tools for more elaborate spatial navigation: multiple sub-corpora can be placed in the navigation space and superposed, allow-ing a more creative mappallow-ing. This organization can be used for both the user interface from which units are synthesized and the spatialization during synthesis. Each sub-corpus can still itself be organized by timbre.
1.2. Corpus-Based Concatenative Synthesis
The concept of corpus-based concatenative sound synthe-sis (CBCS) [9] makes it possible to create music by select-ing snippets of a large database of pre-recorded sound by navigating through a space where each snippet is placed ac-cording to its sonic character in terms ofsound descriptors, which are characteristics extracted from the source sounds such as pitch, loudness, and brilliance, or higher level meta-data attributed to them. This allows one to explore a corpus of sounds interactively or by composing paths in the space, and to create novel harmonic, melodic, and timbral struc-tures while always keeping the richness and nuances of the original sound.
The database of source sounds is segmented into short
units, and aunit selectionalgorithm finds the sequence of
units that best match the sound or phrase to be synthesised, called thetarget. The selected units are then concatenated and played, possibly after some transformations.
CBCS can be advantageously applied interactively using an immediate selection of a target given in real-time as is im-plemented in the CATART system [10] for MAX/MSP with
the extension libraries FTM&COand GABOR,2 making it
possible to navigate through a two- or more-dimensional
projection of the descriptor space of a sound corpus in real-time, effectively extending granular synthesis by content-based direct access to specific sound characteristics.
2. ORGANIZING DESCRIPTOR SPACE
To better control spatialization, zones may be defined corre-sponding to sub-corpora that are spatialized independently. The play position is tracked relative to these zones and this information is used to control sound synthesis.
2.1. Defining Zones by Points and Radius
A simple way of defining zones is to define a number of points pithat give the zone centers, and the zone radius or “influence”ri, as in the famous GRM parameter interpola-tor in the SYTERsystem [13], or several other current im-plementations for MAX/MSP [12, 7], andpMixby Oliver Larkin.3
The squared proximity d2i of point x to each zone i, weighted by influenceriis then calculated as
d2i =(x−pi)
2
r2
i
(1)
This formula is efficiently implemented in FTM&CO
by themnm.mahalanobisexternal.
2.2. Defining Arbitrary Zones
In order to organize a navigation space into several arbitrarily-shaped non-overlapping zones, we present a method that allows one to draw the outline of the zones and then performs an efficient lookup of the zones closest to the navigation position byk-nearest neighbor search in logarith-mic time using akD-tree index [11]. This simplified repre-sentation avoids more complex geometric algorithms such as ray testing or hull calculations. The resulting distances to the closest zones can then be used as an interpolation control (see below).
d12
d1 d2
a b
c x
y
zone 1
zone 2
[image:3.612.59.296.563.680.2]!
Figure 1. Distances of pointxto closest points of two zones.
3http://www.olilarkin.co.uk/index.php?p=pmix
Figure 1 shows two zones, defined by their outline of points, the current positionx, and the distancesd1,d2that
are calculated by the nearest neighbor search. However, in point y, d2 would be wrongly calculated to point cat the
opposite border of zone 2. To avoid this, we find for each closest zone point pi theinduced closest zone points qi jto all other zones j. In the figure, p1=q21=a, p2=c, but
q12=b. These points are then used to calculate the
dis-tances, which are set to zero if the following test finds that we are inside a zone:
Using the law of cosines on the angleαin pointa
cosα=
di j2+d2j−di2
2di jdj
, (2)
and dropping the denominator that doesn’t change the sign, we can test if|α|<90◦, which we take as the approximate criterion that tells us if the current point is beyond zonei’s border seen from zone j:
beyondi j ⇐⇒ di j2+d2j−d2i <0 (3) From this flag, we can also deduce whether the point is inside a zone, namely if it is seen beyond a zone from all other zones. That is, ifbeyondi jis true for all j, the point is within zonei.
The final answer of proximity to a zoneican be either taken directly from the clipped distancedi, or we can again use the law of cosines to calculate a normalized interpola-tion factor fi j between each pair of zones iand j by (see figure 2 for an example):
fi j=
d2i −d2j
2d2i j +
1
2 clipped between 0 and 1 (4)
The used distance values are all known from the calcula-tion of the nearest neighbor and induced closest zone points, and conveniently, themnm.knn andmnm.mahalanobis ex-ternals both output square distances, such that above formu-las can be calculated directly by efficient matrix operations using the FTM&COframework.
The simplicity of our representation of zones as a point contour leads to a low computational complexity of
O(K2logN), withKthe (small) number of zones, andNthe number of points in each zone, orO(KlogN)when the in-duced points are not computed. Conventional ray-tracing point-in-polygon algorithms have a complexity ofO(KN).
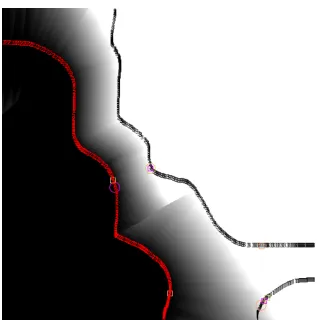
Figure 2. Map of the interpolation factor f23as greyscale
values (black is one).
point is never hidden beyond the zone borders from all other zones.
2.3. Interpolation Between Zones
We now turn to the use of the zones defined above for the organization of the sound space by assigning a sub-corpus to each zone. Given a position between zones (separate as shown above or possibly overlapping as when defining lay-ers at different heights of the space), there are several ways to interpolate between the corpora assigned to each zone: First, the selection can take place independently in each corpus, and the resulting sounds are mixed with levels anti-proportional to the distance. Second, when mixing sounds is not desired, we can perform a selection in each corpus, and then choose randomly between the selected units with probabilities anti-proportional to the distances. Generaliz-ing this to random selection interpolation between several zones is possible using a distance-mapping function. This function maps the distances to zones to a likelihood, start-ing at 1 for 0 distance, and descendstart-ing to 0 at a cutoff dis-tance. The mapped distance values need to be normalized to sum 1 to become a PDF (probability density function), from which we calculate the cumulative sum to obtain the CDF (cumulative density function). We then draw random bin indices accordingly by accessing the CDF by a uniformly distributed random value. This method is implemented in
themnm.pdfabstraction.
3. DESCRIPTOR-BASED SPATIALIZATION
CATART has powerful capabilities for real-time synthesis in live performance [10, 3]. A live audio signal can be an-alyzed for its descriptor content and used to power the syn-thesis from a pre-recorded corpus, or itself to define a new corpus. A mouse, drawing tablet, or other controller can be
used to navigate through a corpus based on its two- or three-dimensional spatial layout. Both a single corpus organized by timbral descriptors, and multiple sub-corpora arranged in a more complex navigation space, can be mapped to a corresponding live spatialization system.
Synthesis can be spatialized according to a single-source or multi-source metaphor. In the former, the output of CATART is conceived of as an “instrument” with a move-able spatial location unique at any moment. In the latter, a CATART corpus is envisioned as collection of instruments, each with a fixed location, excited by a metaphorical body moving through the space.
In addition to real-time capabilities, the catart.select.re-cordmodule can be used to record the timing of grain se-lection and descriptor data to an SDIF file which can then be played back in deferred time [3]. Using the spatial map-ping described, this presents a technique for recording and reproducing spatial trajectories.
3.1. Single-Source Model
A single-source model is well-suited to a spatial implemen-tation usingWave Field Synthesis(WFS). The mono output of CATART is treated as apoint sourceby the WFS system. With each grain selection, descriptor coordinates are sent to the WFS system normalized to a range chosen by the user. By default the ranges correspond to the current values of CATART’s 2D interface.
3.1.1. Break
This model was used in Aaron Einbond’s Break for bari-tone saxophone and live electronics, written for saxophonist David Wegehaupt and premiered at the Technische Univer-sit¨at, Berlin, at theLange Nacht der Wissenschaften, 2008. Using the WFS system at the TU powered by WONDER
software [1], corpora of pre-recorded saxophone samples were selected for re-synthesis and moved about the two-dimensional plane of the WFS system according to the real-time descriptor analysis of the live saxophone. Short sam-ples containing rapid, dry attacks, such as close-miked key-clicks, were especially suitable for a convincing impression of motion of the single WFS source. The effect is that of a virtual instrument moving through the concert hall in tan-dem with changes in its timbral content, realizing Wessel’s initial proposal.
3.2. Multi-Source Model
For a multi-source spatial model, the CATART synthesis module catart.synthesis is replaced with catart.synthesis.
multi. This module receives a vector of channel numbers
and amplitudes, such as Vector-Based Amplitude Panning
of FTM&CO’s overlap-add modulegbr.ola, each CATART grain is re-synthesized in a multi-channel system with its amplitude scaled according to VBAP coefficients. In this way an arbitrary number of grains can be simultaneously reproduced with distinct virtual positions (see Figure 3).
Figure 3. Screenshot of CATART connected to vbapand
ambimonitorto control spatialization in eight channels.
3.2.1. What the Blind See
This multi-source model was realized in Einbond’s What
the Blind Seefor bass clarinet, viola, harp, piano,
percus-sion, and live electronics commissioned by IRCAM/Centre-Pompidou for Ensemble l’Instant Donn´e at the Agora Festi-val 2009. An eight-channel system was arranged in a near-circle around the audience. As inBreak, two-dimensional VBAP coefficients were calculated in real time correspond-ing to the descriptor values of CATART grains. Each grain was synthesized to occupy a distinct virtual position for its duration, in general overlapping with other grains in other positions. This model was well-suited to corpora of percus-sion samples, each grain with a sharp attack and long decay that continued playing as new grains were added.
4. DISCUSSION
Moving beyond a literal timbre space model, the tools de-scribed could be easily adapted to navigation spaces that ro-tate, deform, and respond live in performance, creating a dynamic approach to spatial mapping. The organization of the navigation space into zones is to be used in the inter-active sound installationGrainstick[5] by composer Pierre Jodlowski, utilizing IRCAM’s WFS system, and suggests rich possibilities for future work beyond the concert hall.
5. ACKNOWLEDGEMENTS
We thank Eric Daubresse, Sylvain Cadars, Jean Bresson, Emmanuel Jourdan, Pierre-Edouard Dumora, Florian G¨oltz, Eckehard G¨uther, Wilm Thoben, Volkmar Hein, Stefan
Wienzierl, John MacCallum and David Wessel. The work presented here is partially funded by theAgence Nationale
de la Recherche within the project Topophonie,
ANR-09-CORD-022.
6. REFERENCES
[1] M. Baalman and D. Plewe, “Wonder - a software in-terface for the application of wave field synthesis in electronic music and interactive sound installations,”
inProc. ICMC, Miami, USA, 2004.
[2] J. Chowning, “The simulation of moving sound sources,”JAES, vol. 19, no. 1, 1971.
[3] A. Einbond, D. Schwarz, and J. Bresson, “Corpus-based transcription as an approach to the composi-tional control of timbre,” inICMC, Montr´eal, 2009.
[4] J. M. Grey, “Multidimensional perceptual scaling of musical timbres,”J. Acoust. Soc. Am., vol. 61, 1977.
[5] G. Leslieet al., “Grainstick: A collaborative, interac-tive sound installation,” inProc. ICMC, NYC, 2010.
[6] V. Lombardoet al., “A virtual-reality reconstruction
ofPome lectroniquebased on philological research,”
Computer Music Journal, vol. 33, no. 2, 2009.
[7] A. Momeni and D. Wessel, “Characterizing and con-trolling musical material intuitively with geometric models,” inProc. NIME, Montreal, Canada, 2003.
[8] V. Pulkki, “Virtual sound source positioning using vec-tor base amplitude panning,” JAES, vol. 46, no. 6, 1997.
[9] D. Schwarz, “Corpus-based concatenative synthesis,”
IEEE Sig. Proc. Mag., vol. 24, no. 2, Mar. 2007.
[10] D. Schwarz, R. Cahen, and S. Britton, “Principles and applications of interactive corpus-based concatenative synthesis,” inJIM, GMEA, Albi, France, Mar. 2008.
[11] D. Schwarz, N. Schnell, and S. Gulluni, “Scalability in content-based navigation of sound databases,” inProc. ICMC, Montr´eal, Canada, 2009.
[12] M. Spain and R. Polfreman, “Interpolator: a two-dimensional graphical interpolation system for the si-multaneous control of digital signal processing param-eters,”Organised Sound, vol. 6, no. 02, 2001.
[13] D. Teruggi,Vortr¨age und Berichte (eds.) Neue
Musik-technologie II. Schott Musik International, 1996, ch.
The technical developments in INA-GRM and their in-fluences on musical composition.