An Evaluation on Library Services Using Servqual Method Made HeryWihardikaGriadhi1
1Library Sciences, Library Department, Undiksha
Abstract.after The aim of this study was to identify the quality and effectiveness of the services provided by the library using Servqual Method, which covered several variables, namely: tangible, reliability, responsiveness, assurance and empathy. The reached population were UNDIKSHA students who were already members of the library, this study was designed as quantitative evaluative research which analyzed the quality and effectiveness of the services provided by the library by analyzing the role of each factor based on Servqual Method. Data were collected using questionnaire with Likert Scale. The data obtained were analyzed in a descriptive quantitative way using Glikman’s Quadrant Analysis. The impact of this research for Undiksha Library is able to provide information about the quality and effectiveness of existing service programs and can be used as input to develop strategies for developing the Undiksha library services. The results showed the quality of each variable is as follows: overall the result of quality measurement service in Undiksha library based on servqual variable is in good quality, but still need improvement in tangible variable especially in terms of physical facility and library collection, reliability variable still need improvement on indicator accuracy of information. Responsiveness Variable still need improvement especially in terms of hospitality librarian, Assurance Variables still need improvement in indicator of knowledge and skill of librarian. Level of effectiveness of library service of University of Education Ganesha, Based on the direction of score T of indicator in each variable; tangible variable show effective category, variable of reliability less effective, responsiveness variable show effective, anssurance vriabel are effective and emphaty variables show less effective.
1. Introduction
Servqual method is a deskrtiptive method developed to know the quality of service presented to the customer. The method was developed in 1985 by Parasuraman, Valarie A. Zeithaml, and Leonard L. Berry, then the method was revised back to them in 1988 published in the Journal of Retailing which concluded that servqual is a measure of how well a service meets expectations customer. The very poluler concept of service quality measurement is the Serv Qual concept developed by Parasuraman. There are five dimensions that influence to the quality of services consists of: (1) tangible (direct evidence) includes: physical facilities, equipment, employees, and means of communication; (2) reliability, includes: the ability to provide promptly, accurately, and satisfactorily promised services; (3) responsiveness, includes: the willingness of staff to assist customers and provide responsive services; (4) assurance, including: knowledge, competence, courtesy, and credibility of staff, free from harm, risk, or doubt; (5) empathy, including: ease of relationship, good communication, personal attention, and an understanding of the individual needs of the customer.
From the results of preliminary observations found statistical data utilization of Undiksha library by students are as follows; the average daily student visit to the Undiksha Library is in the range of 150 students. this can be seen from the data of the quantity of visits in 2014 as much as 36,457 people and in 2015 as many as 37,625 people (statistics visit library Undiksha 2014-2015). For the membership of the library, in 2014 as many as 7681 and in 2015 as many as 7862 people (library member statistics 2014-2015) of the total quantity of students in 2014 as much as 13472 people and in 2015 as many as 13878 people, it means that the library members are approximately half of the total quantity of students. From this data can be explained that the level of visits to the library by students is still relatively low. Based on such conditions it is necessary to assess the level of service quality and effectiveness of library services with servqual method. Problems that arise related to the application of servqual method to measure the quality and effectiveness of the library service in accordance with the variables contained in the servqual method is; How is the quality and effectiveness of tangible variables, reliability, responsiveness, assurance, and empathy of services organized by Undiksha library?
The purpose of this research is to know the quality and effectiveness of servqual variable, including tangible variable, reliability, responsiveness, assurance, and emphaty of service organized by Undiksha library. The population in this study is all students of Undiksha as the target and the affordable population is the Undiksha students who have become members of the library with the assumption that the students who have become members of the library have visited and utilize the library facilities Then the selection of students who visit the library in six month of each month is more than 4 (four) times. From 7862 the quantity of the students who are members of the library will be sampled by 350 students. This is done with the opinions of Krecjek and Morgan (in Fernandez, 1988)
accordance with servqual model (tangible, reliability, responsivenes, assurance, and emphaty). Quantitatively, the evaluation process is done by emphasizing the objectivity, reliability, and validity of measurement, which is focused on data in the form of numbers. For that data collection using a questionnaire-shaped instrument with Likert scale.
2. Results
2.1 Data Description of Tangible Variablea. a. Facilities Physical Library
Table 2.1 Conversion The physical facility of the library Score Score Criteria F P (%)
41 – 50 Very high 166 47.43 31 – 40 High 155 44.29 21 – 30 Medium 29 8.29
10-20 Low 0 0
0 – 10 Very Low 0 0
Based on the conversion table, 47.43% of samples stated that the quality of library physical facilities in the category is very high, 44.29% of samples stated the physical facilities of the library in the category of high, 8.29% of sample stated the quality of library physical facilities in moderate category, and 0% there are the sample states the quality of the physical facilities of libraries in low and very low categories. The average score of the quality of library physical facilities is 39.52 is in high criteria.
b. Library CollectionsTable
Tabel 2.2 Conversion of library collection scores Score Criteria F P (%) 41 - 50 Very high 128 36.57 31 - 40 High 190 54.29 21 - 30 Medium 32 9.14
10-20 Low 0 0
0 – 10 Very Low 0 0
Based on the conversion table, 36.57% of samples stated the quality of library collection in very high category, 54.29% of samples stated the quality of library collections in high category, 9.14% of samples stated the quality of library collection in moderate category, and 0% (none) the sample states the quality of library collections in the category of low and very low. The average score of library quality is 36,27 in high criteria. c.Supporting Facilities Library Services
Table 2.3 Conversion indicator of service support facilities score Score Criteria F P (%)
41 - 50 Very high 167 47.71 31 - 40 High 154 44.00 21 - 30 Medium 29 8.29 .10-20 Low 0 0 0 – 10 Very Low 0 0
Based on the conversion table, 47.71% of samples stated that the quality of library service support facilities in the category is very high, 44.00% of samples stated the quality of library service support facilities in the category of high, 8.29% of sample stated the quality of library service support facilities in moderate category, 0% the sample states the quality of library service support facilities in the low category, and 0% sample states the quality of library service support facilities in the category is very low. The average score of quality of library service support facilities that is 41,24 is in very high criteria.
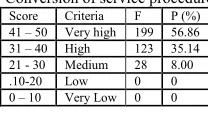
[image:2.482.108.212.519.576.2]2.2. Data Description Of Reliability Variable a. Library Service Procedures
Table 2.4 Conversion of service procedure indicator scores Score Criteria F P (%)
41 – 50 Very high 199 56.86 31 – 40 High 123 35.14 21 - 30 Medium 28 8.00 .10-20 Low 0 0 0 – 10 Very Low 0 0
b. Accuracy of Information
Table 2.5 Conversion indicator accuracy of information score
Score Criteria F P (%)
41 – 50 Very high 180 51.43
31 – 40 High 101 28.86
21 – 30 Medium 69 19.71
.10-20 Low 0 0
0 – 10 Very Low 0 0
Based on the conversion table, 51.43% of samples stated the accuracy of the information in the category is very high, 28.86% of the sample stated the accuracy of the information in the high category, 19.71% of the sample stated the accuracy of information in moderate category, and 0% there are the samples state the accuracy of the information in the low and very low categories. The average score of information accuracy of 34.93 is in high criteria.
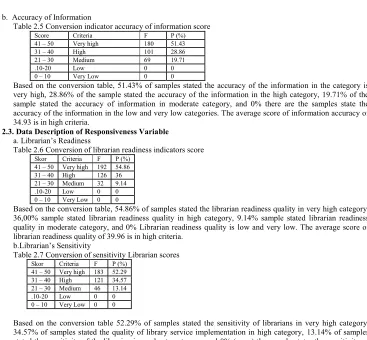
2.3. Data Description of Responsiveness Variable a. Librarian’s Readiness
Table 2.6 Conversion of librarian readiness indicators score Skor Criteria F P (%)
41 – 50 Very high 192 54.86 31 – 40 High 126 36 21 – 30 Medium 32 9.14 .10-20 Low 0 0 0 – 10 Very Low 0 0
Based on the conversion table, 54.86% of samples stated the librarian readiness quality in very high category, 36,00% sample stated librarian readiness quality in high category, 9.14% sample stated librarian readiness quality in moderate category, and 0% Librarian readiness quality is low and very low. The average score of librarian readiness quality of 39.96 is in high criteria.
b.Librarian’s Sensitivity
Table 2.7 Conversion of sensitivity Librarian scores Skor Criteria F P (%)
41 – 50 Very high 183 52.29 31 – 40 High 121 34.57 21 – 30 Medium 46 13.14 .10-20 Low 0 0 0 – 10 Very Low 0 0
Based on the conversion table 52.29% of samples stated the sensitivity of librarians in very high category, 34.57% of samples stated the quality of library service implementation in high category, 13.14% of samples stated the sensitivity of the librarian in moderate category, and 0% (none) the sample states the sensitivity of librarian libraries in low and very low categories. The average score of sensitivity of librarian quality is 37,43 is in high criterion.
c.. Hospitality of Librarians
Table 2.8 Conversion indicator of hospitality librarian score Skor Criteria F P (%)
41 – 50 Very high 91 26.00 31 – 40 High 136 38.86 21 – 30 Medium 123 35.14
.10-20 Low 0 0
0 – 10 Very Low 0 0
Based on the conversion table, 26.00% of samples indicate the quality of hospitality of librarians in very high categories, 38.86% of samples expressed hospitality librarians in high category, 35.14% of samples stated the quality of librarian hospitality in moderate category, and 0% the sample states the hospitality of librarians in the low and very low categories. The average score of hospitality of librarians of 32.21 is in high criteria.
2.4. Data Description of Assurance Variable a. Librarian's Knowledge
Table 2.9 Conversion of indicators of knowledge of librarians score Score Criteria F P (%)
41 - 50 Very high 154 44.00 31 - 40 High 123 35.14 21 - 30 Medium 73 20.86
.10-20 Low 0 0
0 – 10 Very Low 0 0
of samples stated the knowledge of librarian knowledge in moderate category, and 0% (not there is) the sample states the quality of knowledge of librarians in low and very low categories. The average score of librarian knowledge quality of 32.57 is in high criteria.
b. Librarian’s Skills
Table 2.10 Conversion of Librarian skill indicator scores Score Criteria F P (%)
41 - 50 Very high 152 43.43 31 - 40 High 124 35.43 21 - 30 Medium 74 21.14
.10-20 Low 0 0
0 – 10 Very Low 0 0
Based on the conversion table, 43.43% of samples indicate the quality of librarian skills in the category is very high, 35.43% of samples express the quality of librarian skills in the high category, 21.14% of the sample states the quality of librarian skills in moderate category, and 0% Librarian skills are low and very low. The average score of skill quality of librarian is 38,29 is in high criterion.
c. Courtesy of librarian
Table 2.11 Conversion of courtesy indicator score Score Criteria F P (%)
41 – 50 Very high 130 37.14 31 – 40 High 165 47.14 21 – 30 Medium 55 15.71 .10-20 Low 0 0 0 – 10 Very Low 0 0
Based on the conversion table, 37.14% of samples stated the quality of courtesy of librarians in very high category, 47.14% of samples stated the quality of civility librarians in high category, 15.71% of samples stated the quality of librarian politeness in moderate category, and 0% the sample declares the librarian's modesty in the low and very low category. The average score of courtesy quality of librarians is 38,29 are in high criterion.
d. Insights of Librarian
Table 2.12 Conversion Score Indicator Insights Librarian
Based on the conversion table, 41.14% of the sample stated that the insight of librarians in the category is very high, 44,00% of samples stated the quality of librarian insight in high category, 14,86% sample stated librarian insight quality in moderate category, and 0% the sample states the insight of librarians in low and very low categories. The average score of librarian insight quality of 42.33 is in very high criteria.
3.5. Data Description of Emphaty Variable a. The sincerity of the Librarian
Table 2.13 Conversion of sincerity indicator scores Score Criteria F P (%) 41 – 50 Very high 231 51.33 31 – 40 High 167 37.11 21 – 30 Medium 52 11.56
.10-20 Low 0 0
0 – 10 Very Low 0 0
Based on the conversion table, 51.33% of samples stated that the quality of the librarian's seriousness in the category is very high, 37.11% of the sample stated librarian's seriousness in high category, 11.56% of samples stated the quality of the librarian's seriousness in moderate category, and 0% the sample states the sincerity of the librarian in the low and very low category. The average score of the quality of the librarian's sincerity of 38.29 is in high criteria.
b.Librarian's Concern
Table 2.14. Conversion Concern indicator score Score Criteria F P (%) 41 – 50 Very high 196 49.25 31 – 40 High 161 40.45 21 – 30 Medium 41 10.30 .10-20 Low 0 0 0 – 10 Very Low 0 0
Based on the conversion table, 49.25% of samples stated that the quality of Concern of librarians in the category is very high, 40.45%% of samples express the quality of the librarian's care in the high category, 10.30% of samples stated the quality of the librarian's care in moderate category, and 0% the sample states the concern of librarians in low and very low categories. The average score of the quality of care of librarians is 42.33 is in very high criteria.
2. Discussion
The tangible variable for the physical facility quality of the library based on the average score of 39.52 is in the high criterion. this means that students as library users mostly feel comfortable in the library and utilize all the facilities of library services that already meet the requirements of service standards and yet still need improvement especially in terms of the provision of reading room and collection space are still many who feel less widespread Then to the quality of the library collection shows the average score of the quality of the library collection that is equal to 36.27 are in high criteria. It means that the quality of the collection has been able to meet the needs of students but still needs to be improved especially in terms of diversity of collections including books collection of entertainment that needs to be improved. As for the supporting facilities Library services based on the average score of the quality of library service support facilities that is equal to 41.24 are in very high criteria. It can be said that the facilities and infrastructure owned by the undiksha library already meet the adequate standards in support of providing excellent service,
The Data description of reliability variable for library service procedure, shows the average score of service procedure quality that is equal to 41,59 is in very high criteria. it means the service procedure provided is very good. Excellent procedures that include the mechanism of library services has been done quickly precise and cheap, done professionally, referring to the existing library rules, implemented with orientation on the interests of users effectively and efficiently, referring to the standard library services. For the indicator of the accuracy of information The average score of 34.93 is in high criteria. this indicates the accuracy of information provided by the library services is good but needs to be improved in many ways, the accuracy of information can be improved in terms of provision of information on OPAC (online public acssess cataloque) which ensures the students know with certainty the condition of library materials, while much information is presented in OPAC is not in accordance with the fact both in terms of the number of books that still exist and the existence of the required collection of students, accuracy in terms of recording lending transactions and return of books in some cases still encountered mismatch between the data base with print out data brought by students. Therefore it is necessary to improve the quality of service in the field of information accuracy
Responsiveness variable for librarian readiness indicator shows the average score of librarian readiness quality that is equal to 39,96 is in high criterion. This means that librarians are ready in organizing library services. Readiness is meant among librarians in implementing library services have been done quite professional, but still need to be enhanced through the training or technical guidance of the field of library services, For sensitivity indicator Librarian, shows the average score of sensitivity of librarian quality that is equal to 37.43 are in the criteria high. which means librarians or librarians have shown sensitivity to the meaning in various matters concerning the smoothness of service implementation, librarians are always sensitive to the needs of students will the information required is usually done by providing direction and instructions and explanation of the use of the library. However, it still needs to be improved. Medium for the indicator of hospitality Librarians show the average score of hospitality librarian that is equal to 32.21 is in high criteria, it illustrates that in terms of hospitality librarians or librarians already meet the expectations of users but still need to be improved, need to civilize the librarian to greet visitors and treats visitors with hospitality so that the visitors feel comfortable and cared for, the habit of smiling and giving polite reply to the visitors need to be cultivated
The Data description of Assurance Variable for Librarian Knowledge indicator shows the average score of quality of 32,57 is in high criterion. The meaning of librarian knowledge in various fields concerning library services is good enough but still needs to be improved. For Librarian Skills indicator shows an average score of 38.29 are in high criteria. this illustrates the skills of librarians is sufficient enough in organizing library services. However, there are still opportunities to be improved, increasing the skill of information technology midwife is very relevant. As for indicators of Courtesy Librarian, based on the average score of courtesy quality librarian that is equal to 38.29 are in high criteria. in the sense that the courtesy of the librarian in organizing the library services received appreciation from the students as the user is good enough, but still need improvement. For insight indicators Librarians based on the average score of insight quality librarian that is equal to 42.33 are in very high criteria. this illustrates that in carrying out librarian libraries libraries already have a very good insight into various things about libraries with different dimensions of service
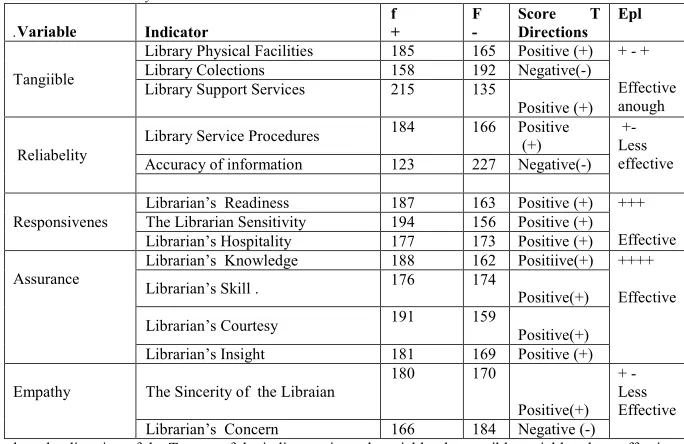
To know the effectiveness level of library service of Undiksha, beside conducted with quantitative univariate descriptive analysis, also using T score analysis. T score analysis is done to tangible, reliability, responsiveness, assurance and empaty variable according to the following table:
Table 3.1 The results of data analysis of variable tangible, reliability, responsivesess, assurance, foury Undiksha library service in 2016
.Variable Indicator f + F - Score T Directions Epl
Tangiible
Library Physical Facilities 185 165 Positive (+) + - +
Effective anough
Library Colections 158 192 Negative(-)
Library Support Services 215 135
Positive (+)
Reliabelity Library Service Procedures
184 166 Positive
(+) +- Less effective Accuracy of information 123 227 Negative(-)
Responsivenes Librarian’s Readiness 187 163 Positive (+) +++ Effective The Librarian Sensitivity 194 156 Positive (+)
Librarian’s Hospitality 177 173 Positive (+)
Assurance Librarian’s Knowledge 188 162 Positiive(+) ++++ Effective
Librarian’s Skill . 176 174 Positive(+)
Librarian’s Courtesy 191 159 Positive(+)
Librarian’s Insight 181 169 Positive (+)
Empathy The Sincerity of the Libraian 180 170
Positive(+) + - Less Effective Librarian’s Concern 166 184 Negative (-) Based on the direction of the T score of the indicators in each variable, the tangible variables show effective categories, less effective reliability variables, responsiveness variables, effective. Anssurance variables are effective and emphaty variables show less effective.
3. Conclusion
From result of analysis and discussion hence can be drawn conclusion as follow:
1) The quality of tangible variables from library services with indicators of library physical facilities, library collections and service support facilities are high to very high with effectiveness levels being effective. 2) The quality of variable reliability of the library service with the indicator of service procedures and the
accuracy of information is in the category very high with the level of effectiveness are in less effective category,
3) The quality of variable rensponsiveness with indicator readiness, sensitivity and hospitality of librarians are in the category of high with the effectiveness level in effective category,
4) The quality of assurance variables with indicators of knowledge, skills and modesty of librarians are in high category while insight librarians are categorized very high in effectiveness of variable assurance is in effective category.
5) Foury variable quality with indicator of sincerity and care of librarians are in high and very high category, while for the effectiveness level is in effective category.
Bibliography
Asogwa, Brendan E; Asadu, Boniface U; Ezema, Jonas U; Ugwu, Cyprian I, PhD; Ugwuanyi, Ferdinand C. Library Philosophy and Practice; Use of ServQUAL in the Evaluation of Service Quality of Academic
Libraries in Developing Countries Lincoln (Aug 2014): 0_1,1-25. Proquest (https://e-resources.perpusnas.go.id:2171/docview/1738007975?pq-origsite=summon)
Arshad, Alia; Ameen, Kanwal, 2011. Reality versus Expectations: A Survey of University of the Punjab's Libraries Using SERVQUAL .Library Philosophy and Practice; Lincoln (Sep 2011): 1-13. Proquest (https://eresources.perpusnas.go.id:2171/docview/900093231/fulltext/6E157656F244F1CPQ/1?accountid= 25704
[image:6.482.96.438.126.348.2]S.M. Zabed Ahmed; Md. Zahid Hossain Shoeb. Measuring service quality of a public university library in Bangladesh using SERVQUAL, Performance Measurement and Metrics; Bradford 10.1 (2009): 17-32. Proquest (https://e-resources.perpusnas.go.id:2171/docview/223663749?pq-origsite=summon)
Tripalupi,LE. &kadek Rai Suwena,2014. Statistika Dilengkapi dengan Pengenalan Statistk dalam Analisis SPSS, Yogyakarta: Graha Ilmu,