International Journal of Innovative Technology and Exploring Engineering (IJITEE) ISSN: 2278-3075, Volume-8 Issue-8, June 2019
Abstract: Image Segmentation has always been a problem of interest and the challenging task in the field of the computer-based vision system. It plays a vital role in the field of object detection and recognition. Identifying with separating a part of the interest from a complicated image is easy for the human vision system, but the same is cumbersome to automate. The proposed work is a novel combined technology for fast segmentation of foreground (area of interest) out of an image which possesses a background and other complications. This work utilizes the latest industrial class technologies with advanced algorithms. Our approach remarkably increased the performance by working on a super-pixelated image rather than a normal n x n pixel image. The proposed work is mainly focused on interactive segmentation. This could be actively used in fields like the medical analysis. Our segmentation technique is a binary segmentation where it classifies pixels into two distinct sets. The proposed scheme is experimentally shown to compare favorably with contemporary interactive image segmentation schemes when applied to colored and gray-scale images.
Index Terms: Boykov-Kolmogorov algorithm, Computer Vision, CIDE2000, CIELab, Foreground Extraction, Image Segmentation, Image separation, Super-pixels, Min-cut/Max-flow algorithm.
I. INTRODUCTION
Images play a vital role in multimedia and human-computer interactions. Understanding an image and extracting its context is always a very interesting and useful problem domain in the computer-based vision system. Image segmentation helps in extracting an area of interest within an image. Therefore segmentation assists in analyzing the context and meaning of an image; this is trivial for the human visual system but cumbersome for the computer. The proposed work involved with a technique to extract an area within the image, or simply arranging pixels within an image into two regions foreground and background. Given an image, the system should classify the pixels into two or more classes, where each class contains pixels with common characteristics and spatial relationship. Separating or simplifying the representation of an image will do many contributions towards the later review of the image. Segments will be more meaningful than a whole image which may contain more irrelevant information as a whole. Partitioning an image into smaller segments will also enhance the running time requirements of the algorithms
Revised Manuscript Received on June 07, 2019.
Dinesh Naik, Department of Information Technology, National Institute of Technology Karnataka, Surathkal Mangalore, India
Muhammed Shameem P.K, Department of Information Technology, National Institute of Technology Karnataka, Surathkal Mangalore, India.
which are later used for the analysis. A good segmentation algorithm will simply discard all the unwanted data within an image and will provide us with vital and important details. This process has its significance in fields such as medical image examination. Running a segmentation algorithm over an image will have to scan through all of the pixels (length X width) at least once. Our approach removes this overhead by introducing Superpixels [1] into the segmentation algorithm. Superpixels are a small collection of pixels which share common properties. Image Segmentation becomes difficult when the background is heavily textured or when there is not much difference between background and foreground pixels. Therefore simple color or the spatial relationships can't be used for the segmentation; a hybrid approach should be formulated. Our approach resolves both the above-stated challenges. Even though graph-based segmentation algorithms [12] are not very new, studies making use of the super-pixels are not so common among them. In our work, we make use of super-pixels in an effective way. In existing methods, very good numbers of image cues have been taken into consideration for analyzing the relationship between two pixels/Superpixels. The approach make use of CIEDE2000
[7] formula for the comparison between two
pixels/Superpixels. The implementation of graph-based segmentation algorithm by utilizing the idea of Superpixels and CIEDE2000 formula makes our work significant and original. Using the full potential of CIEDE2000 color difference technique and Superpixels gave innovative and motivating results. Converting the image into Superpixels before the partitioning algorithm gave a distinctive running time reduction. The method proposed has also tried with different color spaces to find the best segmentation [9, 10] possibilities.In this work, we have achieved the following:
1. Modeling an image into Superpixels and then mapping the same into a graph structure. The approach labeled pixels using SLIC, which is proven to be the best super-pixelization method for CIEL*a*b* color space [13].
2. The approach gives a clear distinction between various color spaces and their impact on the algorithm.
3. The proposed approach demonstrated the remarkable contribution of super-pixelization on the run time of the partitioning algorithm.
4. The proposed method showed that CIEDE2000 color difference formula outperforms the naive approaches in finding similarity between two Superpixels.
Fast Interactive Superpixel Based Image
Region Generation
5. The proposed approach clearly described the trade-off between various graph partitioning algorithms and runs Boykov Kolmogorov graph partitioning algorithm [4] for the final segmentation.
II. BACKGROUNDWORK
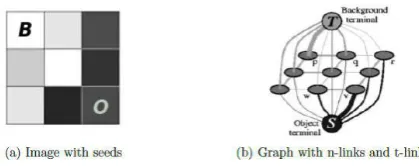
The proposed framework is the graph-based processing of pixels and other terminologies associated with such a concept. The method used with a directed weighted (capacitated) graph, G = (V, E) where V is having nodes set and E that having edges connecting them. The concepts of nodes are termed in terms of image pixels, voxels, and other specific image cues associated with an image. In a Computer vision based system, additional special nodes on the graph are interpreted as terminal nodes are the set of labels designated to pixels. In a chosen two terminal graph, Source s and Sink t graph as shown in Fig.1 (a). The notion that the assigned cost (weight) of the edges may not be the same from the one node to another and vice-versa. In a computer vision based system, the graph edges could be designated as n-links and t-links, respectively where n-links is the connecting pair of pixels/voxels as the discontinuity penalty between those pixels. The costs are considered in the pixel interaction term B (A) mentioned in the equations below. The t-links generated from the data term R (A) is the connecting link between terminal label pixel and cost corresponds to a penalty for terminal label and pixel.
a) A Graph G
b) A Cut on G
Fig. 1: A graph and Cut
A. Min-Cut /Max-Flow Problem
The proposed method makes use of the algorithm mentioned. Theoretically, the algorithm explains the amount of flow between source and sink is equal to the total weight of the edges in the minimum cut. Therefore any cut on a given graph having two labeled terminals is two disjoint subsets; say S and T with both terminals in these two subsets. Any cut cost is computed as the sum of weights of any boundary edges. A minimum cut is a cut with the minimum cost. The method [6] states that a maximum flow from the source terminal to sink terminal saturates a set of edges in the given graph partitioning nodes into two disjoint sets corresponding to a minimum cut. Thus, the above problems are dual to each other. Fig.1 is an example of a directed graph and possible
cut on the network.
B. Graph-Cut Image Segmentation BK-ND
Yuri Boykov and Gareth Funks-Lea introduced a graph cut framework [3] which is known for its simplicity. Mathematical modeling in this work is so general that the method could combine a broad range of visual features and parameter limits into this segmentation framework. Also, the work is scalable to N-D Image Segmentation. Their approach is to formulate segmentation as an energy function, over binary values, which will indicate whether they are inside or outside of the area of interest. In our proposed work, we utilized this mathematical modeling. This work shed light on how to implement the graph representation of image data, regardless of the dimension of data we have.
C. Simple Linear Iterative Cluster (SLIC)
SLIC is a sophisticated technique for Super-pixelization of images which is developed by [1, 2]. The proposed method applied this technique for the use of super-pixelization, considering its accuracy and speed. Superpixels catch the redundancy inside an image, which in turn reduces the complexity of subsequent image processing tasks. In this method, Superpixels reduce run-time considerably. SLIC works in CIELab color space, which again favors the proposed approach since the usage of the same color space. This work makes use of color similarity and proximity of pixels to accomplish the task of converting an image into meaningful Superpixels. It runs on 5D data, Lab color planes and x, y planes. Suppose take an example of turning an image of size N into Superpixels of size K, then it reduces the complexity from N to N/K. Which being said, the value K should be marginal. This advancement, in terms of complexity, will make the proposed method competitively faster.
D.CIDE2000
International Journal of Innovative Technology and Exploring Engineering (IJITEE) ISSN: 2278-3075, Volume-8 Issue-8, June 2019
E. Grab cut
GrabCut [12] is a successful image pixel clustering algorithm based on graph-cut. It is well known for its accuracy and capability to identify the object of interest even in highly complicated and camouflaged images. Even if there is the only minor difference between background and foreground, GrabCut shows great results. GMM (Gaussian Mixture Model) and histogram values are used in color and gray-scale images, respectively. GrabCut considers pixels as a unit of computation, which makes this approach slow in high dimensional images. The proposed work will make use of Superpixels and computations after that will be getting the benefit of that. Lack of N-D scalability and the pixel-wise estimate of GrabCut give a leg up for our proposed work.
III. METHODOLOGY
This proposed system will classify image pixels into two disjoint sets of pixels, namely foreground, and background. The proposed method in line with max-flow min-cut graph partitioning problem [4], for which need to map N-D image into graphs. From this graph representation the calculated parameters which will contribute to this partition. Finally, the proposed method ran Boykov-Kolmogorov [4] graph-cut algorithm to get two distinct sets of pixels. The proposed method utilizes the advantages of CIELab color space to the most here. Image of any color space converted to CIELab prior the super-pixelization. CIELab color space is significant for its capacity to represent the versatile colors and for its resemblance to the human visual system. SLIC [2] will convert this image into superpixels and will reduce the redundancy of data within the image. These superpixels provided by SLIC are used to model the image into a single undirected graph. The proposed model is depicted in Fig.2. CIEL*a*b*[7] color space is a perfect choice for color difference calculations and analysis. In CIEL*a*b*, L* stands for lightness, a* and b* stands for color opponents. All perceivable colors in three dimensions can be represented using this color system. The proposed framework selected CIEL*a*b* as the color representation for the entire work. Because it is the color space which approximate human vision system and which has a standard color difference calculation method.
Fig. 2: Complete Flow of the Proposed Model.
Simple Linear Iterative Clustering [1] is an algorithm for converting an image into Superpixels. SLIC gives the desired number of compact superpixels with the least computational
overhead. The method utilizes input image to SLIC algorithm, which turns the image into superpixel on which rest of the processing was being carried out. SLIC eliminates the redundancy in the image data. This helps us to run our later algorithms faster [2]. SLIC works on 5D image data, L, a, b color values and x, y pixel coordinates. This algorithm performs local clustering over this 5-dimensional data. SLIC utilizes color similarity parameters and proximity in this [labxy] image plane to cluster the pixels. Since the normal Euclidean distance could not be used in this 5D space without normalizing, SLIC introduces a new distance measure. This algorithm takes the desired number of superpixels as an input K. Therefore an image with N pixels will have N/K Superpixels, and approximately for every √ N/K grid interval, there will be a superpixel center. SLIC algorithm follows taking a sample of K cluster centers; later move them to the lowest gradient position in a 3x3 neighborhood. The gradient is calculated using the L2 norm of pixel values. If a cluster center search area overlaps with a pixel, then that pixel is assigned to that cluster center. After all, pixels are associated, new cluster centers will be calculated using an average. The value of labxy vectors inside the cluster. This process will continue until convergence. Super-pixelization will enable us to run the rest of the processing by considering superpixels as the basic unit. Thus the complexity will now depend on N /K, not N. This will improve the speed of the remaining process with no other significant disadvantages.
Algorithm 1: General structure of Super-pixelization algorithm.
Input : An Image with N pixels
Output: Labeled pixels
1 Initialize cluster centers Ck = [lk, ak, bk, xk, yk]T
2 Perturb Ck in an n x n neighborhood, to the
minimal gradient position. 3 do
4 for each cluster center do
5 Assign the most similar pixels from a 2S x 2S square neighborhood region.
6 end
7 Determine new Ck and residual error E
8while E > threshold; 9 Impose connectivity.
A. Setting up the Graph
Each edge is associated with non-negative weights according to the constraints mentioned below. Fig.3 illustrates the Graph representation of a 3x3 2D image.
Fig. 3: A simple representation of 2D 3x3 image and it's graph representation.
Graph includes the two terminal nodes and image pixels/Superpixels as internal nodes. Graphalso consist of both n-links and t-links [3]. To create n-links between the nodes, we need to have a neighboring system. We have used a simple neighboring system with which we have identified all the possible neighbors of a super-pixel. If centroid of a super-pixel is within the range of 1:5d (where d is the approximate diameter of a super-pixel) of another, both are considered as neighbors. Let P be the arbitrary set of Superpixels in a given image and N represents a neighborhood system among these SP's by a set of unordered pairs {p, g} A is a binary vector {A1, A2….. A|p|}, where value Ap determines whether p belongs to the set F or B.
Vector A defines the segmentation as it divides the set of SP's into two sets. Boundary and regional constraints are imposed on the segmentation in such a way that it should minimize the energy function [5].
E A
( )
. ( )
R A
B A
( )...(1)
Where E represents the segmentation energy which we are trying to minimize.
( )
(
)...(2)
p P
R A
Rp Ap
,
( )
.
...(3)
p q
pq A A
p q N
B A
B
1
...(4)
0
p q
p q
A A
p q
A
A
A
A
In equation 1, λ identifies the relative importance of regional R(A) and boundary B(A) terms. Regional term R (A), explained in equation 2, takes the individual penalties for classifying the SP as "object" or "background" as input and will calculate the regional constraint. For explaining the regional and boundary terms more clearly, the proposed method considered intensity based simple model. Here the intensity of SP is the mean intensity of all pixels occupied in it. If Rp depends on the mean intensity value of SP,
Rp (“bkg”) = -lnP r(Ip|”obj”) represents the likelihood
of SP(Ip) to be background.
Rp (“obj”) = -lnPr (Ip|”bkg”) represents the likelihood
of SP(Ip) to be foreground.
Equation-3 gives the boundary constraint of the segmentation. A coefficient Bpq ≥ 0 should represent the
penalty of the discontinuity between the SP's p and q. Bpq is
large when both are similar, and Bpq is close to zero when
both are different.
2 2
1
exp
.
...(5)
2
(
,
)
p q
pq
p q
I
I
B
dist I
I
In equation 5, dist (p,q) is the distance between two pixels. The penalty of separating two SP's will be very high when |Ip- Iq| < σ and will be low when |Ip – Iq| > σ.By far we have illustrated boundary and regional constraints in terms on mean intensity values of the SP's. But in practice, while we are dealing with colored images, we will utilize the mean color values and the histogram value of SP for the calculations. For finding the penalizing coefficient Bpq, we have used CIDE2000 color difference rather than simple intensity difference. Rp the regional co-efficient is calculated using the histogram value of seed Superpixels. CIDE2000 outperforms all the normal approaches since normalized Euclidean distance in Lab space is not accurate. So in our approach.
("
")
ln
(
|
)...(6)
p r p O
R
bkg
P C
H
("
")
ln
(
|
)...(7)
p r p B
R
obj
P C
H
Where Cp is the mean color vector of SP. HO and HB
represent the histogram vector for object seeds and background seeds, respectively. We have our model of boundary constraint as well, which used CIDE2000 color difference formula.
2
2
( 2000( , )) 1
exp . ...(8)
2 ( , )
p q
pq
p q
cide C C
B
dist I I
International Journal of Innovative Technology and Exploring Engineering (IJITEE) ISSN: 2278-3075, Volume-8 Issue-8, June 2019
:{ , }
1 max
p P pq...(9)
q p q N
K
B
Here K will ensure that the t-link will never get severed when SP belongs to the same seeds. Now the graph has set up with all the edge values initialized. Now method has to run the partitioning algorithm, which will separate the object SP's from background SP's.
B. Graph Partitioning Algorithm
The proposed method partitioned the graph into two distinct sets of SP's using Max-flow min-cut theorem. Augmenting path algorithms, including Ford Fulkerson algorithm [6] will provide us the desired segmented graph. In such algorithms it will start building a breadth-first tree for path s -> t when a path of given length go exhausted. Such operations will be very expensive in images since breadth-first tree generation involves scanning through all pixels/SP. To overcome this disadvantage, the method will be using an improved algorithm from the family of augmenting path algorithms, called Boykov-Kolmogorov Min-Cut/Max-Flow algorithm [4]. This algorithm creates two search trees from source and sinks nodes, and these trees are reused to avoid further traversals. This algorithm is having a complexity of O(mn2|C|) which theoretically is higher than the standard algorithm, but it outperforms them by its unique tree reusing idea. Algorithms run in three different phases, "growth", "augmentation," and "adoption" phases. In the growth phase, search trees expand till they join giving an s→t path. Then the path found is augmented in the augmentation phase, and search trees will break into forests. Adoption phase is where the restoration of search trees is going to happen.
Algorithm 2: General structure of max flow augmenting algorithm.
Input: Graph Representation of Image
Output: Two disconnected graphs having S and T as root 1 Initialize: Terminal nodes S = {s} and T ={t}, A ={s, t}, O =Empty Set ;
2 while true do
3 Expand Source or Sink to get an augmenting path P 4 if Path (p) = Empty set,
5 End the Process. 6 end loop
7 Augment on P 8 Consider Orphans 9 end
At the growth stage, the search trees will expand by exploring adjacent non-saturated edges and selecting few as child nodes from the free nodes. The newly selected nodes
will be active, and nodes will become passive when all of its neighbors are explored. When an active node finds a neighbor from the other search tree growth phase ends.
Algorithm 3: Growth stage of max flow augmenting algorithm
1 while A ≠Empty set do 2 Select a node p ∈ A 3 for every q ,
tree_cap (p→q) > 0 do
4 if TREE (q) ≠ Empty set then 5 augment q to search tree
6 TREE (q):= TREE (p), PARENT (q) := p, A :=A ∪ {q} 7 end
8 if TREE (q) ≠ Empty set and TREE (q) ≠ TREE (p) then
9 return P = PATHs→t
10 end
11 end
12 delete p from A 13end
14 return P =Empty.
In the above algorithm, the notation tree_cap (p→q) is used to denote the residual capacity of, edge (p, q) if TREE (p) = S or edge (q, p) if TREE (p) = T.At augment, phase, augmenting the path we found in the growth phase is done. The saturated edges will be removed from the graph, which will leave some orphan nodes whose parent links are removed. In this stage, search trees may split as forests.
Algorithm 4: An Augmentation stage of max flow augmenting algorithm.
1 Determine △ (bottleneck capacity) on P 2 Modify residual graph by pushing △ through P 3 for each edge (p, q) in P that become saturated do
4 if TREE (p) and TREE (q) equal to S then
5 set PARENT (q):= Empty set and O: = O ∪ {q} 6 end
7 end
Adoption state will restore the single-tree structure. For each orphan we will try to find a new parent, if no valid path could be found through a non-saturated edge, we will make it a free node. Its children become orphan in this case.
Algorithm 5: Adoption stage of max flow augmenting algorithm
1 while O ≠ Empty do
2 Select orphan node p ∈ O and delete it from O 3 Operate p
4 end
IV. RESULT AND ANALYSIS
The implementation of SM-NCut[14], a segmentation algorithm based on normalized cuts is worked well on small resolution gray-scale images. Since it's not compatible with colored images (without increasing the dimensionality and thus the complexity) and its slow performance made us choose our proposed approach. The proposed technique required to have a method to find the similarity between two SP's for the boundary coefficient discussed in equation (1). The implementation with Bhattacharyya distance differences, histogram difference, varies with the object and background seed selection, which was erroneous at initializing t-links.
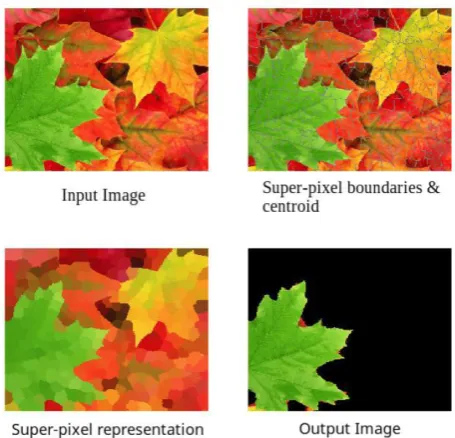
[image:6.595.310.538.52.271.2]The proposed method implemented in a quiet, user-friendly manner and tested with some of the images taken from [15]. The usage of GUI is the different addition where the user can input the initial labeling of the pixels. Red pixels are used to mark the object and blue for the background. This will label the seed SP's. Fig.4 illustrates this window and corresponding stages of output from the proposed method is shown in Fig.5. Output screen shows not only the masked segmented image but also all the intermediate representation. It includes super-pixel representation and super-pixel boundary. The implementation output of Boykov Kolmogorov algorithm on grayscale image is shown in Fig.6.
Fig. 4: Input window where user can label the seed pixels.
Fig.5: Output window showing all the intermediate stages along with the input and output image. Table-2: Comparison of results obtained with different
[image:6.595.317.549.326.632.2]methods in different color space.
Fig.6: Result of Boykov Kolmogorov algorithm on grayscale image.
Table-3: Comparison of running time and accuracy of the segmentation.
S/N Algorithm Color
Space
Running Time (s)
Accura cy 1. Boykov Kolmogorov
with SP and
Hist.Comparision
[image:6.595.61.262.393.564.2]International Journal of Innovative Technology and Exploring Engineering (IJITEE) ISSN: 2278-3075, Volume-8 Issue-8, June 2019
hoto
2. Boykov Kolmogorov
with SP and
Hist.Comparision
HSV 3.419 70%
3. Boykov Kolmogorov
with SP and
CIDE2000 (proposed)
CIEL*a *b
1.252 89%
V. CONCLUSION
In this proposed method, having a combination of existing techniques in color difference and graph algorithms, significantly reduces the computational complexity, since it works on superpixels rather than pixels. Implementation of CIDE2000, combined with Boykov Kolmogorov algorithms gives a fast technique for interactive image segmentation. This work shows its significant improvements in different color spaces as well. Color spaces play a vital role in the metric calculation and further processing of this method. The proposed method exposed that CIE*L*a*b color space has remarkable significance in image representation as it mimics human vision system in color perspective. Using Boykov Kolmogorov algorithm gave us the benefit of faster running time since it is an approximation algorithm rather than optimization. However, in practical Boykov Kolmogorov algorithm has shown significance advancement over the traditional min-cut/max-flow algorithms like the Ford-Fulkerson algorithm.Given an image as input, the proposed method could separate the background and foreground pixels by classifying them into two different sets. The foreground image will be the output of preference, and the same will be available as a masked version of the original image, where the background pixels will be masked either with transparency or with a color of preference. An intriguing and promising extension to this work could be the inclusion of more complex image cues into the model. The proposed method only considered the color difference and distance metric. Complex cues like texture could improve the results in scenarios where the color difference between object and background is not so distinguishable.
REFERENCES
1. Radhakrishna Achanta, App haji, e in ith, A re-lien cchi, ascal a, and abine sstr nk, “SLIC Superpixels”, EPFL TechnicalReport 149300, June 2010.
2. R. Achanta, A. Shaji, K. Smith, A. Lucchi, P. Fua and S. Süsstrunk, "SLIC Superpixels Compared to State-of-the-Art Superpixel Methods," in IEEE Transactions on Pattern Analysis and Machine Intelligence, vol. 34, no. 11, pp. 2274-2282, Nov. 2012.
3. Boykov, Yuri and Funka-Lea, Gareth , “Graph Cuts and Efficient N-D Image Segmentation”, International Journal of Computer Vision, 2006, volume=70, number=2, pages:109-131
4. Y. Boykov and V. Kolmogorov, "An experimental comparison of min-cut/max- flow algorithms for energy minimization in vision," in IEEE Transactions on Pattern Analysis and Machine Intelligence, vol. 26, no. 9, pages:1124-1137, Sept. 2004.
5. In Figueiredo M, Zerubia J., and Jain, A. K., Energy Minimization Methods in Computer Vision and Pattern Recognition,Third International Workshop, EMM-CVPR 2001 pages: 359-374.
6. Ford, L. R. and Fulkerson, D. R. , Maximal flow through a network. Canadian journal of Mathematics, 1956,8(3):399-404.
7. Kolmogorov, V. , “Graph Based Algorithms for Scene Reconstruction from Two or More Views”, PhD thesis, Ithaca, NY, USA,2004. 8. Luo M. R, Cui, G., and Rigg, B. , “The development of the CIE2000
colour difference formula: CIEDE2000”, Color Research & Application, 26(5),2001, page::340-350.
9. Ren X. and Malik J, “A probabilistic multi-scale model for contour completion based on image statistics”, In Proc. 7th Europ. Conf. Computer Vision,2002, volume 1, pages 312-327.
10. Ren, X. and Malik, J, “The ecological statistics of good continuation: multi-scale Markov models for contours”, Journal of Vision, 2002, 2(7):708a.
11. Ren, X. and Malik, J. , “Learning a classication model for segmentation”, In Proc. 9th Int'l. Conf. Computer Vision, 2003, volume 1, pages 10-17. 12. Rother C, Kolmogorov V, and Blake A., “GrabCut -Interactive
Foreground Extraction using Iterated Graph Cuts”, ACM Transactions on Graphics (SIGGRAPH), 2004.
13. Sharma, G., Wu, W., and Dalal, E. N., “ The CIEDE2000 color-difference formula: Implementation notes, supplementary test data, and mathematical observations”, Color Research & Application, 2005, 30(1):21-30 14. Shi, J. and Malik, J, “Normalized cuts and image segmentation”, IEEE
Transactions on pattern analysis and machine intelligence, 2000, 22(8):888.
15. M. Everingham, L. V. Gool, C. K. I. Williams, J. Winn, A. Zisserman, “The pascal is al object classes( oc) challenge”, Int. J.Co p ter Vision 88 No.2, 2010, pp.303-338.
AUTHORS PROFILE
Dinesh Naik received the B.Tech. degree from Kuvempu University, Karnataka, India, in 2001, and the M.Tech. degree from the Visveswaraya Technological University, Belgaum, India, in 2006. He is currently working as faculty for the National Institute of Technology Karnataka, Mangalore, India. He has more than 10 research publications in reputed and peer-reviewed international journals. His research interests include computer vision, image processing, and deep learning.