International Journal of Innovative Technology and Exploring Engineering (IJITEE) ISSN: 2278-3075, Volume-8 Issue-8S2, June 2019
Comparing Raw Data and DICOM Data According
to Use Duration of Digital Radiography System
Sung-Hun Jeoung, Chung-Hwan Lim, Kil-Soo Ra
Abstract-With changes in diagnostic radiation generatin g apparatus, digital radiography (DR) systems are conti nuously increasing.The objective of this study was to c ompare Raw data and DICOM data according to the u se period of DR system. In addition, this study conduc ted a constancy experiment in Korea for the first time. Based on measured value of the consistency test, it wa s measured after calibration for 1month and 4 months. Image quality change with time was then observed. A nalysis of MTF curve was carried out with spatial reso lutionintersection of MTF 10% and the curve was eval uated. Sharpness ratings were evaluated at the intersecti on of MTF 50% and the curve. Information transmissi on ability was measured up to 1.0-3.0lp/㎜.Constancy t est results showed that the Raw data information trans mission ability was 1.0lp/㎜ 92%, 2.0lp/㎜ 79%, 3.0lp/ ㎜ 63%, MTF 10% 5.4lp/㎜, and MTF 50% 3.9lp/㎜. DICOMdata information transmission ability was 1.0lp/ ㎜ 94%, 2.0lp/㎜ 74%, 3.0lp/㎜ 63%, MTF 10% 5.1lp/ ㎜, and MTF 50% 3.7lp/㎜. In results of calibration af ter 1month and 4 months, based on constancy test val ue, the image quality decreased with time. It was mea sured higher than 1month and 4 months after calibratio n. Radiologists responsible for medical imaging will be able to improve the quality of life of patients as well as the quality of medical service if they can fully un derstand the evaluation method according to change of image and maintain medical image consistently.
Index Terms: Constancy test, Raw data, DICOM data, MTF, Calibration
Ⅰ. INTRODUCTION
Image evaluation in an analog system is performed by evaluating the image and characteristics of the film u sing gamma value and tolerance based on characteristic curve.
Revised Manuscript Received on May 23, 2019
Sung-Hun JeoungDept. of Radiology, Seosan Jung-Ang Jeneral Hospital, Seosan-si, 32010, Republic of Korea
Chung-Hwan Lim Dept. of Health Care, Hanseo University, Seosan-si, 31962, Republic of Korea
Kil-Soo Ra Dept. of Health Care, Hanseo University, Seosan-si, 31962, Republic of Korea
However, in the modern age, where digital image devi ces take up the majority, there is no need for image measure[1], [2]. Simple image measurement using a co mputer is possible. The evaluation of imagequality in Digital Radiography System (DRS) is a very important aspect. When examining a patient in DRS, various im age files are generated. Digital Imaging and Communic ations inMedicine(DICOM) files will be generated and passed to Raw data of Picture Archiving and Commun ication System (PACS)[3], [4]. When image evaluation of DRS is performed, it is performed using Raw data [5]. However, when Raw data are converted into a DI COM file, various parameters are applied to the origin al data to form an image. The evaluation of images u sing Raw data has various limitations. Thus, many res earchers have performed image evaluation with DICO M files. In addition, the format of the file is different for each equipment company. It is still not enough to measure the quality of image using Raw data. In add ition, Raw data are amplified by various parameters. T hus, Raw data suffer some losses during the amplificat ion of image. However, there is still little research tha t compares Raw data with DICOM data. By comparin g and analyzing Raw data and DICOM data according to the usage period in the DR system, this study aim s to observe the performance change of the detector a nd identify the timing of the degradation of image qua lity to suggest change of image quality and the timing of calibration of the detector. Results of this study ca n be utilized as basic data to improve image quality i n DR system.
Ⅱ. MEASURING INSTRUMENT AND METHOD
A.Measuring Instrument
The equipment used in this study was a diagnostic r adiation generator (Gemss Medical, Apollon, R-800-150 , Korea) installed in hospital A in area A. An indirect detector (FXD 4343R, TOSHIBA, Japan) was used fo r image acquisition. For modulation transfer function(M TF) measurement, TX5 Tungsten Edge Filter (IBA Do simetry, USA)was used. For editing and measurement of images in this study, Image J Ver. 1.46 developed by the US National Institutes of Health (NIH) for rese arch purposes and engineering software Matlab R2014 that could provide numerical analysis and programming environment developed by Math Works were used.
B. Method of Measurement
015 to April 2016. Five-day constancy test was perfor med at 1 month after measurement, 4 months after me asurement, and after calibration. Constancy test was ca rried out daily for 5 days in order to calculate the init ial average power value according to the recommendati on of IEC 61223-2-11[6]. The number of measurement s was once. Measured average values for 5 days were used to calculate an average value. The measured valu e was set as a reference value of each equipment. To observe changes of measurement values according to t he use of equipment, the measurement was performed with the same method after 1month, 4 months, and aft er calibration. Five measurements were made for each time point and compared with their initial setting value s[7]. MTF measurement was made by aligning the tun gsten edge portion of the edge filter with the center li ne of the X-ray tube using many pixel values. Thetun gsten edge portion was measured at 3°[Fig 1].
C. Image Evaluation
The equipment used in this research produced a Tiff file as Raw data and a DCM file that was passed to PACS. IEC 62220-1 recommends the use of Raw data without parameters. However, images used in this study selected both. They were compared and analyzed by measuring MTF[Fig 2]. Analysis of the MTF curve was carried out by performing a spatial resolution evaluation at a value where MTF 10% and the curve intersected. Sharpness evaluation was performed at a point where the curve intersected with MTF 50%. The information transmission ability was also measured from 1.0 to 3.0lp/㎜[Fig 3].
Ⅲ. Results
A. Comparative Analysis of Raw Data an DICOM Data of Constancy Test
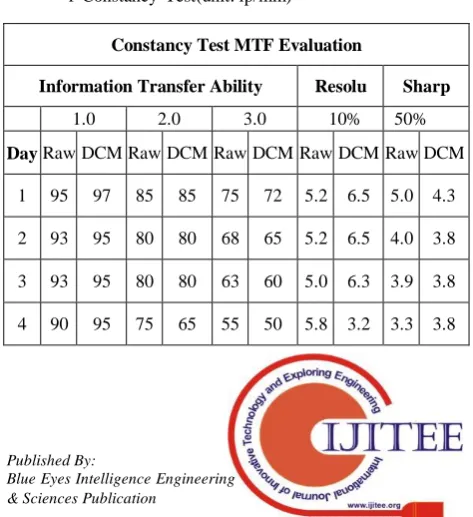
Constancy test was performed for 5 days to set MTF reference value. Results were analyzed in three ways. Overall information transmission ability was evaluated at 1.0lp/㎜, 2.0lp/㎜, and 3.0lp/㎜. Sharpness was evaluated at
50% MTF and Resolution was evaluated at 10% MTF.Regarding information transmission ability in this study, Raw data showed an average of 1.0lp/㎜ 92%, 2.0lp/㎜ 94%, and 3.0lp/㎜ 63%. In MTF 50% representing sharpness, it showed 5.0lp/㎜ on day 1, 4.0lp/㎜ on day 2, 3.9lp/㎜ on day 3, 3.3lp/㎜ on day 4, and 3.3lp/㎜on day 5 with an average of 3.9lp/㎜. MTF 10% representing Resolution showed 5.2lp/㎜ on day 1, 5.2lp/㎜ on day 2, 5.0lp/㎜ on day 3, 5.8lp/㎜ on day 4, and 5.8lp/㎜ on day 5, with an average of 5.4lp/㎜. Also, DICOM data information transmission ability showed an average of 1.0lp/㎜ 94%, 2.0lp/㎜ 74%, and 3.0lp/㎜ 59%. In MTF 50%, it was4.3lp/㎜ on day 1, 3.8lp/㎜ on day 2, 3.8lp/㎜ on day 3, 3.8lp/㎜ on day 4, and 3.0lp/㎜on day 5 with an average of 3.7lp/㎜. In MTF 10% representing Resolution, it was 5.2lp/㎜ on day 1, 5.2lp/㎜ on day 2, 5.0lp/㎜ on day 3, 5.8lp/㎜ on day 4, and 5.8lp/㎜ on day 5, with an average of 5.4lp/㎜[Table.Ⅰ].
TableⅠ. Comparative Analysis of Raw Data andDICOM Data o f Constancy Test(unit: lp/mm)
Constancy Test MTF Evaluation
Information Transfer Ability Resolu Sharp
1.0 2.0 3.0 10% 50%
Day Raw DCM Raw DCM Raw DCM Raw DCM Raw DCM
1 95 97 85 85 75 72 5.2 6.5 5.0 4.3
2 93 95 80 80 68 65 5.2 6.5 4.0 3.8
3 93 95 80 80 63 60 5.0 6.3 3.9 3.8
[image:2.595.80.203.285.411.2]4 90 95 75 65 55 50 5.8 3.2 3.3 3.8 Fig. 1: Constancy Test
Fig.2: Analyzed by measuring MTF
[image:2.595.71.213.564.651.2] [image:2.595.310.547.579.838.2]International Journal of Innovative Technology and Exploring Engineering (IJITEE) ISSN: 2278-3075, Volume-8 Issue-8S2, June 2019
5 90 90 75 60 55 50 5.8 3.0 3.3 3.0
Aver 92 94 79 74 63 59 5.4 5.1 3.9 3.7
DCM:DICOM, Resolu: Resolution, Sharp: Sharphness
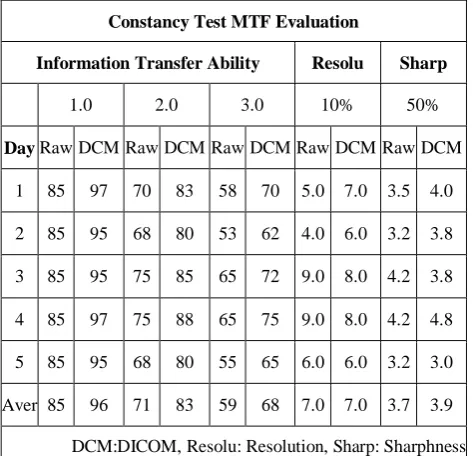
B. Comparative Analysis of Raw Data and DICOMData After 1 month
Based on Constancy test, results of measurement in identical experiment after 1 month were as follows. In case of Raw data, information transmission ability showed an average of 1.0lp/㎜ 85%, 2.0lp/㎜ 71%, and 3.0lp/㎜ 59%. In case of DICOM files, it was 1.0lp/㎜ 96%, 2.0lp/ ㎜ 83%, and 3.0lp/㎜ 68%, higher than Raw data. Also, in MTF 50%, Raw data showed an average of 3.7lp/㎜ while DICOM data showed an average of 3.9lp/㎜. These two were similar. In MTF 10%, Raw data and DICOM data both showed 7.0lp/㎜. Compared to the Constancy test, as time passed, information transmission ability, resolution, and sharpness were found to be decreased [Table Ⅱ].
Table Ⅱ. Comparative Analysis of Raw Data and DICOM D ata after 1 month (unit: lp/mm)
Constancy Test MTF Evaluation
Information Transfer Ability Resolu Sharp
1.0 2.0 3.0 10% 50%
Day Raw DCM Raw DCM Raw DCM Raw DCM Raw DCM
1 85 97 70 83 58 70 5.0 7.0 3.5 4.0
2 85 95 68 80 53 62 4.0 6.0 3.2 3.8
3 85 95 75 85 65 72 9.0 8.0 4.2 3.8
4 85 97 75 88 65 75 9.0 8.0 4.2 4.8
5 85 95 68 80 55 65 6.0 6.0 3.2 3.0
Aver 85 96 71 83 59 68 7.0 7.0 3.7 3.9
DCM:DICOM, Resolu: Resolution, Sharp: Sharphness
C. Comparative Analysis of Raw Data and DICOM Data after 4 months
Based on Constancy test, results of the measurement in the identical experiment after 4 months were as follows. In case of Raw data, information transmission ability showed an average of 1.0lp/㎜ 80%, 2.0lp/㎜ 50%, and 3.0lp/㎜ 20%. In case of DICOM files, it was 1.0lp/㎜ 85%, 2.0lp/ ㎜ 50%, and 3.0lp/㎜ 22%, identical to Raw data. Also, in MTF 50%, Raw data and DICOM data both showed 2.0lp/ ㎜. In MTF 10%, both Raw data and DICOM data showed
identical 3.0lp/㎜. Compared to Constancy test, as time passed, information transmission ability, resolution, and sharpness were all found to be decreased [Table Ⅲ].
Table Ⅲ. Comparative Analysis of Raw Data and DICOM D ata After 4 months (unit: lp/mm)
Constancy Test MTF Evaluation
Information Transfer Ability Resolu Sharp
1.0 2.0 3.0 10% 50%
Day Raw DCM Raw DCM Raw DCM Raw DCM Raw DCM
1 80 85 50 52 20 22 3.5 3.5 2.0 2.0
2 80 85 50 52 20 22 3.5 3.5 2.0 2.0
3 80 85 50 52 20 22 3.5 3.5 2.0 2.0
4 80 85 50 52 20 22 3.5 3.5 2.0 2.0
5 80 85 50 52 20 22 3.5 3.5 2.0 2.0
Aver 80 85 50 52 20 22 3.5 3.5 2.0 2.0
DCM:DICOM, Resolu: Resolution, Sharp: Sharphness
D. Comparative Analysis of Raw Data and DICOM Data after Calibration
Results of the identical experiment after calibrating the d etector showed the following results. In case of Raw dat a, information transmission ability showed an average of 1.0lp/㎜ 90%, 2.0lp/㎜ 75%and 3.0lp/㎜ 70%. In case of DICOM files, it was 1.0lp/㎜ 96%, 2.0lp/㎜ 90%, and 3. 0lp/㎜ 84%. In case of RAW data and DICOM data, it was higher than the constancy test, showing improvemen ts in image quality. Also, in MTF 50%, both Raw data and DICOM data showed an average of 5.0lp/㎜. In MT F 10%, Raw data and DICOM data both showed an ide ntical 9.8lp/㎜. As a result of calibrating the detector, im age transmission quality, resolution, and definition were all improved compared to thoseof the Constancy test[Ta ble Ⅳ].
Table Ⅳ. Comparative Analysis of Raw Data andDICOM Da ta after Calibration(unit: lp/mm)
Constancy Test MTF Evaluation
Information Transfer Ability Resolu Sharp
1.0 2.0 3.0 10% 50%
Day Raw DCM Raw DCM Raw DCM Raw DCM Raw DCM
1 90 98 75 90 70 85 9.8 10 5.0 6.0
[image:3.595.49.284.48.110.2] [image:3.595.46.283.372.600.2] [image:3.595.306.550.601.836.2]3 90 98 75 90 70 85 9.8 10 5.0 6.0
4 90 98 75 90 70 85 9.8 10 5.0 6.0
5 90 98 75 90 70 85 9.8 10 5.0 6.0
Aver 90 96 75 90 70 84 9.8 9.8 5.0 5.8
DCM:DICOM, Resolu: Resolution, Sharp: Sharphness
Ⅳ.DISCUSSION
Due to development of science and medical technology, equipment of imaging is rapidly changing. It is a crucial part in the diagnosis and treatment of diseases. Such imaging equipment must be accurate because only the equipment with accurate quality control can predict correctly and adequately for patient care Patient testing using equipment that is not properly quality controlled can increase the likelihood of misdiagnosis, thereby increasing the cost of testing and increasing the patient's exposure dose[8], [9]. Kang Byeong-Sam has reported that in the case of clinics and educational institutes, there is nonconformity occurring in tube voltage test, irradiation dose reproducibility test, irradiated dose linearity test, half-value layer test, and light field difference test. In addition, non-compliance occurred in the general hospital in the radiation dose reproducibility test, the light field difference test, and the survey period reproducibility test. Moreover, it has been reported that performance tests should be carried out in order to carry out the quality management efficiently and plans should be established in the setting range of items and the inspection cycle[10]. Park Jung-Gyu has reported that many nonconforming items have been measured. In order to improve this, it is necessary to revise the periodic inspection cycle to 1~2 years for older equipment[11]. Therefore, in this study, the Constancy test recommended by IEC 61223-2-11 was performed to set the reference value of the equipment and degradation of image quality of the equipment with time was observed with this reference value. In information transmission ability, Raw data showed an average of 1.0lp/㎜ 92%, 2.0lp/㎜94%, and 3.0lp/㎜ 63%. In MTF 50%, the average was 3.9lp/㎜. In MTF 10%, the average was 5.4l p/㎜. For DICOM data information transmission ability, the average was 1.0lp/㎜ 94%, 2.0lp/㎜ 74%, and 3.0lp/㎜ 59%. In MTF 50%, the average was 3.7lp/㎜. In MTF 10%, the average was 5.4lp/㎜. Through this constancy test, it is very important to measure the reference value of the equipment. By setting the reference value, it is easy to see change of image quality. This study also examined the change of image quality of 1 month and 4 months based on the reference value set by the Constancy test. As a result, it was confirmed that the image quality deteriorated with time. As a result of measurement using detector calibration, the quality of image was improved. This is an important result in that it shows change of quality control according to change of image and timing of calibration which is the time of initializing the detector.
Ⅴ.CONCLUSION
This study performed a comparative analysis between Raw data and DICOM data according to the period of use of digital diagnostic radiation generator. The following conclusions were obtained.
1. In the result of the Constancy test, Raw data information transmission ability was 1.0lp/㎜ 92%, 2.0lp/㎜ 79%, and 3.0lp/㎜ 63%. In MTF 10%, it was 5.4lp/㎜. In MTF 50%, it was 3.9lp/㎜. DICOM data information transmission ability was 1.0lp/㎜ 94%, 2.0lp/㎜ 74%, and 3.0lp/㎜ 63%. In MTF 10%, it was 5.1lp/㎜. In MTF 50%, it was 3.7lp/㎜. It can be seen that the constancy test can provide important data to easily recognize change of equipment.
2. Based on the Constancy test value, in measurements after 1 month, 4 months, and after calibration, the image quality decreased with time. After calibration, all were measured higher than those at 1 month and 4 months.
3. As a result of comparison between Raw data and DICOM data, there was not much difference. Image quality of both Raw data and DICOM data decreased with time.
REFERENCES
1. K. H. Ryu, J. E Jung,“Study of Image Properties for C
omputed Radiography”, Journal of the Korean Society for Digital Imaging in Medicine, Vol.10, No.2,2008, pp .23-24.
2. J. K. Park,B. J. Jung,Y. J. Choi1,S. S. Kang,“Image Q
uality Evaluation of Digital X-ray Image and Film Ima ge using Contrast Method”,Journal of radiological scie nce and technology, Vol. 34, No.1, 2011, pp. 9.
3. H. S. Kim, J. H.Jeong, J. W. Lee,“Research on Image
Quality and Effective dose by Exposure Index Variatio n”,
4. Journal of the Korean Society of Radiology, Vol. 7, N
o.1 2013, pp. 64-65.
5. H. W.Jeong,J. H.Min,J. M.Kim,M. S.Park, G. Y.Lee,“Per
formance Characteristic of a CsI(Tl) Flat Panel Detecto r Radiography System”, Journal of radiological science and technology, Vol. 35, No.2, 2012, pp.109-110.
6. S. C.Kim, J. E.Jeung, “Study on image quality and dos
age comparison of F/S system and DR system”,Journal of radiological science and technology, Vol. 26, No.3, 2003, pp.7-11.
7. KS C IEC 62220-1:Medical electrical
equipment-Characteristics of digital X-Ray imaging
device-Part1:Determination of the detective quantum
efficiency,2005, pp.2-6.
8. KS C IEC 61223-2-11, Evaluation and routine testing i
n medical imaging departments-Part 2-11:Constancy
tests-Equipment for general direct radiography, 200
5, pp.1-12.
9. C. S. Kim, S. S. Kang,S. J. Ko, “Image Quality Evalu
ation of Medical ImageEnhancement Parameters in the DigitalRadiography System”,The Journal of the Korea Contents Association, Vol.10, No.6, 2010, pp.330-334.
10. H. An, C. S. Kim,J. H. Kim, “Evaluation of Image Qu
ality for Radiographic Positioning using IEC Radiation Quality in the Digital Radiography System”, The Journ al of the Korea Contents Association, Vol.15, No.7, 20 15, pp. 290-298.
11. B. S.Kang,K. M.Lee, W. Y.Shim, S. C.Park,H. D.Choi
, Y. K.Cho,“Analyze for the Quality Control of
International Journal of Innovative Technology and Exploring Engineering (IJITEE) ISSN: 2278-3075, Volume-8 Issue-8S2, June 2019
Author-3 Photo
pital Region”.Journal of radiological science and techn ology, Vol. 35, No.2, pp. 93-100.
13. J. K.Park,“Medical Clinics’quality Management of X-
14. ray Units in Gyeong-buk Area”, The Journal of the Ko
rea Contents Association, Vol.10, No.9, pp. 268-274.
AUTHORS PROFILE
Sung-Hun JeoungMaster of Radiology, Hanseo
University, Doctor of Public Health, Hanseo
University, adjunctProfessor, Hanseo University,
Korean Society of Radiological Science staff of Finance Dept.
Chung-Hwan LimMaster of Public Health, Dankook University, Doctor of Public Health, Kyungwon University, Professor of Department of Radiology Hanseo University, President of Korean Society of Radiological Science.