Outlier Detection in Wireless Sensor Networks
Data by Entropy Based K-NN Predictor
Manmohan Singh Yadav
,Shish Ahamad
Abstract: Anomaly (outlier) detection is plays very significant role in ESN based monitoring application using on large data used for biomedical and defence. Wireless Sensor network monitor environmental parameters (temperature, humidity, pressure, vibration etc). Group of sensor nodes forms a (WSN) and observations collected from these sensor produces low data quality and reliability due to the limited energy, memory, computation capability and bandwidth. The dynamic environment of network and roughness of the working condition are also responsible to generate inaccuracy in measurements. In this paper, an approach for outliers detection based entropy value of received sensor voltages is applied using KNN prediction model .The algorithm development and analysis involves a real time database generated on 14 sets of MICA2 wireless sensor kit with anomaly inserted by real time motion based intrusion in the lab by volunteers from Intel Berkeley lab. On each sensor data pair segmentation is applied by fixed window size in order get large outliers’ measurements training dataset. The analysis demonstrates the measurement accuracy in detection of number of outliers that its 86%. Moreover, the algorithm also provides an analysis in terms of impact of variation in distance types and number of nearest neighbours in the KNN prediction model. This work is helpful in the application in the situations where high amount of noise or distortions are present. The outlier part from distorted data can be figured out and recollected to enhance application accuracy.
Keywords: Anomaly Detection, Entropy, K-nearest neighbour, Outliers Detection, Wireless Sensor Networks.
I. INTRODUCTION
WSNs are network developed by collection of sensor nodes. Sensors nodes are small devices with limited energy resources. Low quality data measurement limits reliable real-time monitoring due to presence of anomaly. [1], [2] and fetching out of features from such data is tough. Outlier detection covers multiple fields and analysed for number of application. Several research articles on outlier detection techniques with different criteria including detection methodology based on distribution, density and clustering approach. Some articles investigated outlier‟s detections methods depending upon data feature high-dimensionality, uncertainty and frequency domain values. Such classification is used for outliers detection models are described in [3], [4]. Generally outlier detection models follow either statistical approach or non-parametric approach. Non-parametric mode is based on rule base, clustering or support vector [5]. This paper covers a non-parametric statistical approach that adds the nearest neighbour and entropy features related classification models.
Revised Manuscript Received on October 05, 2019.
*Correspondence Author
Manmohan Singh Yadav*Department of Computer Science & Engineering,Integral University, Lucknow, U.P., India.
E-mail: [email protected]
Shish Ahamad,Department of Computer Science & Engineering Integral University, Lucknow,U.P., India,E-mail: [email protected]
It is also observed to include the SVM in some literatures [6]. This paper focused on three detection accuracy along-with speed of detection. An article [7] proposed ellipsoidal SVM that uses attributes of data in WSNs. Author proposes Bayesian approach in adaptive contexts [8] for identifying outliers with improved classification accuracy with reduced time and communication complexity .In article [9] worked on taxonomy related scheme for analysis in noisy environments. Principal component analysis [10] using the Mahalobis distance outlier detection is also observed to be used to calculate mapping of feature space to separate outliers. Ina paper [11], the data records from the streets using centre servers are applied on outlier detection to analyse.
II. RELEVANCE OF KNN, ENTROPY AND
PROBABILITY DENSITY FUNCTION A. K-Nearest Neighbour
KNN (k-Nearest Neighbours) [12] is very simple but highly efficient classification approach. When a new data sample is introduced without label or class. The new sample as query is matched to every sample. Then the most similar samples (nearest neighbours) are taken and respective labels are analysed. After this top k similar samples from known dataset are considered [13], [14].
Numerical Example of K-NN Algorithm approach:
Here is step by step on how to compute K-nearest neighbours KNN algorithm:
1. Determine parameter K= number of nearest neighbours. 2. Calculate the distance between the query-instance and all the training samples.
3. Sort the distance and determine nearest neighbours based on the K-th minimum distance.
4. Gather the category of the nearest neighbours.
5. Use simple majority of the category of nearest neighbours as the prediction value of the query instance.
B. Entropy
changes in entropy with each dataset obtained within limits of some error, when an anomalous data point is returned [15].
The entropy calculation is multiple types in this paper Shannon Entropy is used to detect the anomaly. Shannon Entropy is defined as:
(1)
Where: f(𝑥) represents the probability density function of the dataset x.
For applying equation (1) to the entropy of the data x we should have the (𝑥). Thus first of all we need to evaluate it or at least approximate it in a reasonably accurate manner. This issue of finding PDF i.e. f(x) also have a number of ways but in this work, the 𝑘-nearest neighbour approach is used.
K-Nearest Neighbour method for PDF Estimation is explained here with small introduction about KNN. Basically KNN method uses the distance between a data point and its 𝑘th
nearest neighbour to calculate the volume of the region. The value of this volume containing K nearest neighbours is used to approximate the pdf of the dataset at that point using the equation:
𝒇̂(𝑥)= (𝑘−1) / 𝑁𝑉𝑜𝑙 (2)
Where: 𝑉𝑜𝑙 is the volume of the 𝑘-nearest neighbour region for each data point, 𝑘 is the number of nearest neighbours considered, and as before, 𝑁 is the size of the dataset. The distance measured is generally applies the Euclidean distance formulae and also keep in track of maintaining equidistant to neighbours in all directions. This it is represented as a circle in two dimensions, sphere in three dimension, etc. Another problem quickly comes as both the Equations (1) and (2) are coupled. This may have some impact on the result. To avoid this, a data-split method is invoked to maintain a balance in between accuracy of entropy measurement within a tolerance level of errors.
C. Probability Density as a Function K-Nearest Neighbour
This entails the database splitting in an arbitrary manner into two smaller datasets. These sub datasets are arbitrarily labelled as 𝑁 and 𝑀 set. From the use of 𝑀 data set points the pdf of the entire set is estimated, the 𝑁 data set points are then applied to estimate its entropy. In this way the Equation (2) is then written as:
𝒇̂(𝑥)= (𝑘−1) / 𝑀𝑽𝒐𝒍 (3)
It is also observed that more the points used in estimating the pdf for the 𝑀 data points, the better the estimate and higher the accuracy.
III. OUTLIER DETECTION IN WSNs
Outlier is due to errors, noise, missing values in a data. These abnormality causes reduction in the system performance. Outliers are due to errors and attacks and effects monitoring of real life applications in surveillance and tracking tasks [16].
In recent data mining methods used for anomaly detection focus is given to the identification of events or observations
which do not ensure any kind of an expected pattern in a dataset under consideration. Anomalies are also known with other names like
outliers
, noise, exceptions or deviations [17].Anomaly detection techniques are described in three broad categories. First of all the basic category consists of unsupervised anomaly detection techniques it belongs to anomalies in an unlabeled data. The second is supervised anomaly detection that require a specific type of data labelled with "normal" / "abnormal" or “true”/”false” etc. and involves the process of training a classifier. The third one is semi-supervised anomaly detection based techniques and represents the normal behaviour developed by normal training data as per availability [18].
A. Applications
Anomaly detection is applicable in a variety of domains like
intrusion
scheme, fraud alarms approach, health monitoring in diagnosis, event and checking of the ecosystem disturbances in terms of pre-processing of minimizing the anomalous records from the available data collection. Inlearning it
often helps in supporting the statistically significant increase in accuracy.B. Common Anomaly Detection Techniques
Anomaly detection techniques that is prevalent and proposed in various literatures. Some of these are described below:
1. Density-based techniques: It consists of k-NN, factor, and variations based on this scheme.
2. Techniques based on the subspace-based and the correlation-based outlier detection methods for high-dimensional database set.
3. Support vector machines based methods. 4. Replicator neural networks approach.
5. Bayesian Theorem Model classifier using the probability theory
6. Hidden Markov models(HMMs) based supervised classifier.
7. Cluster analysis application in outlier detection. 8. Fuzzy logic with human expert knowledge embedding. 9. Feature bagging score normalization and diversity. 10. The performance analysis of methods depends on the
type of available data set and model parameters.
WSN has low cost and energy but high quality performance. It can be improved by outlier detection scheme. Outlier detection depends on the accuracy and the resource consumptions with high detection rate. Generally algorithms face multiple problems in outliers‟ detection like:
(a) High cost of communication (b) Modelling objects with the outliers (c) Application based scheme of detection (d) Outlier source based identification process (e) Distributed data related challenges (f)Communication failures issues (g) Dynamic topology problems
C. Outlier Detection Method
(a) Statistics based detection approach (b) Distance techniques
(c) Clustering-based schemes
Fig.1 Various Applications of WSN IV. PROPOSED ALGORITHM FOR OUTLIER
DETECTION USING KNN CLASSIFIER
A. Load & Initialization the Variables
a)Each sample has time gap t = 0.5 sec., segment length =50 samples .For 14 sensors data has 14x13=182 sensor pair id and each sensor pair record has 3127 sample after pre-processing of total 3600 sample record 30minutes[19]. b) Sensor data matrix Z 182x3127 and motion data vector 1 x 3127 (which is as outlier [0 or 1] dataset) stored in the excel sheet. c) Take the different distance type as:
distname=['cityblock','chebychev','mahalanobis','minkowski' ,'euclidean','seuclidean','spearman','cosine',
'hamming','jaccard'].
B. Select Sensor Pair Ids:
Pair id is id any two sensors communicate with each other. It is selected randomly to create a training data set.
C. Data Segmentation:
a) Dataset is divided into segment of length 50 samples thus total segment are 62 and it is stored in another matrix. b) Motion dataset which is known as outlier data is also segmented into 62 segments of 50 samples.
c) Each pair is broken into segments such that total segment per sensor pair =floor [(total sample)/(segment length length)]=62.
d) Calculate the entropy and number of outlier of each segment of Z. Number of outlier is named as outlier level.
D. Segment Entropy Evaluation:
a) After segmentation the entropy of each segment is evaluated this is input of K-NN predictor algo. The function
used for entropy calculation is
wentropy(dataseg(i,:),'Shannon').
b) Each segment is selected iteratively and entropy is evaluated.
c) Save the entropy of all segments as variable „Entrpall‟. d) Outlier data is also taken segment wise and outlier are summed and saved as outlier level.
f) Total pairid =182 for segment length =50 we have 62 segment and we take random pair id of 10 pair id thus 620 data recorded are generated and considered as training dataset.
E. KNN Model Development:
a) After finding the entropy and outlier KNN is applied with entropy data variables.
b)Initialize rloss & kloss(prediction inaccuracy of training & testing data).MDL all=cell of 9x10 to save all KNN models at 9 nearest neighbours (2 to 9) and 10 different types of distance ;CVMDL is cell for cross validated data.
c) Use the classifier function as in nested loop (ia=ia+ and ja=ja+) using function:
„mdl=ClassificationKNN.fit(Entropy values,Outlier level value ,'NumNeighbors',ia,'Distance', dist_name{ja})‟. d) Find the percentage of model inaccuracy and save as rloss(ia-1,ja) and developed model as „cvcmdl‟.
e) Find the cross validation model as kloss (ia-1,ja) after applying model testing.
V. RESULT AND DISCUSSION
WSN monitors physical parameters changes in parameters are due to various reasons. Outliers represent unusual readings in sensors due to e.g. sensors fault, a change in some monitored parameter property, obstacle or communication faults in sensors, etc. As a result readouts are different from others in common ambient conditions such that they follow a different distribution. Outlier or anomalies detection specifies abnormal behaviour in data. A basic application of WSN is detection in large areas related to environmental change (temperature, atmospheric pressure or the received signal which are different from which are received in past. Anomaly detection becomes more challenging than conventional detection due to less knowledge of the signal that is to be detected [20],[21]. Various approaches are proposed for outlier detection. This paper follows entropy estimation of data segments. The aim of this analysis is to verify the outlier detection methods by KNN classifier using data entropy as a parameter:
- Estimate PDF of a data by data-split technique - calculate entropy of the data using PDF
This method is applied to actual measured data that incorporates literature survey on the use of anomaly detection in sensor networks along with MATLAB simulation on sensor pair data. Validation of k-NN technique on the recorded signals found at: www-personal.umich.edu/~kksreddy/rssdata.html. The data is
generated under an experiment conducted at
the University of Michigan. The 4th level of the EECS office block has the site of the research. Mica2 platform has been used for this experiment, in this fourteen sensor nodes arbitrarily deployed inside and outside a lab space. Broad casting is used for Wireless sensors network applications and the received signal strength (RSS) in terms of voltages called as received signal strength indicator circuit (RSSI).In
this work the data is for pair of transmitting and receiving sensor nodes RSS value for a 30 minute period. Total 14 x 13 = 182 sensor pairs of RSS value measurements at sample time of 0.5 sec is collected to give 3191 samples of data. During the data recording the volunteer student‟s walked through the lab at random interval of times. It created anomaly patterns in the values RSSI. A web camera employed to record the walk through activity as ground truth resemblance. Experiment produced the 182 RSS sequence data array to support the model development task of detection of any intruders (anomalies). The original raw data is stored in the matrix of size 182 x 3191.Usingwebcam records manual record is made as value of 1 to indicate the presence of an intruder.
Fig.2. Block diagram of outlier detection process
Fig.3 .Received signal strength vs time Fig.4.Intruder motion (anamoly) vs sample
Fig.5. RSS data segments of received data at length of 50 samples.
Fig.7. (a) Percent Training Accuracy vs distance type* at diffetrent number of neighbours.
Fig.7. (b) Percent Training Accuracy vs number of neighbours at different distance type.
*DistanceType1:cityblock,2:chebychev,3:mahalanobis,4:minkowski,5:euclidean,6:seuclidean,7:spearman,8:cosine,9:hammi ng,10:jaccard.
Fig.7 (a) the plot is shown for percent training accuracy for each distance type * (1 to 10) at different no of neighbour varying from 2 to 9. It can be observed that at distance type “1” that is “cityblock”.The training accuracy is highest at 2 nearest neighbour that gradually decrease as no of neighbour and finally become constant for large no of neighbour. Similar trend in Fig.7 (b)is observed in distance type 2 to 6 but at distance 7 to 10 accuracy is obtained similar irrespective to the nearest neighbour. The highest accuracy observed as 86% at distance type secludian and nearest neighbour equals to 2.In all the cases training accuracy is found to be above than 75%.
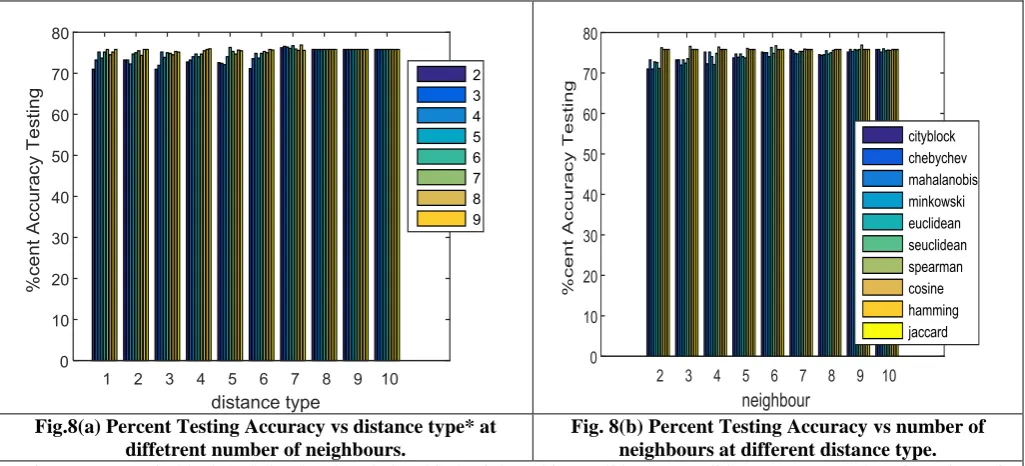
Fig.8(a) Percent Testing Accuracy vs distance type* at diffetrent number of neighbours.
Fig. 8(b) Percent Testing Accuracy vs number of neighbours at different distance type. *DistanceType1:cityblock,2:chebychev,3:mahalanobis,4:minkowski,5:euclidean,6:seuclidean,7:spearman,8:cosine,9:hammi ng,10:jaccard
Fig.8 (a) the plot is shown for percent training accuracy for each distance type * (1 to 10) at different no of neighbour varying from 2 to 9. The training accuracy is highest at 3 nearest neighbour that gradually decreases as no of neighbour and finally becomes constant for large no of neighbour. Similar trend in Fig.8 (b) is observed in distance
[image:5.595.43.556.47.304.2] [image:5.595.42.555.430.663.2]Table I. Percent Accuracy for training data set
Distance- Citybloc
k
Chebyche v
Mahalanobi s
Minkowsk i
Euclidea n
Seuclidea n
Spearma n
Cosin e
Hammin g
Jaccar d
NN:
2 83.54 84.35 80 80.48 84.35 85.64 75.92 75.81 75.8 75.81
3 77.74 77.41 77.74 79.35 79.35 80.64 75.92 75.81 75.8 75.81
4 78.06 77.09 76.77 77.41 77.58 78.7 75.76 75.81 83.06 75.81
5 77.9 76.93 77.25 76.45 76.45 75.96 75.92 75.81 75.8 75.81
6 77.25 76.12 77.09 76.77 76.77 75.96 75.76 75.81 75.8 75.81
7 75.8 75.8 76.29 76.45 76.93 76.12 75.92 75.81 75.8 75.81
8 76.61 76.29 75.8 76.45 76.12 76.45 75.76 75.81 75.8 75.81
9 76.45 75.96 75.96 75.8 75.96 76.61 75.76 75.81 75.8 75.81
10 76.61 76.12 75.64 75.64 77.09 75.8 75.76 75.81 75.8 75.81
Table II. Percent accuracy for testing data set Distance
-
Citybloc k
Chebyche v
Mahalanobi s
Minkowsk i
Euclidea n
Seuclidea n
Spearma n
Cosin e
Hammin g
Jaccar d
NN:
2 70.96 72.41 71.77 69.83 72.09 70 76.72 75.8 75.8 75.8
3 72.25 73.22 73.7 74.03 73.87 77.741 76.88 75.8 75.8 75.8
4 73.22 74.03 72.74 73.54 73.7 74.51 76.72 75.8 75.8 75.8
5 74.19 73.87 74.35 73.38 74.03 74.35 76.55 75.8 75.8 75.8
6 74.83 75.8 73.54 74.35 74.83 74.83 75.9 75.8 75.8 75.8
7 75 74.35 75.48 74.03 75.32 75.48 76.55 75.8 75.8 75.8
8 75 75.32 74.35 75.48 75.64 75.64 76.72 75.8 75.8 75.8
9 75.8 75.16 75.64 75.8 75.32 75.32 76.39 75.8 75.8 75.8
10 74.67 75.48 74.51 75.32 75.8 75 75.9 75.8 75.8 75.8
Table III. Result analysis of Training/Testing dataset
Training dataset analysis Testing dataset analysis
No.of attempt
No. of Neighbour
Distance type
Accuracy (%)
No. of attempt
No. of neighbour.
Distance type
Accuracy (%)
1 2 Chebychev 83.39 1 9 Spearman 76.89
2 2 Euclidean 82.26 2 2 Spearman 76.32
3 2 Euclidean 84.68 3 3 Seuclidean 77.74
4 2 Seuclidean 85.65 4 2 Spearman 76.72
A results which are discuss above are generated after running the KNN algorithm for training and testing dataset at several attempts in each attempt the algorithm autonomously varies the no of neighbour and the distance type. Table I display % accuracy obtained at a specific attempt at which we get highest % accuracy. In this table rows represent the number of neighbours varies from 2 to 10 and columns represent the 10 different distance type. Similarly Table II show the % accuracy obtained during outlier detection by KNN applied on testing data. The result of both table are summarise in Table III for different attempt for both training and testing data. After the result analysis in training dataset 86% accuracy with 2 no of nearest neighbour & seuclidean distance. In testing analysis 78% accuracy with 3 no. of nearest neighbour & seuclidean distance.
VI. CONCLUSION
We calculated entropy of the data segments then trained the KNN using 62 segments of 182 sensor pair records. Each segment length was of 50 samples of 25 second duration. As a performance metrics training and testing accuracy is calculated. The highest accuracy is 86% is obtained and 78% for testing data. The novelty of this approach is that the number outliers that is level of anomaly is predicted and in other journals related to this field only predicts whether anomaly is present or not. It can be concluded that the KNN approach is faster and simpler than other methods. If proper selection of distance and number of neighbours is performed than using the entropy as a feature the anomaly detection can be performed with low complexity and higher accuracy.
ACKNOWLEDGMENT
This work was supported by Faculty of Doctoral Studies and Research (DSR) and Department of Computer Science & Engineering, Integral University, Lucknow under a research manuscript communication number (IU/R&D/2019-MCN000643).
REFERENCES
1. M.L, Braun, “On relevantdimensions in kernel feature spaces”, Journal of Machine LearningResearch 2008.
2. T.Naumowicz, A.Heil, M.Calsyn “Autonomous monitoring of vulnerable habitats using a wireless sensor network”, In : Proceedings of the Workshop on Real-World Wireless Sensor Networks,REALWSN‟08 Glasgow, Scotland, 2008.
3. I.F, Akyildiz, T.Melodia “A survey onwireless multimedia sensor networks”, Journal Computer Networks, The International Journal of Computer and Telecommunications Networking, Volume 51, Issue 4 2007.
4. Rajasegarar S., Leckie C, “Detecting data anomalies in wireless sensor networksSecur.AdHocSens. Netw”, 2009.
5. Garcia-Font, V., Garrigues, C., and Rif-Pous, H. “A Comparative study of anomaly detection techniques for smart city wireless sensor networks”, Sensors, 16(6), 868, 2016.
6. Hastie, T., Tibshirani, R., “Discriminate adaptive nearest neighbour classification”. IEEE Transactions on Pattern Analysis and Machine Intelligence 18(6), 607–616, 1996.
7. https://aidaiict.wordpress.com/10/24/building-a-hand-writtendigit-identifier-and-somemachine-learning basics, 2013.
8. Batista, G.E., Keogh, E.J., Tataw, O.M., de Souza, V.M.: Cid: “An efficient complexity invariant distance for time series”, Data Mining and Knowledge Discovery 28(3), 634–669, 2014.
9. Chen, Y., Hu, B., Keogh, E., Batista, G.E.: Dtw-d, “Time series semi-supervised learning from a single example”, In Proceedings of the 19th ACM SIGKDD International Conferenceon Knowledge Discovery And Data Mining, pp. 383–391, ACM , 2013.
10. S, Bernhard, S, Alexander, M, Klaus-Robert, “Nonlinear component analysis as a kernel eigen value problem”, Neural Computation, v.10 n.5, pp: 1299-1319, 1998.
11. M.A, Rassam, A, Zainal, M.A, Maarof. “One-Class Principal Component Classifier for Anomaly Detection in Wireless Sensor Network”, In 2012 Fourth International Conference on Computational Aspects of Social Networks (CASoN), 271-276, 2012.
12. C, Chakour. “Adaptive kernel principal component analysis for nonlinear time-varying processes monitoring” ICEECA, 2012. 13. Shahin Fatima and Shish Ahmad, "An Exhaustive Review on Security
Issues in Cloud Computing," KSII Transactions on Internet and Information Systems, vol. 13, no. 6, pp. 3219-3237, 2019. DOI: 10.3837/tiis.25.06.2019.
14. Shish Ahmad, DR. Mohd. Rizwan beg “Energy Saving Secure Framework for Sensor Network using Elliptic Curve Cryptography” IJCA Special Issue on Mobile Ad-hoc Networks MANETs, 2010. 15. Rajendra Kumar Dwivedi, SonaliPandey, Rakesh Kumar, “A study on
Machine Learning Approaches forOutlier Detection in Wireless Sensor Network”, 8th International Conference on Cloud Computing, Data Science & Engineering (Confluence) 2018.
16. NashreenNesa, Tania Ghosh and Indrajit Banerjee, “Outlier Detection in Sensed Data using Statistical Learning Models for IoT”, IEEE Wireless Communications and Networking Conference (WCNC), 2018.
17. ThahaMuhammed, Riaz Ahmed Shaikh, “An Analysis of Fault Detection Strategies in Wireless Sensor Networks”, Journal of
Network andComputer Applications,
http://dx.doi.org/10.1016/j.jnca.2016.10.019,2016.
18. Victor Garcia-Font,CarlesGarrigues and Helena Rifà-Pous, “A Comparative Study of Anomaly DetectionTechniques for Smart City Wireless Sensor Networks” www.mdpi.com/journal/sensors,Sensors 2016.
19. www-personal.umich.edu/~kksreddy/rssdata.html.
20. AymenAbid, Awatef Ben FradjGuiloufi, NejahNasri, “Centralized KNN anomaly detector for WSN”, 12th International Multi-Conference on Systems, Signals & Devices, 978-1-4799-1758-7/15/$31.00, IEEE, 2015.
21. NasirSaeed, Tareq Y. Al-Naffouri, Mohamed-Slim Alouini, “Outlier Detection and Optimal Anchor Placementfor 3D Underwater Optical Wireless Sensor Networks Localization”, 0090-6778, IEEE, 2018. 22. S. Xiuyao, W. Mingxi, C. Jermaine, and S. Ranka, “Conditional
anomaly detection”, IEEE Trans. Knowl. Data Eng., vol. 19, no. 5, pp. 631–644, 2007.
AUTHORS PROFILE
Manmohan Singh Yadav pursuing his Doctorate in computer science & engineering from Integral University, Lucknow, Utter Pradesh, India got enrolled in 2015 session and his research is going on Data Mining & wireless sensor network and done M.Tech. from AKTU University, Lucknow, Utter Pradesh, India. I have been working as the Assistant Professor of Computer Science & Engineering at Azad Institute of Engineering & Technology Lucknow, UP. I have taught more than 7 subjects of Computer science & engineering in both Under graduate and postgraduate courses, as well as lab sections. I have total academic teaching experience of more than 12 years with more than 13 publications in reputed, peer reviewed National and International Journals. I have guided 6 Dissertation at postgraduate level in the field of Wireless Sensor Network, DBMS and data mining. My research area includes- Data Mining, Machine Learning, wireless sensor network.
Shish Ahamad is currently working as Associate Professor in department of computer science & Engineering, Integral University, Lucknow, India. My total Teaching and research experience is more than 18 years. Currently I am teaching graduate and post graduate courses in Computer Science .I have developed a diverse teaching and research record. I have taught more than 10 subjects of Computer science in both undergraduate and graduate courses, as well as lab sections.
My favourite part of teaching is helping a struggling student learn challenging material by altering my approach to meet his/her needs. I have guided several projects at undergraduate level in field of Database, Security, WSN and Application development. I have guided 16 Dissertation at postgraduate level in the field of MANET, VANET, Cloud computing and Security also guided one Ph.D. scholar in VANET. Currently I am supervising B.Tech, M.Tech and PhD students in various fields of recent trends and technologies. I have published more than 45 research papers in field of computer science in reputed International Journals and conferences including SCI, Scopus, Springer and IEEE.