Abstract: One of the critical problems with K-means clustering is that it only converges to local optima which is easier than solving for global optima but can lead to less optimal convergence. This is particularly true for big data as the initial centers play a very important role on the performance of this algorithm. The paper proposes a novel K-means algorithm which presents a method to find optimized location of initial centers and initial number of clusters. This results in obtaining final set of clusters to converge globally, facilitating fast and accurate clustering over large datasets. Cloud computing implements massive scale and complex computing. Large amounts of data are inexpensively and efficiently analyzed by using parallelism technique. To acquire parallelism and scalable computing, R Studio server is deployed on Amazon Web Service Elastic Compute Cloud instance which divides the job among various nodes. The proposed methodology presents a very competitive performance taking considerable less computation time and cost effective. It can be compared to complex Hadoop Distributed File System and MapReduce A major drawback with Apache Hadoop is its MapReduce paradigm that is highly receptive when a process iterates number of times. R performs execution within memory which is faster and less complex as compared to Read/Write to the disk repeatedly in MapReduce. The research work is simulated on some popular real datasets from UCI Machine Learning repository. The results confirm that the proposed work models a robust and scalable technique for clustering big datasets.
Index Terms: Artificial Intelligence, Big Data, Cloud Computing, K-means, MapReduce; R
I. INTRODUCTION
Earlier, information technology did not have present day’s vast horizon and was limited to universities, government establishments, technology organizations and large business houses before the emergence of cloud computing. The development of cloud computing served information technology to the masses with much reduced cost and vast choices out of the applications available [1]. With this popularization of information technology, it is now being observed that huge volume of information are generated through social media, emails, Internet of Things (IoT), search engines, transaction records, financial markets, multimedia and more in either structured or unstructured format. This created a new global world of data known as Big Data [1]. Today business world essentially requires Big Data and Cloud computing [2]. Big Data provides desired business insights and cloud makes it possible to store and analyze this data by providing computational powers virtually to the users. Also, this technology ensures that such data can be easily accessible. Contemporary technologies have made it
Revised Manuscript Received on May 06, 2019
Agnivesh, AIIT, Amity University, Lucknow, India
Dr. Rajiv Pandey, AIIT, Amity University, Lucknow, India
Dr. Amarjeet Singh, Department of Computer Science, Sriram Institute of
Technology and Management, Kashipur, India
possible to analyze extremely large and varied datasets which are complex as well, for example Apache Hadoop. This is creating much value for organizations and assisting in business growth. Accessibility convenience and cost effectiveness offered by cloud technology in handling these huge amounts of data is creating much value for organizations and facilitating in business growth [2]. Clustering is a big data analytics technique to find useful patterns from a large database [3]. These patterns are very useful for the researchers and knowledge workers such as financial analyst and manager to take right decisions. Applying clustering to big data is a difficult task because it imposes certain challenges. High computational costs incur when large magnitude of data e.g. terabytes to petabytes of data are taken into consideration for clustering. To achieve quality results as quick as possible, the matter of importance is the way to manage this problem.
K-means clustering is an unsupervised machine learning algorithm. It is preferred as the attractiveness lies in its efficiency with O(n*K*i*a), where n, K, I and a equals number of data points, clusters, iterations and attributes respectively. However, it tends to be non-determinable even with smallest even number of clusters [4]. Therefore, scalability is a major challenge in analyzing big data applying K-means.
II. LITERATUREREVIEW
The research for clustering big data is a continuous phenomenon and much has been done in this field in the recent few years. Researchers have been endeavoring to improve further and further big data analytics.
Researchers in [5] worked on multidimensional large dataset to discuss issues while clustering large datasets with MapReduce. They proposed a parallel clustering method through Hadoop MapReduce framework which focused on a key factor of reducing I/O and network costs. Faster execution and scaling were two crucial points to deal with. Deriving from the behavior of birds in a flock, one of the solutions has been found. In the recent past, the graphics processing unit (GPU) gained attraction. It is able to solve very quickly problems of parallelism. Researchers in [6] applied this concept using CUDA platform from NVIDIA GPU. Similarly, in [7] used DBSCAN algorithm on GPU to gain high performance.
In 2013, Xiao Cai and co-authors [8] concisely reflected on collection of data from various sources, each source
representing a different aspect of the data. Since each source has its own individual aspect, therefore, clustering of big data here becomes difficult. They presented a novel method to combine amalgamated
representation of large datasets. Furthermore, researchers in [9] presented
Enhancing K-means for Multidimensional Big
Data Clustering using R on Cloud
an algorithm to improve K-means clustering by obtaining initial centroids. Kodinariya1and Makwana reviewed K-means clustering on determining number of clusters [10]. Kim et al., in 2014 [11] proposed a clustering algorithm which was density based. It was able to analyze datasets of different densities.
In [12] Cui et al., the researchers mentioned MapReduce to be unstable due to iterations which involve restarting jobs again and again. They proposed a new model of processing big data using K-means algorithm devoid of iterations.
Application of K-means clustering methods in detecting similarity between documents or plagiarism is another topic of importance which has been taken up by K.Vani and D. Gupta in their paper [13] published in the year 2015. For comparing documents the fundamental requirements are collection of comparatively large number of data, categorization and evolving automatic methods of quick comparison as well as analysis. They utilized different variations of K-means algorithm to compare with N-gram method and vector space model method to evaluate finally performance and analysis by availing dataset from PAN-2013. By the time taken in execution of the algorithm efficiency and precision are determined in their process. Furthermore, Bide & Shedge in [14] also worked on clustering text documents for similarity check. Deliberating that output is fully dependent on input of number of clusters, they affirmed keyword as input. They created subset of documents for achieving desired results.
Tsai with co-researchers in [15] write that one of the main reasons of failure in clustering large datasets by traditional clustering methods is that most of them are designed for centralized systems. In their paper they proposed to solve this problem by an algorithm which they termed as MapReduce Black Hole (MRBH) which accelerated clustering.
Problem of initial cluster centers in K-means algorithm was tried to be solved by researchers in Wu et al. [16] by sampling the large dataset and used convex hull and opposite Chung points. They applied MapReduce framework for parallel execution of the algorithm.
X. Cui in next research work [17] again improved K-means. Unlike conventional K-means algorithm the new algorithm used both within cluster concentration and between cluster segregation.
Comparing K-means and K-medoids clustering algorithms J. Kaur and H. Singh presented a new hybrid approach furthering birch and K-means. Firstly, a tree of hierarchical clustering is created. Then K-means partitioning is applied to reduce the number of clusters for efficient performance of it. Utility of this algorithm has been found in banking sector [18].
Clustering of images also has become a prominent field of research because of its commercial and social importance currently. Dhanachandra and co-authors in [19] worked on image partitioning using K-means. In their process, image is partially elongated to improve its quality in the first step. In the next step, based on the potential value of the data points, centers of the clusters are generated. Finally those portions which are not required are filtered from the image.
Authors of [20] compared K-means and K-medoids. They applied nearly ten thousand transactions of KEEL dataset repository. Results described that K-medoids is better than K-means in terms of execution time, noise minimization and choosing initial center.
Automating the number of clusters was evolved by authors in [21]. It was again an algorithm for big data analytics dividing large datasets into K partitions. This discovery is simulated using Spark platform.
Further, researchers studied K-means, Fuzzy C-Means (FCM), hierarchical clustering algorithm like Balanced Iterative Reducing and Clustering using Hierarchies (BIRCH) and grid based clustering algorithm Clustering In QUEst (CLIQUE) which are the prevailing effective algorithms. Ajin and Lekshmy [22] compared them in context of big data. A new inter and intra K-means clustering (KM-I2C) algorithm was developed in [23] by changing clustering distance metric that used parallelization tools through Hadoop.
Rehioui et al. [24] in their research presented a new version of DENCLUE called DENCLUE-IM which avoids complexities of other DENCLUE algorithms for speedy calculation of big data. They compared the proposed
approach with DENCLUE, DENCLUE-SA and
DENCLUE-GA.
A concept of big data in form of streams and how to process them was presented by Giacomo Aletti and the co-author in their research in [25]. Datasets having components of characteristics which find correlation were considered. They used Mahalanobis distances for assignment of data to clusters estimating total number of clusters.
Researchers in [26] worked on clusters where boundaries are not firm with certainty. There are lower and upper approximations. The algorithm proposed by them was based on weighted distance measure with Gaussian function for computing the new center for each cluster.
Without taking into account selection of initial centers of clusters, Vijay et al. in [27] presented an algorithm which they termed as Variance Based Moving K-means (VBKM). They applied a new distance measure. Moreover, the research work used a different approach for moving data points between clusters to minimize within cluster distance. Most of above mentioned researches are based on Hadoop paradigm. A major drawback with Apache Hadoop is its MapReduce paradigm that is highly receptive when a process iterates number of times. Iteration necessitates writing back data to the file system and therefore cost of input as well as output increases. Hence MapReduce based K-means becomes much costly. Furthermore, K-means algorithm is needed to be executed multiple times to get the optimal number of clusters. Complexity of this algorithm further increases as and when it is applied to big data.
This research work suggests to process huge amount of data by adopting parallelism through AWS cloud computing environment. R performs execution within memory which is faster and less complex as compared to Read/Write to the disk repeatedly in MapReduce. Nodes of R Studio Server instance are used for dividing computation jobs to be executed through web distribution. Instead of randomizing initial seed configuration, the study proposed to obtain the optimized location of initial seeds and initial number of clusters which is notable for big data clustering. Moreover, the study finds the final set of clusters by merging the initial clusters using a benchmark.
III. EXPLORING
STANDARD K-MEANS
Let us first consider the traditional K-means algorithm for generating clusters of a dataset. It is common knowledge that K-means segregates the data set into K parts where K denotes a positive integer number and stands as a user input to the algorithm. Each cluster has a centroid. The algorithm checks the positions of these centroids as the algorithm iterates. Random values are put to initialize the centroids before the first iteration. The algorithm stops as soon as centroids locations become static during iteration [28]. This well-known algorithm performs two steps per iteration:-
1. Allocate each object xi to a closest cluster centroid cj. This allocation is obtained by Euclidean measure between the object and the cluster's centroid (obtained at a previous iteration).
2. Update the centroids of the clusters based on new clusters members.
The above two steps continue to a finite number of repetitions, until there is no modification or alteration of the cluster centers.
Suppose {x1,....,xn} are the given observations of a multidimensional huge dataset D with d dimensions. The objective is to determine a set of K or cluster centroids C = {c1,….,cK} that minimizes the within cluster distortion given in equation 1:
W C = xni=1 i− c 2 (1)
The above equation defines a cluster assignment rule as
f x = arg minf∈{1,..,K} x − af 2 (2)
The problem of choosing K, the number of clusters and cluster centers, can be considered to be a model determination problem.
Algorithm: Standard K-means Input: Dataset D={x1,….,xn} and K (number of clusters to be generated)
Step 1: Select centers C randomly from D
Step 2: If u > iter then /* loop repeats until convergence Step 3: for each xi compute distance from all centers Cj dist(xi, Cj)
Step 4: Assign xi to closest Cj (min(dist(xi, Cj)) Step 5: Calculate new centroid
n𝑖 =c1
i xi
ci
i=1 Step 6: end for
Step 7: End if Step 8: Exit
This is a standard procedure of clustering datasets using K-means algorithm. But the algorithm is vulnerable to certain problems:
1. The method to initialize the centroids is not specified. Randomly choosing K of the samples is prevalent.
2. Quality of clustering depends on the initial values for the centroids and it happens that suboptimal partitions are found number of times. Trying a number of different starting points is only a solution which is used mostly.
3. Value of K affects results.
4. The standard algorithm is simple but it has high time complexity when the datasets are large multidimensional. Under this circumstance the memory of a single machine could not be sufficient.
IV. SCALING UP K-MEANS VIA MAPREDUCE
Standard data warehousing, management and analysis systems lack tools to analyze Big Data. Big Data is stored in distributed file system architectures due to its specific characteristics. Apache’s Hadoop is widely used for storing and managing Big Data. Analysis of Big Data is a major issue as it involves large distributed file systems which should be scalable and fault tolerant. MapReduce is widely applied for the efficient analysis of Big Data [29].
Nowadays, K-means clustering is being used for Big Data analysis in MapReduce framework by many data scientists. The crucial aspect of implementation of K-means algorithm is the design of Mapper and Reducer functions. Mapper performs the operation of assigning observations to closest cluster center and Reducer revises cluster centers as mean of assigned observations.
For a given xi in the dataset, the Map phase computes the squared distance between xi and each randomly selected cluster centers and obtains the mean µi which minimizes this distance. A key-value pair is emitted with this mean’s index i and the data point xi as the value.
𝑧𝑖 ← 𝑎𝑟𝑔𝑚𝑖𝑛𝑗 𝜇𝑗− 𝑥𝑖 22 emit (zi, xi)
The Reduce phase is re-centering step. The Reducer sums all the assigned observations and divides by the total number of observations assigned to the same cluster. This gives average of assigned observations as a result [29].
𝜇𝑗 = 1
𝑛𝑗𝑖;𝑧 𝑥𝑖 𝑖=𝐾 sum = 0 count = 0
For x in x_in_cluster j Sum+=x
Count+= 1 emit (j, sum/count)
V. PROPOSED WORK
To achieve global optima in analyzing big data, it is necessary to obtain optimized initial centers. For this, the research work presents some improvements in the clustering process of traditional K-means algorithm. The work consists
of two processes-
Algorithm1 and Algorithm 2.
Algorithm 1 computes and
takes an extensive value of K. For cluster 1, the algorithm takes an observation randomly from the training dataset and the point corresponding to this observation is the first initial seed.
Then, Algorithm 1 applies likelihood function to find balance K-1 points which is given by equation 3 below:
L x = ni=1 Kj=1 xi−Cj
max xi−Cj
K j=1 n
i=1 (3)
To find the initial centers, following algorithm is applied:
Algorithm 1: Finding Optimal Location of Initial Seeds
Step 1: Select c1 randomly from D Step 2: If |center|< K then
Next sampling of remaining centers to be taken up by applying equation (3)
Step 3: End If Step 4: Exit
When the initial centers are selected data points are assigned to them as it is performed in the basic K-Means algorithm. Algorithm 2 compares the distance between these large numbers of initial centroids with an edge value and merges these centers in order to reduce number of iterations to converge optimally and find the final set of globally optimized good quality clusters.
ω= K1 K c i=1
i (4)
where K is the number of clusters generated by Algorithm 1 and ci represents the initial clusteroids. The mean distance between any two pairs of centers gives the edge value. The clusters are merged according to the benchmark as given. The distance between all the centroids is computed. These distances are compared with the edge value given in equation 4. If it is observed that edge value is greater than the distance between centroids then they are combined to form a unit cluster. Average of all such combined points represents the new cluster centroid.
Algorithm 2: Merging Centroids based on an Edge Value
Input: D and initial K centers
Output: C= {c1,c2,…..,ck} (set of cluster centroids) L= {l(d) | d= 1,2,…..,n}
(set of cluster labels of D)
Step 1: Set K, centers from D executing Algorithm 1 Step 2: centroid = center
Step 3: if u > iter then /* loop repeats until convergence
Step 4: for x=1 to n Step 5: for y=1 to k
Step 6: distance[y] = ||d[x] – center[y]|| Step 7: end for
Step 8: distancemax = max distance y
Step 9: centroidx= d∈cluster cluster x x Step 10: end for
Step 11: end if
Step 12: while for all cx Step 13: while for all cy
Step 14: if x = y then add x to merge[x] continue
Step 15: end if
Step 16: if dist x, y ≤ω then add y to merge x delete y from centroid Step 17: end if
Step 18: end while
Step 19: compute new centroid
centroidfinal =
mergex
mergex Step 20: end while
Step 21: Exit
VI. EXPERIMENTAL DESIGN
A. Machines
The research work is simulated on Amazon Elastic Compute Cloud (EC2). It imparts scalable computing power in the Amazon Web Services (AWS) cloud. A virtual computing environment template is selected from EC2. This is c3.xlarge instance of R Studio Server. It has following characteristics: cluster of 14 ECUs, 4 vCPUs having 2.8 GHz Intel Xeon E5-2680v2, RAM allocated is 7.5 GB memory with 2x40 GB Storage Capacity. Ubuntu-14.04-LTS-64 bit operating system was installed on each node. I/O performance is high. Coding of the proposed algorithm is written in R script. All the instances are launched using the same Amazon Machine Image (AMI).
B. Datasets
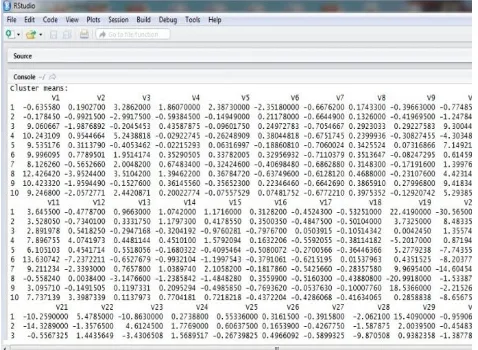
Datasets used in the experiment are real datasets imported from UCI Machine Learning Repository. Fig. 1 shows the input dataset. The datasets are YouTube Multiview Video Games Dataset and Daily and Sports Activities Datasets. After data cleaning, these raw datasets are transformed into understandable format. YouTube Multiview Video Games dataset is segregated into Data1, Data2 and Data3. Daily and Sports Activities datasets are partitioned into DSA1, DSA2, DSA3 and DSA4 datasets. The datasets vary in size from 128 MB to 934MB. Daily and Sports Activities Dataset is collected by providing sensors to monitor motion of sports activities at the rate 19 per day. Data values are real as recorded by the collectors. The details about the datasets are given in Table 1.
YouTube Multiview Video Games Dataset has nearly 120 thousands records with 1 million attributes. Characteristics of this dataset are multivariate. Attributes contain integer and real values.
Table I: Statistics of 7 large-scale real datasets
Dataset No. of
Samples
No. of Dimensions
Size
Data1 97,935 838 706MB
Data2 97,935 838 706MB
Data3 97,935 838 706MB
DSA1 2,85,000 45 128MB
DSA2 5,70,000 45 257MB
DSA3 1,140,000 45 467MB
Fig. 1 Input dataset to the proposed system
VII. RESULTS AND DISCUSSION
Comparing the presented work with standard K-means algorithm and K-means MapReduce (MR) algorithm, we sum up the experimental results run on the setup.
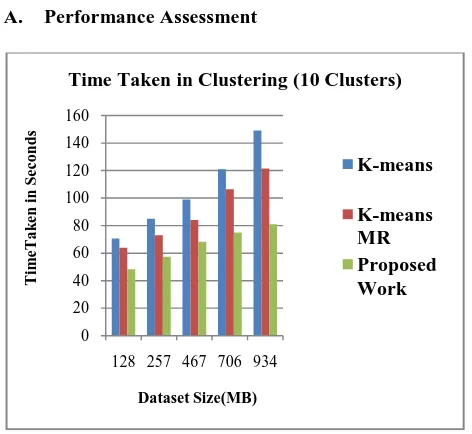
[image:5.595.54.288.51.213.2]A. Performance Assessment
Fig. 2 Comparison of Execution Time for 10 Clusters
Fig. 2 shows execution times of the datasets in generation of 10 clusters by the three algorithms.
[image:5.595.303.539.295.469.2]Fig. 3 Comparison of Execution Time for 15 Clusters
Fig. 3 illustrates the execution time of the datasets in generating 15 clusters by the three algorithms.
Fig. 4 Comparing Execution Time with Dataset size
Table 2: Execution time in seconds Dataset Standard
K-means
K-means MapReduce
Proposed Work
128 60.57 54.13 43.37
257 75.88 63.04 45.42
467 97.00 78.92 56.25
706 118.97 96.54 67.94
934 143.25 111.49 74.16
Table 2 presents execution times of the three comparing algorithms for 15 clusters with dataset size ranging from 128 MB to 934 MB.
In Fig. 4 the x-axis represents dataset sizes in mega bytes and y-axis represents execution time in seconds. The red curve in the graph represents execution time of standard K-means which varies between 60.57 seconds to 143.25 seconds. The green curve in the graph represents execution time of K-means MapReduce algorithm which varies between 54.13 seconds to 111.49 seconds. The blue curve in the graph represents execution time of our proposed work which varies between 43.37seconds to
74.16 seconds.
Evidently the proposed
algorithm reduces
0 20 40 60 80 100 120 140 160
128 257 467 706 934
T
im
eT
a
k
en
i
n
S
ec
o
n
d
s
Dataset Size(MB)
Time Taken in Clustering (10 Clusters)
K-means K-means MR Proposed Work
0 20 40 60 80 100 120 140 160
128 257 467 706 934
T
im
eT
a
k
en
in
Sec
o
n
d
s
Dataset Size(MB)
Time Taken in Clustering (15 Clusters)
K-means
K-means MR Proposed Work
0 20 40 60 80 100 120 140 160
128 257 467 706 934
Ex
ec
u
ti
o
n
Ti
m
e
(seco
n
d
s)
Dataset Size(MB)
Comparing Clustering Techniques K-means
[image:5.595.45.281.300.517.2]remarkably the time of execution compared to other algorithms. Here, smallest size dataset is 128 MB and the largest size dataset is 934 MB. The execution time is reduced by application of the proposed algorithm by 28% and 20% respectively compared to standard K-means and K-means MR in execution of smallest dataset. Whereas the reductions in execution times are 48% and 33% respectively compared to standard K-means and K-means MR in execution of the largest dataset.
Proposed algorithm outperforms the other algorithms. It is prominently more advantageous to apply for the larger datasets.
B. Cluster Validity
Cluster validity is a term widely referred when assessment of the results of a clustering algorithm is performed. For measuring “goodness” of a clustering result, there are several validity indices which are applied. S_Dbw is one of the popular validity indices. It has been proposed in [30]. In addition to cluster compactness and separation, S_Dbw considers density of the clusters as well. Lower S_Dbw value indicates better clustering technique. Applying S_Dbw variations within and between clusters are measured. Between clusters variance measures the average separation of clusters denoted by equation 5.
Sep =n1 c
σ vi
σ x
nc
i=1 (5)
Here nc = count of clusters vi = centroid of the ith cluster σ = variance
Within cluster density is defined by equation 6 as given below.
Densityinter =n 1
c nc−1
density mij
{density vi ,density vj }
i=1 i≠j
nc
i=1 (6)
Here mij = midpoint of the distance between vi and vj cluster centroids.
As given in [30], the density function is defined by the number of points in a hyper-sphere whose radius is equal to the average standard deviation of clusters. Precisely the average standard deviation of clusters derived is as referred below:
Stndev =n1
c σ vi
nc
i=1 (7)
Equation 8 defines S_Dbw index as follows
S_Dbw = Sep + Densityinter (8)
Table 3: S_Dbw for distinct K
K Proposed
Work
Traditional K-means
K-means MR
5 0.21513 0.37164 0.34412
10 0.22181 0.39089 0.32735
15 0.24472 0.43276 0.35195
20 0.21366 0.39595 0.33981
25 0.26735 0.48357 0.35422
[image:6.595.306.545.132.307.2]Table 3 shows values of S_Dbw for proposed work, standard K-means and K-means MapReduce algorithms for number of clusters ranging from 5 to 25. It is observed that the work under reference has lower values of S_Dbw compared to the other two algorithms exhibiting distinctly good quality clusters generation.
Fig. 5 Outputs of the proposed work
VIII. CONCLUSION
In this manuscript, we proposed improvements in traditional K-means algorithm to overcome its limitations in clustering big data. The presented work includes two algorithms. Algorithm 1 computes location of initial seeds which are large in number. Algorithm 2 merges these seeds based on an edge Value. We verified the performance of our work on UCI real datasets. The results reflect that these algorithms achieve the purpose.
Experimental results also prove that the proposed work excels traditional K-means and K-means MapReduce algorithms. Proposed algorithm operates competently on big datasets and is cost effective on the framework deployed. Time reduction is of vital importance in any computation. Any experiment which achieves considerable time reduction in computation and delivers quality results finds a proper place in research. Here time reduction achieved is considerable.
REFERENCES
1. V. K. Jain and S. Kumar, "Big Data Analytic Using Cloud Computing," 2015 Second International Conference on Advances in Computing and Communication Engineering, Dehradun, 2015, pp. 667-672. doi: 10.1109/ICACCE.2015.112
2. A. K. Manekar and G. Pradeepini, "Cloud Based Big Data Analytics a Review," 2015 International Conference on Computational Intelligence and Communication Networks (CICN), Jabalpur, 2015, pp.785-788.doi: 10.1109/CICN.2015.160
3. D. Pandove and S. Goel, "A comprehensive study on clustering approaches for big data mining," 2015 2nd International Conference on Electronics and Communication Systems (ICECS), Coimbatore, 2015, pp.1333-1338. doi: 10.1109/ECS.2015.7124801
4. Jia Qiao and Y. Zhang, "Study on K-means method based on Data-Mining," 2015 Chinese Automation Congress (CAC), Wuhan, 2015, pp. 51-54. doi: 10.1109/CAC.2015.7382468
5. R.L.F. Cordeiro, C. Junior Traina, A.J.M. Traina, J. López, U.Kang and C. Faloutsos. (2011). “Clustering very large multidimensional datasets with MapReduce”, In: Proceedings of KDD’11, ACM, California, August 21–24. 2011.
r-1 Photo Generation Computer Systems, 29(7), 1736-1741, (2013).
7. G.Andrade, G. Ramos, D. Madeira, R. Sachetto, R. Ferreira and L. Rocha. (2013). “G-DBSCAN: A gpu accelerated algorithm for densitybased clustering”. Procedia Computer Science, 18, 369-378 8. X. Cai, F. Nie and H. Huang. (2013). Proceedings of the Twenty-Third
International Conference on Artificial Intelligence, Pages 2598-2604, Beijing, China, August 03-09, 2013, ISBN:978-1-57735-6332-2 9. U. Ghosia, U. Ahmad and M. Ahmad. (2013). “Improved K-Means
Clustering Algorithm by Getting Initial Cenroids”, World Applied Sciences Journal 27 (4): 543-551, 2013, ISSN 1818-4952, © IDOSI Publications, 2013, DOI: 10.5829/idosi.wasj.2013.27.04.1142. 10. T.M. Kodinariya1 and P.R. Makwana. (2013). “Review on determining
number of Cluster in K-Means Clustering”, International Journal of Advance Research in Computer Science and Management Studies, ISSN: 2321-7782 (Online), Volume 1, Issue 6, November 2013. 11. Y. Kim, K. Shim, M.S. Kim and J.S. Lee. “DBCURE-MR: an efficient
density-based clustering algorithm for large data using MapReduce”. Information Systems 42, 15-35 (2014).
12. X. Cui, P. Zhu and X. Yang. J Supercomput (2014) 70: 1249.
https://doi.org/10.1007/s11227-014-1225-7
13. D. Gupta and K. Vani. (2015). "Using K-means cluster based techniques in external plagiarism detection," 2014 International Conference on Contemporary Computing and Informatics (IC3I), Mysore, 2014, pp. 1268-1273. doi: 10.1109/IC3I.2014.7019659
14. P. Bide and R Shedge, "Improved Document Clustering using k-means algorithm," 2015 IEEE International Conference on Electrical, Computer and Communication Technologies (ICECCT), Coimbatore, 2015, pp. 1-5.
15. C.W. Tsai, C.H. Hsieh and M.C. Chiang. (2015). “Parallel black hole clustering based on MapReduce”, In: Proceedings of IEEE International Conference on Systems, Man and Cybernetics, 2015. DOI:
10.1109/SMC.2015.445
16. K. Wu, W. Zeng, T. Wu, and Y. An. (2015). “Research and improve on K-means based on hadoop”. Software Engineering and Service Science (ICSESS). 2015 6th IEEE conference, 23-15 september,
2015. DOI: 10.1109/ICSESS.2015.7339068.
17. X. Cui and F. Wang. (2015), "An Improved Method for K-Means Clustering," 2015 International Conference on Computational Intelligence and Communication Networks (CICN), Jabalpur, 2015, pp. 756-759. doi: 10.1109/CICN.2015.154
18. J. Kaur and H. Singh, "Performance evaluation of a novel hybrid clustering algorithm using birch and K-means," 2015 Annual IEEE India Conference (INDICON), New Delhi, 2015, pp. 1-6. doi: 10.1109/INDICON.2015.7443414
19. N. Dhanachandra, K.M. Yambem and J. Chanu. “Image Segmentation Using K -means Clustering Algorithm and Subtractive Clustering Algorithm”, Procedia Computer Science, Volume 54, 2015, Pages 764-771,https://doi.org/10.1016/j.procs.2015.06.090
20. P. Arora, Deepali and S. Varshney. “Analysis of K-Means and K-Medoids Algorithm For Big Data”, Volume 78, 2016, Pages 507-512.
https://doi.org/10.1016/j.procs.2016.02.095
21. A. Sinha and P.K. Jana. “A novel K-Means based clustering algorithm for big Data”, IEEE International Conference on Advances in
Computing, Communications and Informatics (ICACCI), 21-24
Sept. 2016, Electronic ISBN: 978-1-5090-2029-4.
22. V.M. Ajin and L.D. Kumar. (2016). “Big data and clustering algorithms”. 2016 International Conference on Research Advances in
Integrated Navigation Systems (RAINS).
DOI: 10.1109/RAINS.2016.7764405. 6-7 May 2016. IEEE
23. C. Shreedhar, N. Kasiviswanath and P.C. Reddy. “Clustering large datasets using K-means modified inter and intra clustering (KM-I2C) in
Hadoop”. Journal of Big Data (2017). DOI:
10.1186/s40537-017-0087-2. Springer.
24. H. Rehioui, A. Idrissi, Abourezq, M. and Zegrari, F. (2016). DENCLUE-IM: A New Approach for Big Data Clustering. Procedia
Computer Science, Volume 83, 2016, pages 560-567, DOI:
10.1016/j.procs.2016.04.265. ELSEVIER.
25. G. Aletti and A. Micheletti. (2017). “A clustering algorithm for multivariate data streams with correlated components”. Journal of Big Data 2017:48. DOI:10.1186/s40537-017- 0109-0
26. T. Zhang and F. Ma Fumin. (2017). “Improved rough k-means clustering algorithm based on weighted distance measure with Gaussian
function”, International Journal of Computer
Mathematics, 94:4, 663-675,DOI: 10.1080/00207160.2015.1124099 27. V. Vijay, V.P. Raghunath, A. Singh and S. N. Omkar, "Variance Based
Moving K-Means Algorithm," 2017IEEE 7th International Advance Computing Conference (IACC), Hyderabad, 2017, pp. 841-847. doi: 10.1109/IACC.2017.0173
28. A. Saini, J. Minocha, J. Ubriani and D. Sharma, "New approach for clustering of big data: DisK-means," 2016 International Conference on Computing, Communication and Automation (ICCCA), Noida, 2016,pp.122-126. doi: 10.1109/CCAA.2016.7813702
29. S. A. Ghamdi and G. D. Fatta, "Efficient Parallel K-Means on MapReduce Using Triangle Inequality," 2017 IEEE 15th Intl Conf on Dependable, Autonomic and Secure Computing, 15th Intl Conf on Pervasive Intelligence and Computing, 3rd Intl Conf on Big Data Intelligence and Computing and Cyber Science and Technology Congress(DASC/PiCom/DataCom/CyberSciTech), Orlando, FL, 2017, pp. 985-992.
doi: 10.1109/DASC-PICom-DataCom-CyberSciTec.2017.163 30. Halkidi, M., Batistakis, Y. & Vazirgiannis, M. Journal of Intelligent
Information Systems (2001) 17: 107.
https://doi.org/10.1023/A:1012801612483
31. UCI Machine Learning Repository: https://archive.ics.uci.edu (2015)
AUTHORSPROFILE
Mr. Agnivesh, is working as Assistant Professor in Department of Information Technology, D.A-V P.G. College, Kanpur affiliated to C.S.J.M University, Kanpur.. He is M.Tech. (IT). The author is doing Ph.D. in Information Technology from Amity Institute of Information Technology, Amity University, Lucknow Campus, Uttar Pradesh. His research areas include Big data Analytics, Cloud Computing, IoT and Machine Learning. His papers are published in IEEE and Taylor & Francis International Conferences and Scopus Indexed journals. One of his book chapters is published in IGI Global. The book is Scopus Indexed.
Dr. Rajiv Pandey, Senior Member IEEE is a Faculty at Amity Institute of Information Technology, Amity University, Uttar Pradesh, Lucknow Campus, India. He possesses a diverse back ground experience of around 30 years to include 15 years of Industry and 15 years of academic. His research interests include the contemporary technologies as Semantic Web Provenance, Cloud computing, Big-Data, and Data Analytics. He has been on technical Committees of Various Government and Private Universities. He is intellectually involved in supervising Doctorate Research Scholars and Post graduate Students. He is also an active contributor in professional bodies like IEEE, IET and LMA. He is a member of Machine Intelligence Labs.
Dr. Amarjeet Singh, working with