Abstract: Owing to the psychological and physical aftermath post mishaps, healthy environment has become a general passion.Mishaps compose of falls which have become a grave distress for the elderly and diseased living alone. Researchers have involved in finding the optimal alternatives. This includes wearable sensors, artificial intelligence, etc. What is this paper about? It was to find the best approach to efficiently detect a fall with fewer false alarms and was implemented by finding the Histogram of Oriented Gradients along with statistical methods which extracts relevant features and compared it with the trained videos. A supervised learning technique is exploited, where the database is trained with videos that contain both fall and quotidian activities (QA). Support Vector Machine (SVM) is utilized in distinguishing fall and daily events. The doctor/caretaker is intimated via email on detection of fall.
Index terms: GMM, HOG, Real-time processing, Supervised Learning, Statistical feature, SVM
I. INTRODUCTION
There has been a swift growth in hospital admissions reporting falls. The elderly aged above 65 and those with muscular dystrophy and musculoskeletal conditions such as osteoporosis, Parkinson disease, fits and other ailments are likely to suffer a fall and extreme care needs to be provided as a person laying abandoned for an extended time post a fall may have physical injuries followed by physiological damage resulting in economic crisis. The WHO has taken average reports of falls of the elderly aged above 75 and has proposed guidelines on Integrated Care for Older People (ICOPE) to prevent mental and physical decline of older people. The key
actions formulated in the Global strategy and action plan on
aging and health (2016-2020) includes extended monitoring and research to create a safer environment [15]. The Qatar National Vision 2030 states that ―An integrated system of health care will be created offering high-quality services through private and public organizations and system will be formed to provide funding‖ [16]. This has led to extensive investigation in the area of fall analysis which includes systems with wearable sensors that are embedded into the patient’s clothes, belt, shoes along with the accelerometer, gyro-meters which are based on threshold technique. The use of Microsoft Kinect, depth camera, video surveillance et cetera can also be seen. Subsequently recent findings show that Artificial Intelligence proves to be ahead of all in relation to processing speed and accuracy. The following section
Revised Manuscript Received on May 10 ,2019
Hephzibah Thomas, Department of Electronics and Communication, KCG College of Technology
Thyla B. Department of Electronics and Communication, KCG College of Technology
gives an overview of researches done to improve accuracy in identifying a fall. Eventually the system overview and methodology of the proposed system has been elaborated. The results are discussed, formulated and future outlook has been visualized.
II. RELATED WORK
Following are some of the research work done which has helped in optimum efficiency in identification and notification of a fall.
In [1], a combination of accelerometer, temperature and heartbeat sensors, Arduino and buzzers has been used to identify a fall. A study on Parkinson disease has been done and discussion has been made on the effective usage of wearable electronics and the role of machine learning, artificial intelligence and IOT in [2]. GMM is extensively used in extracting foreground. Motion along with the distance between the upper edge and center of the rectangle is another method used to extract features [3]. In [4], a survey of different modeling frameworks, learning algorithms and techniques are studied and formulated in table formats. Ellipse approximation and Motion History Image (MHI) are used in [5]. Regardless illumination depth camera can be used in feeble light conditions. Randomized Decision Tree (RDT) algorithm is an alternative extraction method when combined with SVM classifier gives an accuracy of 97.6% [6]. Curvature Scale Space (CSS) of a human silhouette is also used as a feature extraction method. Extensive Learning Machine (ELM) surpasses Support Vector Machine (SVM) in terms of processing speed and gives an accuracy of 86.63% [7]. Deep learning followed by transfer learning is another method which gave an accuracy of 99% for unknown surrounding [8]. A new feature comprising of Histograms of Oriented Gradients (HOG), Local Binary Pattern (LBP) and the recent Deep Learning Framework Caffe was exploited in [9].In [10], a Microsoft Kinect is stationed few inches beneath the ceiling and decision trees that ensure a fall has happened.
In [11], human extraction using Gaussian model and principal component analysis (PCA) gives an accuracy of 86.21%.
III. FALL DETECTION
Intention of the paper is to recognize a fall using a mixture of feature extraction methods and supervised learning algorithm. 20 events that comprehend fall and quotidian activities are trained and Support Vector Machine
(SVM) is employed in
classifying fall from daily activities. Gaussian Mixture Model (GMM) removes the
Remote Fall Tracking using Multiple Extraction
Methods and Supervised Learning
background. Eventually features are elicited using HOG statistical and Blob. On detecting a fall, an email is generated at the doctor’s end. An overview of the system has been depicted in fig 1.
Fig 1: Fall Detection System
A. Database:
The dataset was taken from the available database [14] from
which 20 videos were taken for training:
http://le2i.cnrs.fr/Fall-detection-Dataset?lang=fr. The actors have enacted the videos in an office room. The videos are separated into frames at a rate of 30fps and each frame having 320 x 240 resolution.
IV. SYSTEM OVERVIEW
A. Image Acquisition:
Real-time activities from video surveillance are monitored. While implementing this in MATLAB the Image Acquisition Toolbox and USB Webcam toolbox are to be installed to get a live coverage of events in the room. The videos are divided into frames which are Red, Green, and Blue (RGB). These RGB images are converted to their gray scale images. Then each frame is re-sized, filtered and segmented. This is followed by feature extraction which includes various methods. Videos and images are trained to identify the output.
B. Enhancement
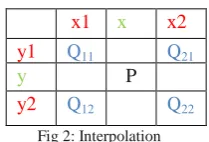
Down scaling of an image results in resizing it for further processing. Alternatively, it is termed as interpolation. Here, known points are mapped to unknown points.
Bilinear Interpolation is a method where weighted average of four nearest neighbors in a 2D image is mapped to another point. Consider the following image in fig 2.
x1 x x2
y1 Q11 Q21
y P
y2 Q12 Q22
Fig 2: Interpolation
Consider P is the point where the neighbors will be mapped, interpolation in the x direction is given by:
P=
+
+ …
(1)
Here, the frames are resized into 256 * 256 dimensioned images which are then filtered to get rid of noise. A Gaussian filter is utilized here since it is a linear filter and helps blur the image and reduce noise. In MATLAB (fspecial) is used to return a rotationally symmetric Gaussian filter for an h size matrix.
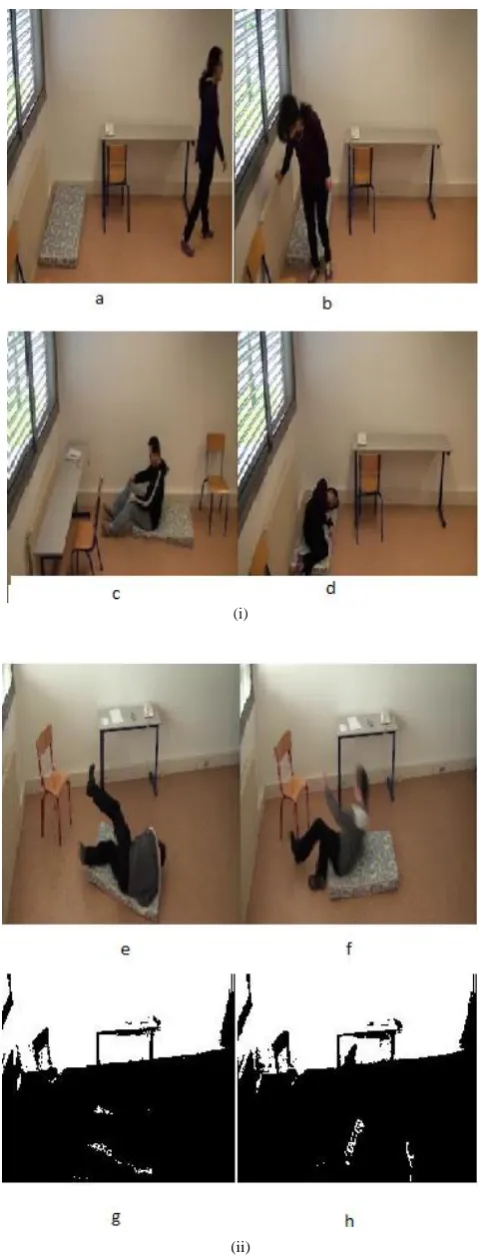
We need to extract the human image from the event for which Gaussian Mixture Model (GMM) algorithm. This Expectation Maximization comprises of 2 steps:
(i) Mean, Variance and a mixing proportion are the components that are set to an initial value. The algorithm calculates the posterior probabilities of the components. This is the E step
(ii) Using the above, the algorithm calculates the component means, covariance and mixing proportion by implementing maximum likelihood.
This removes the background information
.
V. METHODOLOGY
The algorithm of the designed system is given in the steps below:
i. The video converted to frames is enhanced as stated above. ii. HOG is performed on each frame.
iii. Statistical features are found.
iv. The obtained values are compared with the trained values. v. An SVM is used to classify the event.
The mathematical elaboration follows.
A. Feature Extraction:
A fusion of Histogram of Oriented Gradients (HOG) and statistical features used to obtain the required features. Histogram of Oriented Gradients (HOG) feature descriptor is vector that is obtained of length N. It converts an image of dimension length x width x 3 into an N long Vector. To estimate HOG feature, horizontal and vertical gradients should be known. This is determined using the shown kernels in fig 3:
Fig 3: Horizontal and Vertical Kernel
The magnitude and direction of gradient is worked out using:
2 2
) , ( ) , ( ) ,
(y x G y x G y x
G x y (1)
) , (
) , ( arctan )
, (
x y G
x y G x
y
x y
(2) Where, gx is the magnitude in the y direction, gy is the
magnitude towards x direction and ϴ is the direction. The image is divided into an 8 x 8 cell. Since there are two components, magnitude and
direction, the total number of pixel values will be 8 x 8x 2 =
-1
0
1
[image:2.595.118.223.690.761.2]128 pixel numbers. The purpose of HOG is to reduce this number to a nine digit bin from where we obtain the required information. The angular bin values vary as 0. 20. 40…. 160. For the feature to be not reliant on illumination, 16 x 16 block histogram is also calculated by normalizing the histogram vector. This feature also depicts the direction according to the motion of the human orientation. Combining several feature extraction methods contributes to better fall detection. The statistical features used include mean, standard deviation, entropy, variance, smoothness, kurtosis, skewness.
Mean: The mean is also known as an averaging filter and is operated using a sliding window of m x n window. The average of all pixels is taken and the central pixel in the destination image is replaced by the result.
) , ( 1 ) , ( ) , ( c r g mn y x f W c r
(3) Standard Deviation: This feature decides how much the data points vary from the average / mean. If the SD is small, then the data points are close to the mean. If the SD is high the data points are spread apart and are away from the mean. 2 ) , ( ) , ( \ )) , ( 1 1 ) . ( ( 1 1 ) ,
( g r c
mn c r g mn y x f W c r W c
r
(4)
Entropy: Entropy is a measure of disorder. It is used to characterize texture based on certain patterns. If all the pixels in an image contain different values and also has a perfect histogram, then the entropy is maximum. If threshold is applied to image, the entropy is low and all the pixels have the same value then the entropy is zero.
)
(
log
2 k kk
p
p
H
(5)Variance: Variance describes how far the numbers lie away from the mean It describes probability distribution. It is calculated by taking the difference between the numbers and the mean. Then the difference is squared and dividin the sum of all squares by the number of values in the set.
2 ) , (
))
,
(
1
1
)
,
(
(
1
1
)
,
(
g
r
c
mn
c
r
g
mn
y
x
f
W c r
(6) Smoothness: Smoothness is to capture important information / patterns and leave all the noise. Sum of all the data in thearray is taken and the following equation is applied. a S 1 1
1 (7) Kurtosis: Kurtosis somehow detects if a distribution is flat or peaky, and later was associated to perceptual aspects of sparse coding. It is often considered as a measure a sparsity, and used in early deconvolution methods. Kurtosis is a measure of shape of the probability distribution. It is closely related to the fourth moment of the distribution. High kurtosis implies images with low noise and resolution and vice versa. Kurtosis deals with fourth moment.
2 2 4
m
m
k
(8)Skewness: Skewness is measure of asymmetry of probability distribution. If the bulk of the data is at the left and the right tail is longer, we say that the distribution is skewed right or
positively skewed; if the peak is toward the right and the left tail is longer, we say that the distribution is skewed left or negatively skewed. If skewness is negative, then the histogram is negatively skewed. That is frequency over the darker side is wide. It is calculated by:
2 3 2 3 1 m m
g (9) Inverse Difference Moment: It is contributed to by the homogeneity of the image. Because of the divisor factor (1+(i−j) 2) -1 there will be small contribution by the inhomogeneous area. j i j i P j i
IDM 2 ,
) ( 1 1
(10)
B
.
Classification:
Support Vector Machine (SVM) classifies events, objects and gives a graphical representation. Models are trained to
classify with greater accuracy and lower computation power
.
The aim of SVM is to find the appropriate hyperplane that best separates the classes. They are decision edges and can be large in number. But the leading one would be with the maximum margin distance between the two classes.
There are 2 categories: linear and non - linear. The linear classifier separates data using a straight hyperplane. Whereas a customized hyperplane is used to classify non - linear data which results in the formation of kernel function.
d ) C + y T x ( ) ,
(x y
K (11)
The output of the linear function can be suppressed within [0, 1] with the help of sigmoid function. If the suppressed function exceeds [0.5], then the label is marked as 1 else it is labeled 0. Similarly, if the function exceeds [1], the output is -1, if it is less than 0, the output is 1. Here, [-1, 1] acts as the margin.
The purpose is to maximize the margin between the event / data and the hyperplane. This is done by finding the loss function called the hinge loss and is given by:
0
,
*
(
)
1
))
(
,
,
(
x
y
f
x
ify
f
x
c
(12)1 - y* f(x), else
VI. RESULT
The project has been trained with 20 videos which include fall and daily activities videos. The platform used here is Matlab 2016a and has been tested on a personal laptop that has a CORE i3 processor with 4GB RAM. The videos have been captured using a USB web camera. Support Vector Machine is used to classify the events.
Table 3: Comparison of accuracy with the existing method
Method True Positive True Negative
Proposed 100% 0%
Fig 3: Support Vector Machine (SVM) graph
Fig 4: Confusion matrix showing 100% accuracy
VII. DISCUSSION
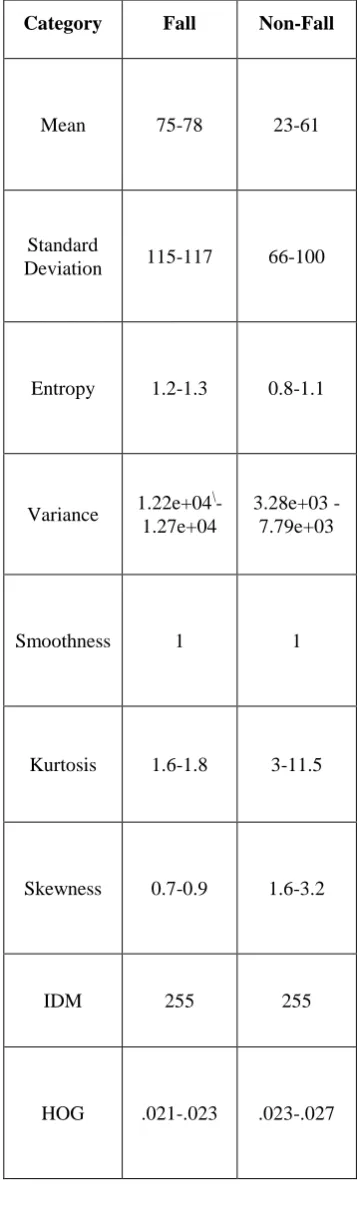
The range of values obtained for each feature has been tabulated in Table 2 and discussed in this section.
The sensitivity and specificity are two measures used to give account of the classifier’s performance.
TP: (True Positive) - Accounts for the fall being detected when there is actually a fall
FP: (False Positive) - This indicates a false alarm stating that a fall has occurred when it has not happened.
TN: (True Negative) - States a no fall for everyday events FN: (False Negative) - This gives a false fall alarm for a daily event like sitting, bending.
Sensitivity (Efficient Fall Detection) =
FN TP
TP
(13)
Specificity (QA detected as no fall) =
FP TN
TN
(14)
Accuracy =
FN FP TN TP
TN TP
(15)
(i)
(ii)
[image:4.595.307.547.46.676.2]Table 2: Comparative table for features used
VIII. CONCLUSION AND FUTURE SCOPE This framework employed Gaussian Mixed Model (GMM) to extract the foreground image followed by feature extraction comprising of Histogram of Oriented Gradients (HOG) and statistical features. Datasets that contained 20 videos were familiarized for training and testing. This utilized supervised learning technique. The events were
classified using Support Vector Machine (SVM).
Experimental results produced an accuracy of 100% which surpasses the existing method. Forthcoming vision is to train images and video under different circumstances and build a prototype.
REFERENCES
1. Yosra Ismail, Mariem Kallel, Loay Ismail,‖ RAFDS: Remote Abnormality and Fall Detection System for Assisting Older Persons‖, International Journal of Advanced Research in Computer and Communication Engineering, Volume, Issue 7, July 2015
2. Cristian F. Pasluosta, Heiko Gassner, Juergen Winkler, Jochen Klucken, and Bjoern M. Eskofier, ‖An Emerging Era in the Management of Parkinson’s disease: Wearable Technologies and the Internet of Things‖, IEEE Journal of Biomedical and Health Informatics, 2015
3. Subhash Chand Agrawal; Rajesh Kumar Tripathi; Anand Singh Jalal, ―Human fall detection from an indoor video surveillance‖, 2017 8th International Conference on Computing, Communication and Networking Technologies (ICCCNT), Pages 1-5, 2017
4. Oluwatoyin P. Popoola; Kejun Wang, ―Video-Based Abnormal Human Behavior Recognition—A Review‖IEEE Transactions On Systems, Man, And Cybernetics—Part C: Applications And Reviews, Vol. 42, No. 6, November 2012
5. G M Basavaraj; Ashok Kusagur, ‖Vision based surveillance system for detection of human fall‖, 2nd IEEE International Conference on Recent Trends in Electronics, Information & Communication Technology (RTEICT), Pages 1516-1520, 2017
6. Zhen-Peng Bian ; Junhui Hou ; Lap-Pui Chau ; Nadia Magnenat-Thalmann, ―Fall Detection Based on Body Part Tracking Using a Depth Camera‖, IEEE Journal of Biomedical and Health Informatics, Volume 18, Issue 2, Pages 430 – 439, 2015
7. Xin Ma; Haibo Wang; Bingxia Xue, Mingang Zhou; Bing Ji, and Yibin Li, ―Depth-Based Human Fall Detection via Shape Features and Improved Extreme Learning Machine, IEEE Journal Of Biomedical And Health Informatics, Vol. 18, No. 6, November 2014
8. Lesya Anishchenko, ―Machine learning in video surveillance for fall detection", Ural Symposium on Biomedical Engineering, Radio electronics and Information Technology (USBEREIT), Pages 99-102, 2018
9. Kun Wang; Guitao Cao; Dan Meng; Weiting Chen; Wenming Cao, ―Automatic fall detection of human in video using combination of features‖, IEEE International Conference on Bioinformatics and Biomedicine (BIBM), Pages 1228-1233, 2016
10. Erik E. Stone; Marjorie Skubic, ―Fall Detection in Homes of Older Adults Using the Microsoft Kinect‖, IEEE Journal of Biomedical and Health Informatics, Volume: 19, Issue: 1 , Jan. 2015
11.Arisa Poonsri; Werapon Chiracharit, ―Fall Detection Using Gaussian Mixture Model and Principle Component Analysis‖, 9th International Conference on Information Technology and Electrical Engineering (ICITEE), Phuket, Thailand, 2017
12.N. Noury, A. Fleury, P. Rumeau, a K. Bourke, G. O. Laighin, V. Rialle, and J. E. Lundy, ―Fall detection – principles and methods.,‖ in Engineering in Medicine and Biology Society, 2007, vol. 2007, pp. 1663–1666.
13.Planinc R.; Kampel M., ―Robust Fall Detection by Combining 3D Data and Fuzzy Logic‖, ACCV Workshop on Color Depth Fusion in Computer Vision, Daejeon, Korea, pp. 121-132, November 2012. 14.Zishan Zahidul Islam; Syed Mahir Tazwar; Md. Zahidul Islam; Seiichi
Serikawa, and Md. Atiqur Rahman Ahad, "Automatic fall detection of unsupervised elderly people using smartphone", 5th IIAE International Conference on Intelligent Systems and Image Processing, 2017 15.I. Charfi, J. Mitéran, J. Dubois, M. Atri, R. Tourki, "Optimised
spatio-temporal descriptors for real-time fall detection: comparison of SVM and Adaboost based classification‖, Journal of Electronic Imaging (JEI), Vol.22. Issue.4, pp.17, October 2013.
16.The Global strategy and action plan on ageing and health https://www.who.int/ageing/publications/world-report-2015/en/ 17. Qatar National Vision 2030:
https://www.mdps.gov.qa/en/qnv1/pages/default.aspx
Category Fall Non-Fall
Mean 75-78 23-61
Standard
Deviation 115-117 66-100
Entropy 1.2-1.3 0.8-1.1
Variance 1.22e+04
\
- 1.27e+04
3.28e+03 - 7.79e+03
Smoothness 1 1
Kurtosis 1.6-1.8 3-11.5
Skewness 0.7-0.9 1.6-3.2
IDM 255 255
AUTHORS PROFILE